
EMC Labs July Briefing: Short-handed giant whales falter in rebound, on-chain data supports regaining upward momentum

 The biggest risk should be whether the macro financial market can withstand the high interest rate environment of the US dollar.
Author: EMC Labs
July is a dull month for the repair period. However, the significant improvement in supply data, the ongoing transition between strong and weak hands, and the continuous growth in on-chain activity give us reason to believe that the opportunity is coming, and BTC will break through to the next stage—$38,000.
Macroeconomic Market
On July 26, the Federal Reserve announced an interest rate hike of 25 basis points, raising the target range for the federal funds rate to 5.25~5.5%, the highest level since 2001.
Despite the ongoing pressure from rate hikes, U.S. economic activity continues to expand at a certain pace, with strong job growth and a low unemployment rate, giving the Federal Reserve ample confidence to continue lowering rates to achieve the expected target of 2% inflation.
As it was within expectations, Nasdaq bulls continued to expand, rising 4.05% in July, achieving five consecutive increases. The Dow also recorded a monthly increase of 3.35%.
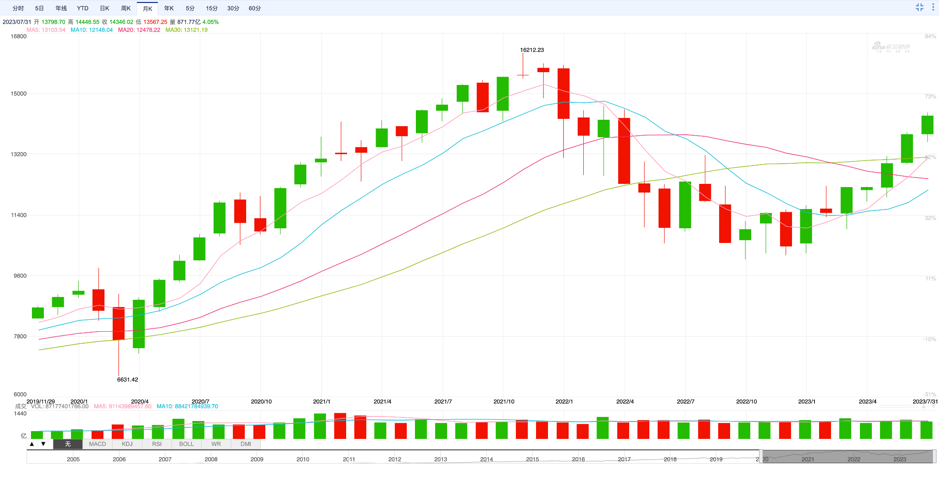
Nasdaq Monthly Trend
The macro financial market is generally within expectations and continues to improve. However, the cryptocurrency market has been relatively dull and stagnant this month, with only the MEME Coin and its ecosystem, such as Unibot, remaining active in a small range, offering very low participation. There has been neither a breakdown of the trend nor a strong force willing to go long; only industry builders are still focused on construction, responding positively to the mid-battle of the repair period.
Cryptocurrency Market Trend
On July 13, BTC reached a rebound high of $31,804 since the end of last year, then fluctuated down to a low of $28,861. Throughout the month, BTC fluctuated around the $30,000 mark, with a monthly decline of 4.07%, and the volatility shrank to 9.66%, with trading volume decreasing by more than 30% compared to the previous month.
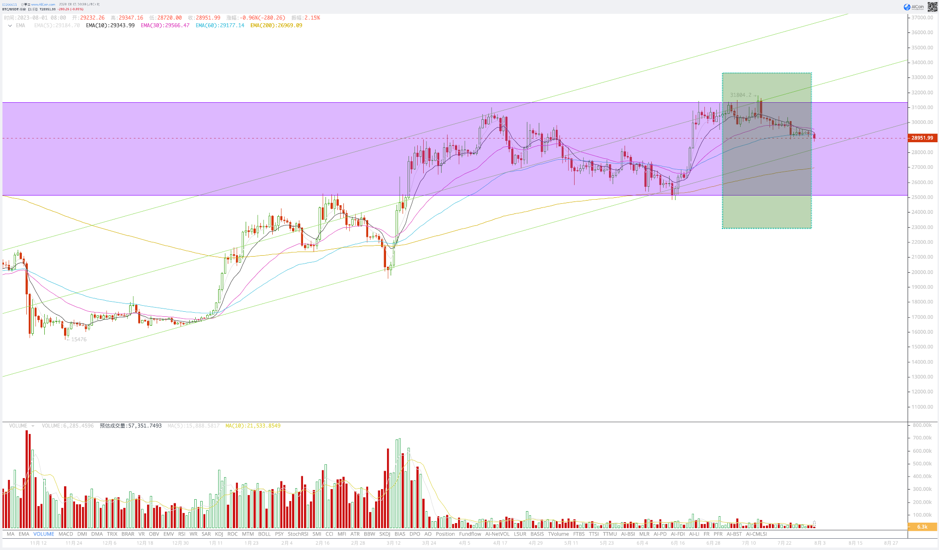
BTC Daily Trend in July
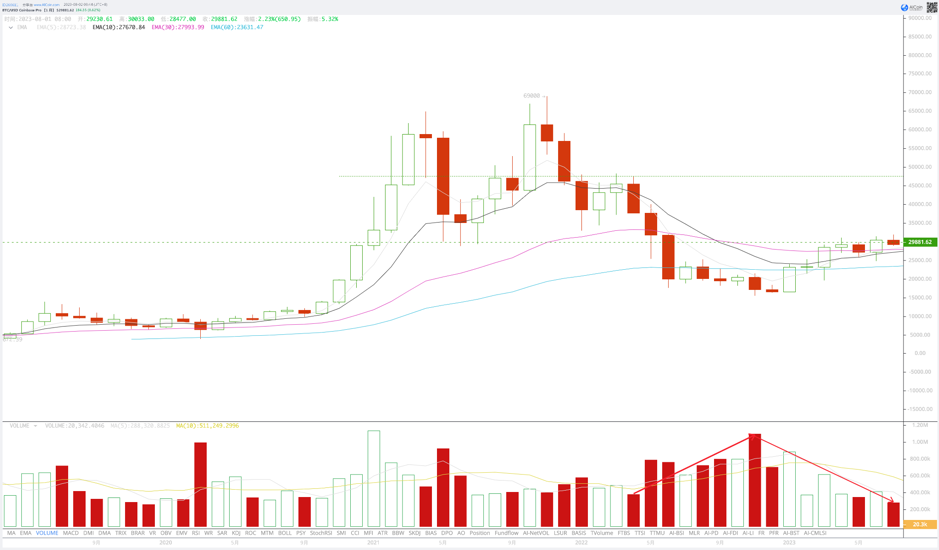
BTC Monthly Trend
Although July failed to effectively break through the midline of the upward channel, BTC remains within the upward channel. A decline in August may reach around $28,000, but given the improving macro financial environment, there is no need for panic; it is highly likely to touch the lower boundary and rebound.
Long and Short Game
Analyzing the positions of market participants can not only determine whether the trend has changed but also assess the effectiveness of the market's current phase.
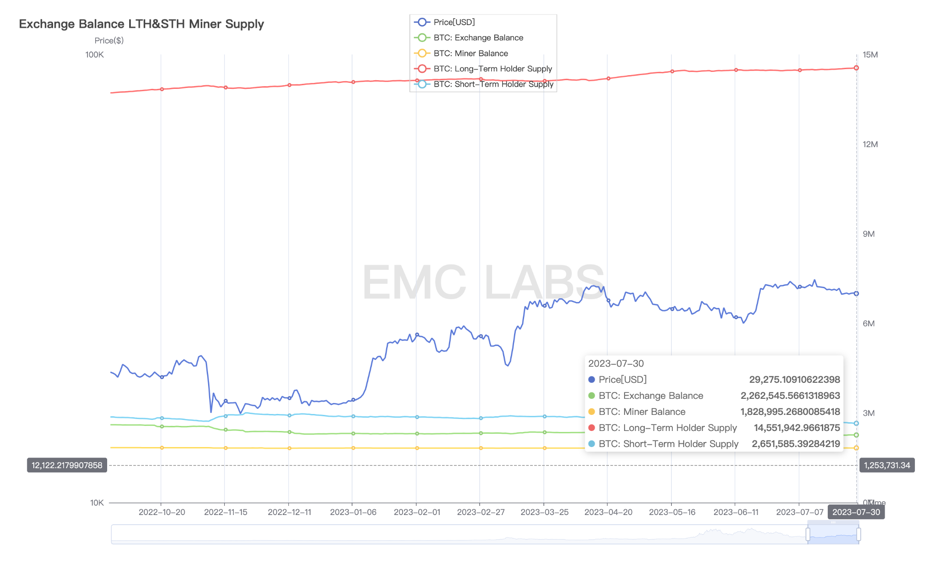
Market Position Sizes of Various Participants
Based on EMC Labs Emergence Engine, we assess that the market is in a repair period, with the current repair index at 66.67%. During this phase, long hands (long-term investors) will continue to increase their holdings, while short hands (short-term investors) will continue to decrease theirs, with the transition of chips achieved through market fluctuations. Ultimately, the overall liquidity of the market is continuously absorbed, leading to a gradual upward movement.
Throughout July------
Long hand positions: increased by 96,000 coins;
Short hand positions: decreased by 20,000 coins;
Exchange inventory: decreased by 40,000 coins.
The data shows that long hands are still collecting chips, and market liquidity is further declining. The position trends of long and short hands have not changed.
Supply Trend
By comparing the cost price with the market price, we can gain insights into the overall market and the profit ratio of long and short hands, allowing us to quantify supply pressure.
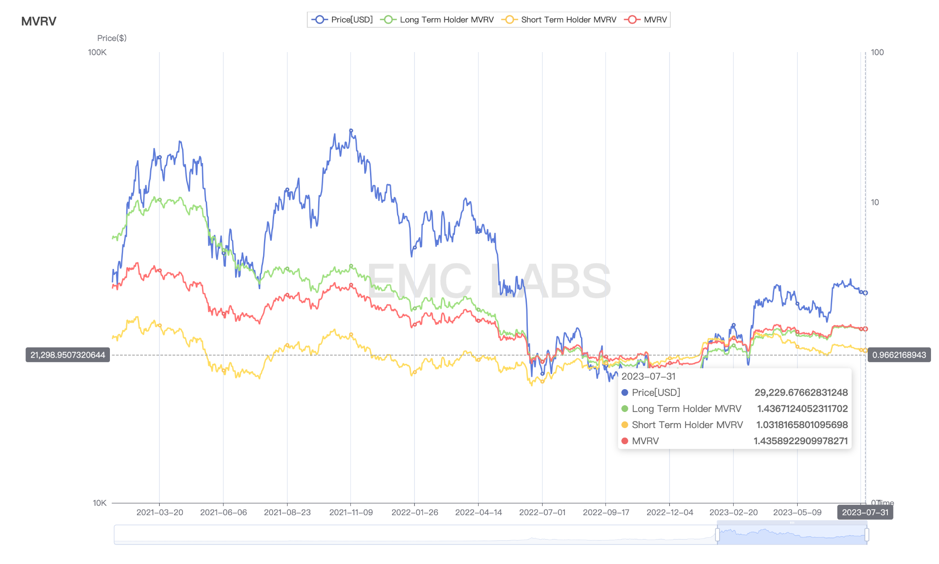
Market Supply Pressure
As of July 31, the overall market supply pressure value is 1.44, which is a normal value for the repair period. Further analysis shows that the long hand pressure value is 1.44, while the short hand pressure value is 1.03.
During the upward phase, after the profit rate rises, the selling pressure from short hands is the fundamental reason for suppressing the increase. In the decline that began in mid-April, short hands' profits once exceeded 27%, but later incurred losses through the downturn. After being pulled up in mid to late June, the profits of the liquidated short hands recovered to 10%, and now only 3% remain. For long hands, a profit rate of 44% does not create selling motivation, while the near-loss profits of weak hands do not create selling pressure.
Therefore, from a supply perspective, BTC's current $30,000 or $28,000, compared to June, has seen a significant change in holding structure, and market pressure is not large. This indicates that there is no structural risk from an overall profit perspective in the market.
Whale Selling
From the game relationship between long and short groups, we have not seen any change in the trend.
When we observe a specific group—the whale group—we find that they have initiated continuous selling since the rebound in mid-June.
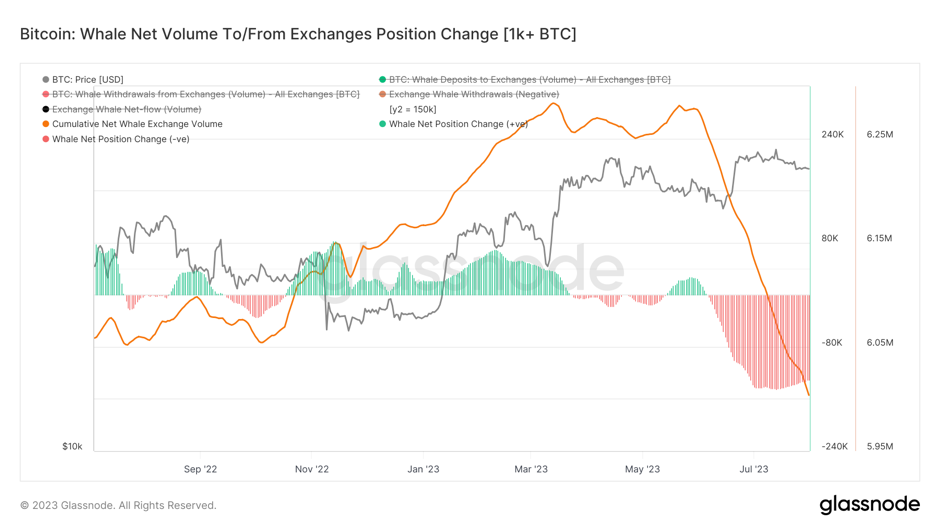
Whale Inflow and Outflow to Exchanges
The number of whales transferring to exchanges during this period accounted for about 41% of the total inflow, according to BTC data platform Glassnode, and this selling proportion exceeds that during the collapses of LUNA and FTX. We tend to believe that in a weak market state, the high-intensity selling by the whale group has driven BTC's price down.
According to Glassnode's analysis, these frequently trading whales belong to the "short hand" whales that entered the market this year.
On-Chain Activity
On-chain activity is the fundamental basis for BTC market prices, and divergences between the two often bring trading opportunities.
In mid to late July, while the market was declining, the number of new addresses on-chain maintained a good growth trend.
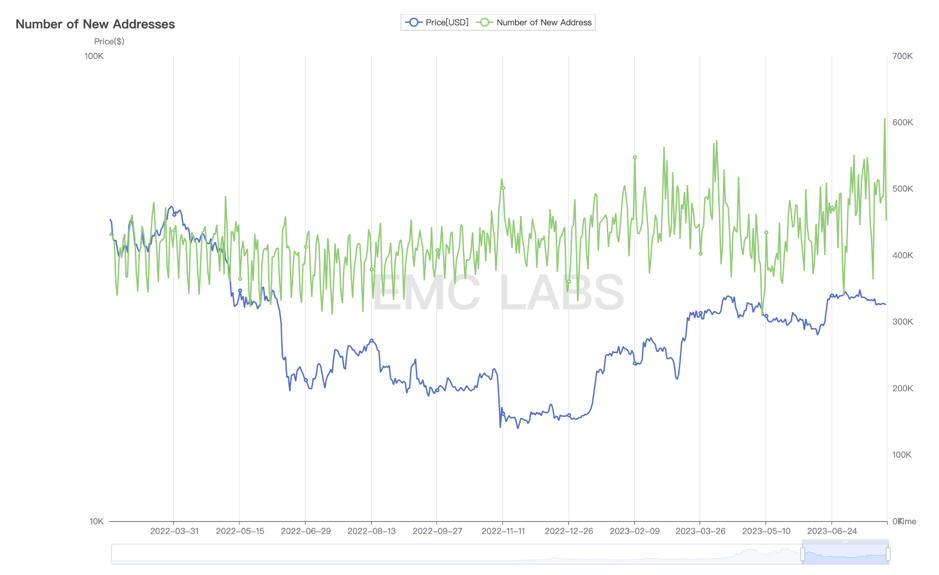
Daily New Address Count for BTC
On July 30, it reached 600,000, setting a new high for the year. Since the collapse of Ordinals MEME Coin in late May, the overall number of new addresses has continued to expand, indicating a gradual accumulation of growth power during the repair period. In several historical bull-bear transitions, we have observed similar situations. When this growth power continues to accumulate to a certain extent, a bull market begins to initiate.
In terms of address activity, overall transactions are also in a growth state.
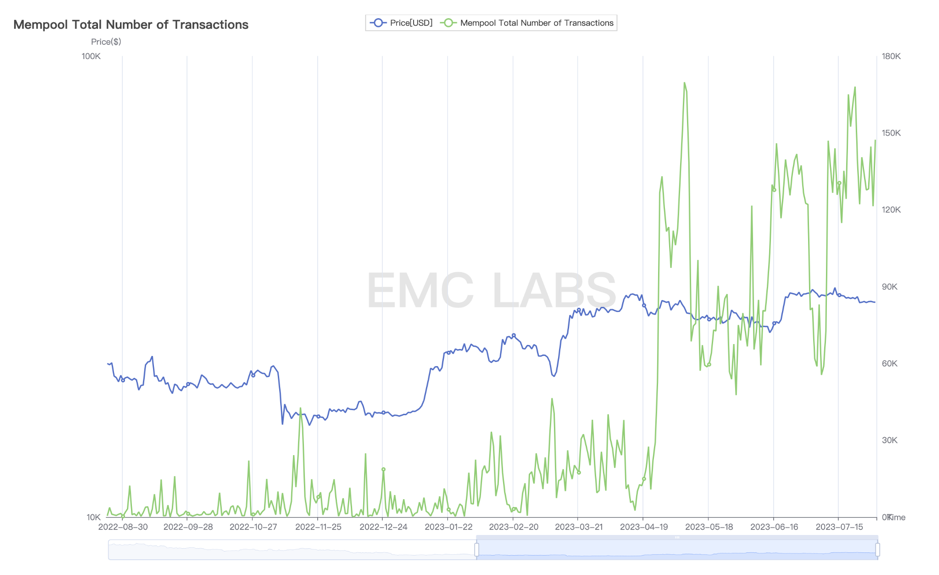
Daily Mempool Transactions Queue Size
Incremental Funds
The outlook for incremental funds remains very pessimistic. The outflow of funds since the major clearing continues, with a net outflow of stablecoins reaching $1.4 billion in July.
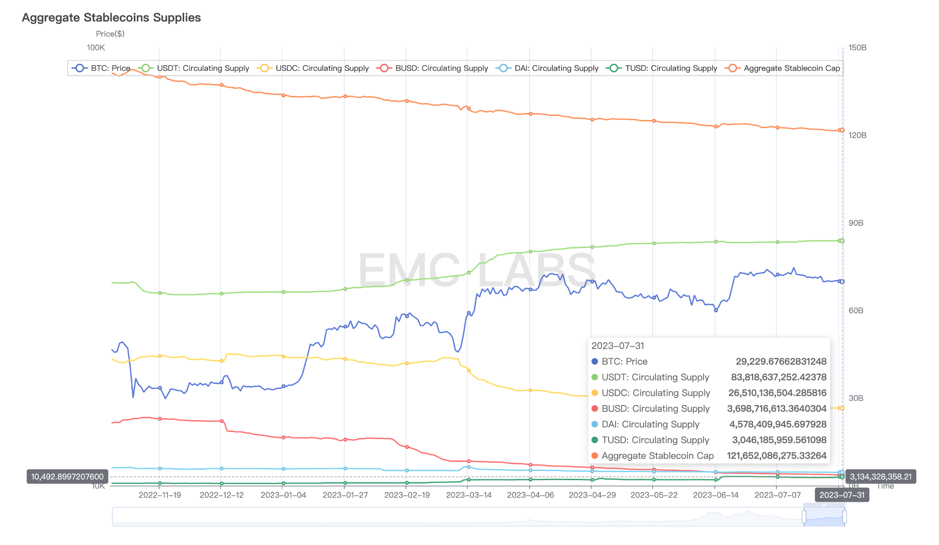
Major Stablecoin Supply
Correspondingly, the purchasing power of stablecoins in CEX inventories is also declining.
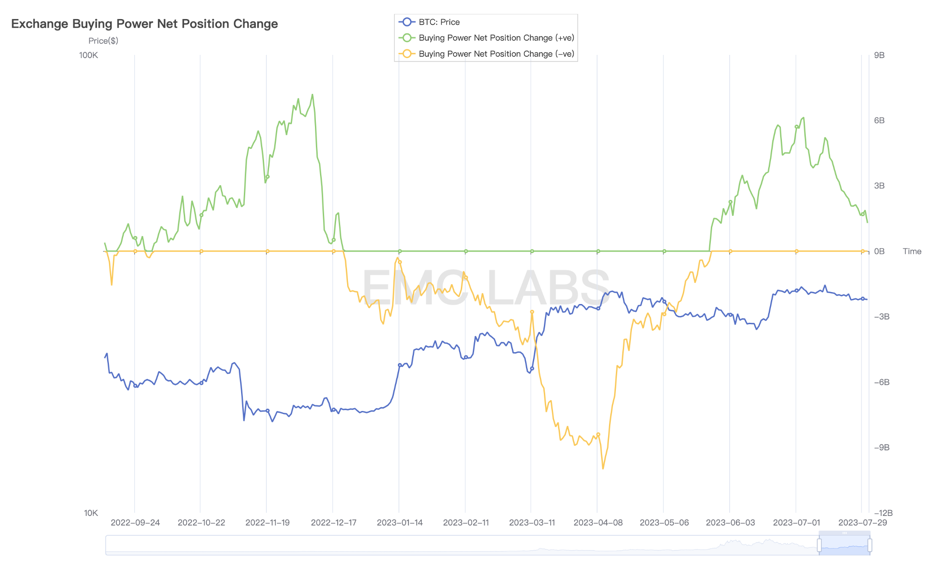
Changes in Purchasing Power of Centralized Exchanges
Conclusion
July was a dull month for the repair period. Based on on-chain data and cycles, it could have been a month for achieving a breakout from the range, but the high-intensity selling by short hands and whales left the market empty-handed.
On the pessimistic side, stablecoins not only failed to stabilize but also experienced an outflow of $1.4 billion.
The optimistic support remains the significant improvement in supply data, the ongoing transition between strong and weak hands, and the continuous growth in on-chain activity, leading us to believe that behind the selling by short hands and whales, the ongoing transition of chips between long and short hands is steadily accumulating the power to push the market to break through. The opportunity is coming, and BTC will break through to the next stage—$38,000.
The biggest risk, however, is whether the macro financial market can withstand the high interest rate environment of the dollar.


