
BTC Volatility: A Weekly Review July 15–22, 2024

2024-07-24 19:00:56
Collection

Key Metrics: (Hong Kong Time July 15, 4 PM -> July 22, 4 PM):
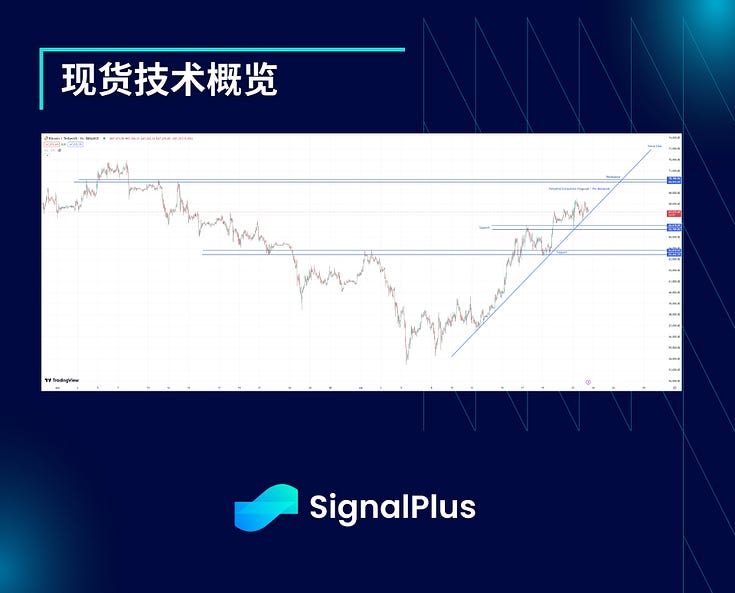
- BTC/USD +7.0% ($62,840 -> $67,240), ETH/USD +3.9% ($3,350 -> $3,480)
- BTC/USD December (year-end) ATM volatility +15% (59.5 -> 68.5), December 25d RR volatility +40% (5.2 -> 7.3)
Major Market Events:
- Trump survives assassination attempt, boosting his election odds (60% -> 70%)
- Trump's continued support for cryptocurrency has fueled bullish sentiment in the market ("America's first cryptocurrency president")
- JD Vance selected as Trump's campaign partner (supports cryptocurrency, opposes tech giants)
- ETH/USD ETF expected to launch on July 23
- The 2024 Bitcoin Summit will be held in Nashville, with Trump as the keynote speaker; market rumors suggest a potential announcement of Bitcoin's strategic reserves, leading to significant premiums in the options market
- Biden withdraws from presidential race, endorsing Kamala Harris --- despite Trump's election odds dropping from 70% to 63% (while Harris rises from 19% to 29%), BTC/USD continues to rise
ATM Implied Volatility:
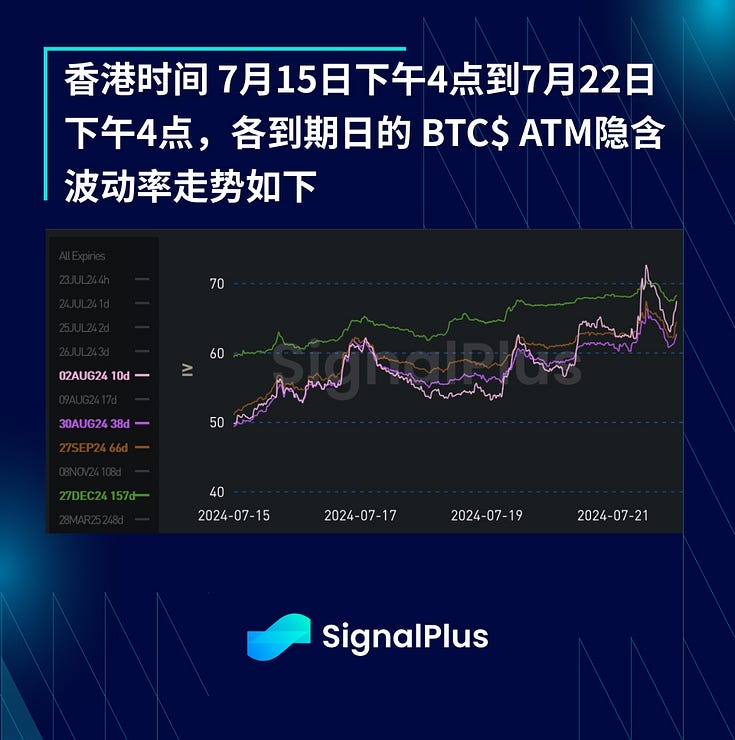
- As bullish sentiment returns, implied volatility rises overall; the 2024 Bitcoin Summit has embedded significant premiums into the front end of the BTC$ curve --- daily volatility spreads reached 7% due to Trump's keynote speech (this is reflected in options expiring on July 27, but can currently be observed in options expiring on August 2, where implied volatility rose from 50 to 67.5)
- In the term structure chart, implied volatility is generally rising, with the ATM implied volatility for September 27 expiring options rising from 51 to 64.5, and year-end ATM implied volatility rising from 59.5 to 68.5
- Due to the sustained price increase, actual volatility remains subdued --- observed high-frequency actual volatility has stayed around 43 during this period, while daily volatility is slightly below 50
- In the lead-up to the conference (July 23-26), there are significant volatility spreads in weekly expiring options, with uncertainty from the ETH ETF issuance priced into options expiring on July 24, showing about a 4% premium
- Looking further, the risk premium is expected to last at least until the conference, although there hasn't been a breakout to the upside in a localized range, we can still see slight pullbacks in implied volatility at local peaks
- Over the past week, supply and demand have heavily favored the demand side, primarily focused on bullish contracts for August to September, with the market expecting a breakthrough to historical highs after the 2024 Bitcoin Summit
Skew/Convexity:
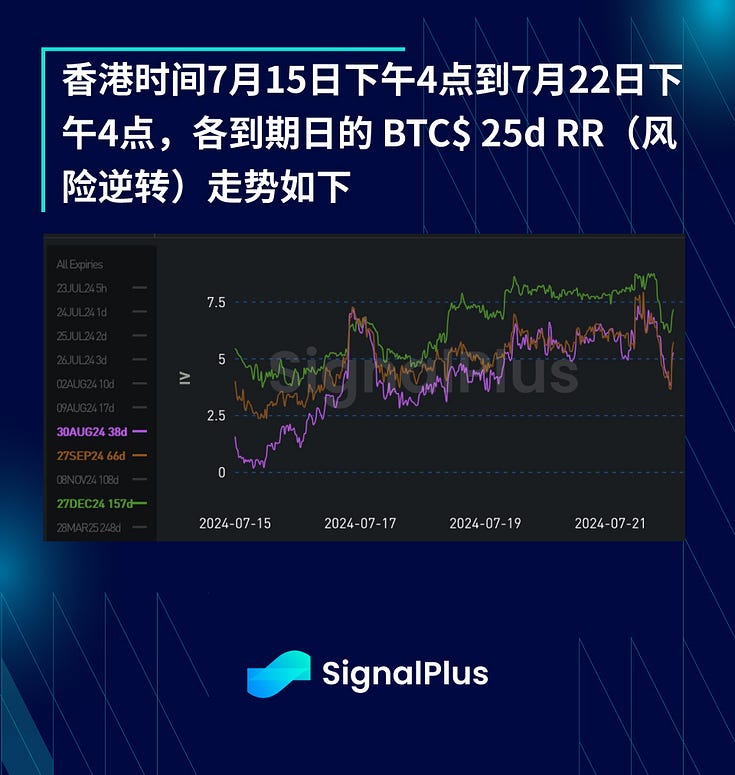
- This week, volatility skew has significantly increased (tilting upwards), reflecting a renewed bullish market sentiment and a repricing of tail risk premiums influenced by the aforementioned narrative. This week, the 25d RR expiring on August 30 rose from 1.5 to 5.0, briefly breaking above a local high of 7.0!
- Spot and implied volatility are highly positively correlated, with implied volatility rising as spot prices increase and retreating from local highs when spot prices pull back. While this partly explains the rise in 25d RR, as mentioned earlier, actual volatility did not significantly increase when spot prices rose, indicating that the market has priced in a substantial additional premium for tail scenarios of significant price increases, especially considering BTC's potential as a strategic reserve.
- Since spot prices have reflected expectations of an announcement regarding strategic reserves at the 2024 Bitcoin Summit, if such an announcement does not ultimately occur, the market may be disappointed. Therefore, as spot prices rise, the short-term risk reversal of the event should weaken (which is indeed what we have observed in the past 24 hours)
- Over the past week, overall demand for options has clearly favored the upside, which has also intensified the implied volatility skew.
- Overall, last week, the market's demand for options strongly leaned bullish, which further exacerbated the implied volatility skew.
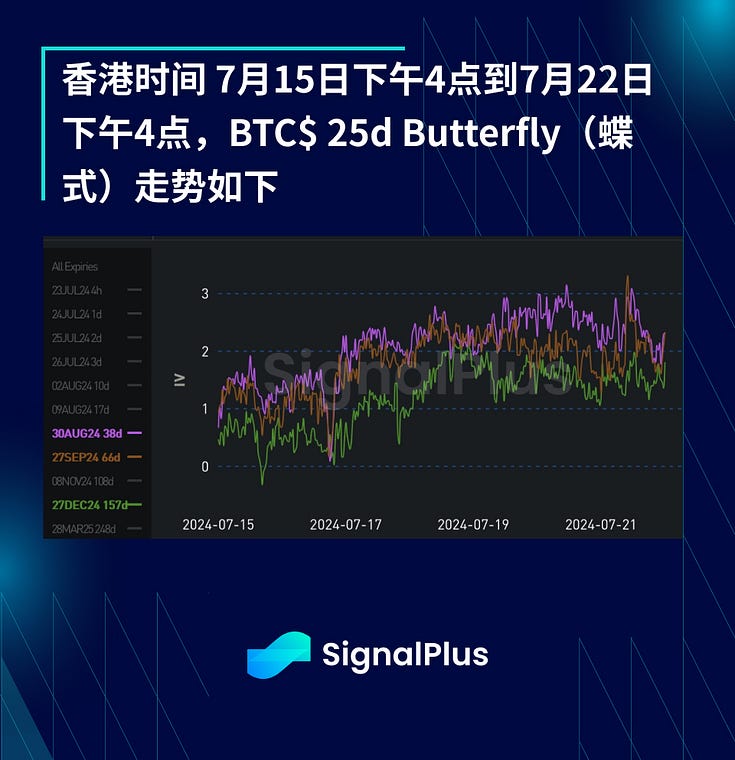
- In the past week, compared to the risk reversal trend, the curve's convexity has been flatter. The 25d butterfly premium has risen with the increase in underlying volatility.
- Despite experiencing extremely high IV volatility over the past two weeks, we have also observed a strong correlation between risk reversal levels and spot prices (i.e., risk reversal leaned towards call options when spot prices rose, while it clearly leaned towards put options when it dropped to 54k three weeks ago)
- Overall, while we can continuously observe structural supply of Overlay and Call Spread strategies for wing premiums, this week we have seen a higher proportion of outright trades (with less wing supply)
Wishing you good luck this week!

Related tags
ChainCatcher reminds readers to view blockchain rationally, enhance risk awareness, and be cautious of various virtual token issuances and speculations. All content on this site is solely market information or related party opinions, and does not constitute any form of investment advice. If you find sensitive information in the content, please click "Report", and we will handle it promptly.


