Blockin.ai: LP Tracking, Liquidity Pool Clustering Analysis

 Establish currency pool classification labels from four dimensions: pool establishment time, currency type, pool capacity, and correlation.
Author: Blockin . ai
I. Definition of Pool Classification
Establish pool classification labels from four dimensions: pool establishment time, token type, pool size, and correlation;
(1) pool _ age
Divided into five categories: [ 12m , 24m ), [ 6m , 12m ), [ 3m , 6m ), [ 1m , 3m ), [0, 1m );
(2) token _ type
Divided into three categories: Non _ Stable _ Coin, Unilateral _ Stable _ Coin, Stable _ Coin;
Ø Currently defined stablecoins include:
stable _ coins = [" 0x6 b175474 e89094 c44 da98 b954 eedeac495271 d0 f ", # DAI
" 0xa0 b86991 c6218 b36 c1 d19 d4 a2 e9 eb0 ce3606 eb48 ", # USDC
" 0xdac17 f958 d2 ee523 a2206206994597 c13 d831 ec7 ", # USDT
" 0x0000000000085 d4780 b73119 b644 ae5 ecd22 b376 ", # TUSD
" 0x956 f47 f50 a910163 d8 bf957 cf5846 d573 e7 f87 ca ", # FEI
" 0x4 dd28568 d05 f09 b02220 b09 c2 cb307 bfd837 cb95 "] # PRINTS
(3) Pool _ size
Divided into four categories: huge (tvl >= 2000wu), middle (100wu \<= tvl < 2000wu), small (10wu \<= tvl < 100wu), supper _ small (tvl < 10wu);
Ø Huge category mainly distinguishes the top 20 pools by locked amount.
(4) Corr _ type
Divided into two categories: strong _ related, weak _ related;
Ø Based on the correlation analysis results, pools with 1m extremely high correlation and 1m relatively high correlation are defined as strong correlation, while the rest are defined as weak correlation.
II. Distribution of Pool Quantity
Ø The current V3 system has filtered 712 pools.
(1) Statistics of Pool Classification Distribution
In the pool _ size classification, the number of small pools is the highest, followed by medium pools;
In the token _ type classification, the number of dual non-stable pools is the highest, while the number of dual stable pools is the lowest;
In the pool _ age classification, there are no pools older than 24 months; older pools have more establishment time, while most new pools are filtered due to insufficient locked amounts;
In the corr _ type classification, only a small number of pools have strong price correlation.
Table 2-1 Statistics of pool _ size and token _ type classification distribution

(2) Joint Distribution Statistics
Huge pools (top 20 by tvl) were mainly created in [ 12m , 24m ), with the remainder in [ 6m , 12m );
Huge pools have the most unilateral stablecoin pools;
Middle, small, and supper _ small pools have the most non-stablecoin pools;
A small number of middle, small, and supper _ small pools were created in [0, 6m ), with [0, 1m ) being the least;
Pools created in [0, 1m ) are mainly small and supper _ small pools.

Figure 2-1 Joint Distribution Statistics
III. Distribution of Pool Yield
(1) Distribution of Pool Yield
- All Pools
The annualized mining yield is mainly concentrated between 0% - 20%, with net annualized yield slightly right-skewed, and the mode of net yield is less than 0.

Figure 3-1 Distribution of Mining Yield and Net Yield of Pools
- By pool _ age classification
Pools with longer establishment times have more concentrated mining yield distributions, while new pools have more dispersed mining yields, suggesting that mining new pools may yield higher returns;
The net yield distributions of pools with different establishment durations are slightly right-skewed, with modes less than 0; at the same time, older pools have more concentrated distributions, indicating that the returns from mining older pools are more stable, while the high mining yields and high impermanent losses of new pools may lead to either higher total returns or greater losses.

Figure 3-2 Distribution of Mining Yield of Pools by pool _ age Classification
 Figure 3-3 Distribution of Net Yield of Pools by pool _ age Classification
- By token _ type classification
Dual stablecoin pools have the lowest annualized mining yield, while dual non-stablecoin and unilateral stablecoin pools have similar mining yield distributions;
In the net yield distribution, dual stablecoin pools have low impermanent losses, and the distribution is similar to that of mining yield; the net yield distribution of dual non-stablecoin pools is more concentrated compared to unilateral stablecoin pools, indicating that dual non-stablecoins share some of the risks of price declines due to the interrelationship between the token pairs.
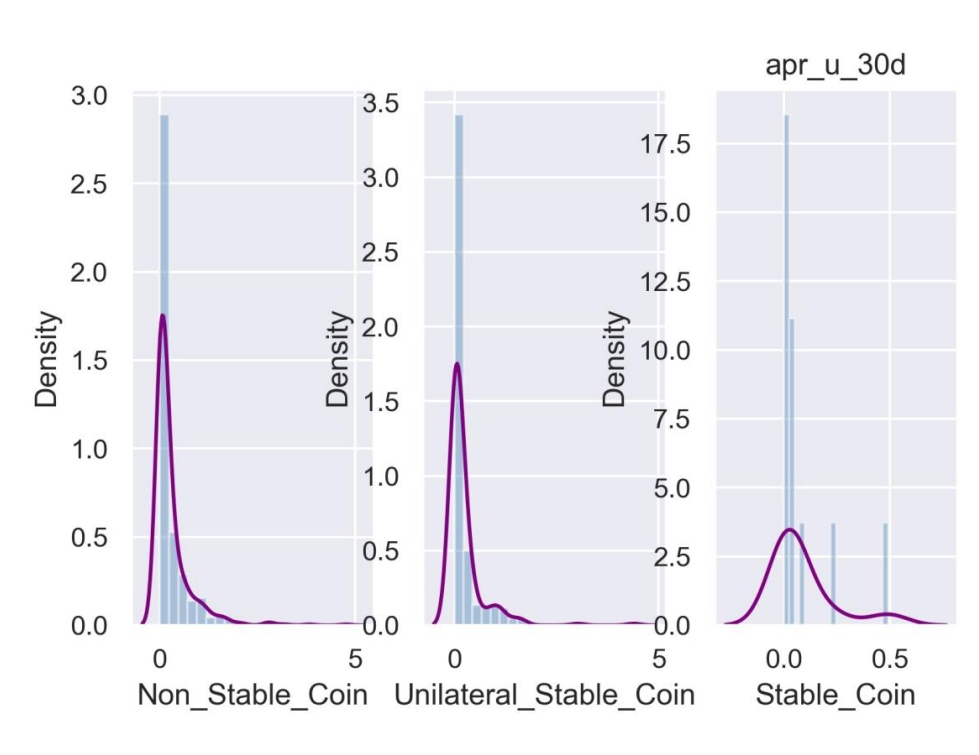

Figure 3 Distribution of Mining Yield and Net Yield of Pools by token _ type Classification
- By pool _ size classification
Similar to the pool _ age classification, the top 20 large pools generally have lower mining yields but more stable net yields; small pools may yield higher returns but also carry greater risks;
The actual pool _ size and pool _ age classifications should have a strong correlation (large pools were created earlier).


Figure 4 Distribution of Mining Yield and Net Yield of Pools by pool _ size Classification
5. By corr _ type classification
There are fewer samples with strong correlation, and the distribution does not show significant differences.


Figure 5 Distribution of Mining Yield and Net Yield of Pools by corr _ type Classification
(3) Variance Analysis of Pool Classification
- A variance analysis of the annualized mining yield and net annualized yield of the four pool classifications found that only the two yield types of pool _ age have p-values less than 0.05, indicating significant differences in means, suggesting that the establishment time of the pool has a substantial impact on yield;

- Through multiple comparisons, it was found that the [0, 1m ) category of pool _ age has significant differences in mining yield and net yield compared to other categories;

Figure 8 Multiple Comparisons of pool _ age Classification
(4) Two-Factor Variance Analysis
pool _ age and pool _ size have an interaction effect on mining yield;
pool _ age and pool _ size, as well as pool _ age and token _ type, have interaction effects on mining yield;

The net yields of pools classified as middle and supper _ small under different pool _ age conditions show significant differences from other categories;
Unilateral stablecoin pools under the pool _ age classifications of [0, 1m ) and [ 12m , 24m ) show significant differences in net yields from other categories;


Figure 10 Results of Two-Factor Variance Analysis of Four Pool Classifications on Net Yield
 Risk warning Risk warning