SignalPlus Macro Analysis Special Edition: How High the Bounce?

 Last week, the asset market experienced another rollercoaster of volatility. However, with various technical indicators (such as the CBOE put-call ratio rising to its highest level since last summer) showing extreme oversold conditions, the market saw a nice rebound on Thursday/Friday. With no new tariff or geopolitical news, the risk of a U.S. government shutdown alleviated, and U.S. stocks being in an extremely oversold state, this provided...


Last week, the asset market experienced another rollercoaster of volatility. However, with various technical indicators (such as the CBOE put-call ratio rising to its highest level since last summer) showing extreme oversold conditions, the market saw a decent rebound on Thursday/Friday. The absence of new tariffs or geopolitical news, the risk of a U.S. government shutdown being alleviated, combined with the extreme oversold state of U.S. stocks, provided momentum for a market rebound of over 2% last Friday, although trading volume remained low.
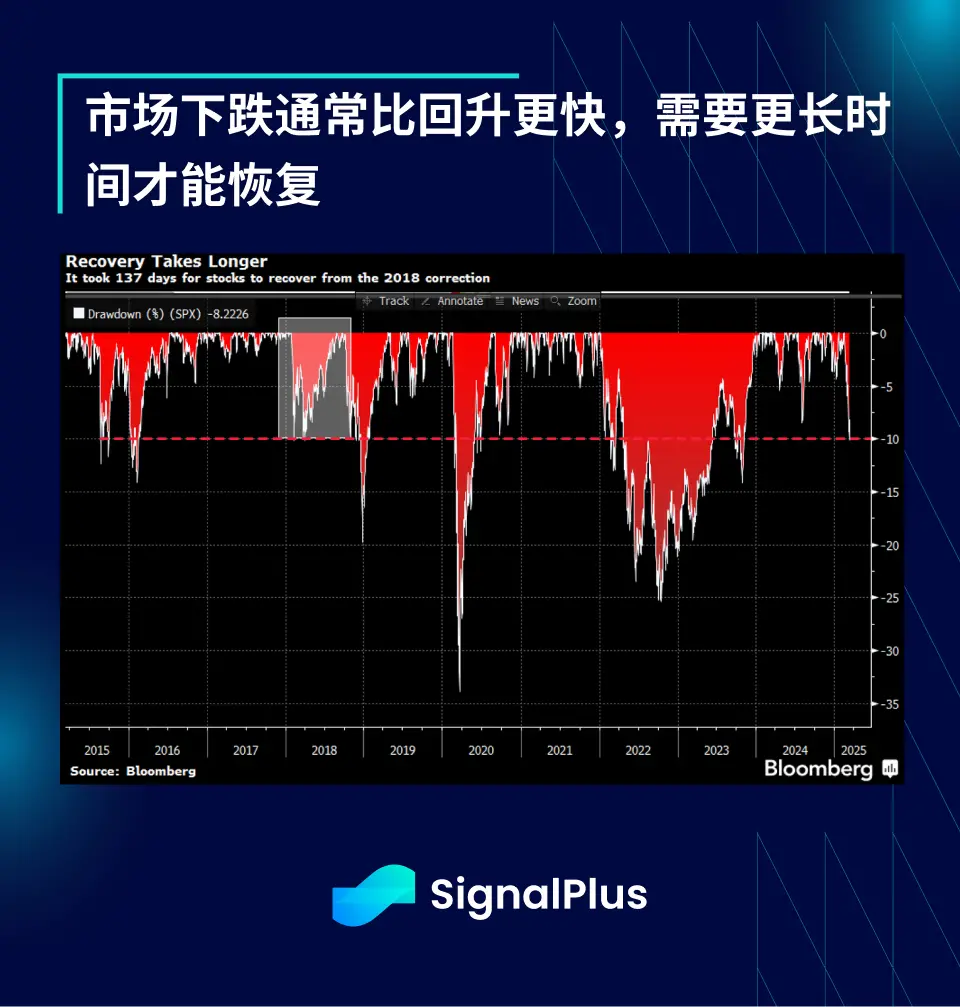
According to Bloomberg, due to the prevalence of automated trading systems and strict risk control mechanisms, the SPX index fell over 10% from its recent peak in just 16 days. With technological advancements, the speed of market corrections is increasing, and the last three major sell-offs (2018, 2020, and 2025) are among the most rapid corrections on record.

In contrast, market recoveries often take longer, as contemporary fund managers are constrained by strict risk controls. The SPX fell 10% in just two weeks in 2018, but it took nearly 4.5 months to fully recover the losses. Bloomberg points out that, among the past 24 instances of market declines exceeding 10%, the average recovery time was about 8 months, reflecting that markets typically "rise slowly and fall quickly."
According to data from JPMorgan, in the past 12 U.S. economic recessions, the average decline of the U.S. stock market from peak to trough was about 30%, while the current adjustment of the SPX is only 9.5%. Simple calculations suggest that the implied probability of an economic recession in the stock market is around 33%, while the implied probability in the commodities and U.S. Treasury markets is close to 50%, and the implied probability in the credit market is only 10%.

Although the market is still struggling to find its footing, Wall Street economists have already reacted, with Goldman Sachs becoming the first major investment bank to significantly lower its U.S. GDP growth forecast for 2025, cutting the growth expectation from 2.4% to 1.7%, and noting that "the main reason for the downgrade is that assumptions about trade policy have become more unfavorable" due to increased tariff impacts. Meanwhile, JPMorgan has raised the probability of a U.S. recession to 40%, pointing out that its reliance on low financing rates, high capital flows, and attractive dollar assets to support the rising fiscal deficit's "exorbitant privilege" is facing risks.

Additionally, due to the Democrats almost completely conceding to Trump in the government shutdown negotiations, this has paved the way for DOGE, allowing it to continue its aggressive cost-cutting measures at least until September.

From the data, retail investors seem not to have preemptively responded to the economic slowdown. U.S. stock ETFs have seen net inflows almost every day since the market peaked in February, and growth ETFs (like Nvidia) have also rebounded to near historical highs.

Meanwhile, although futures long positions have decreased, they remain relatively high compared to historical levels. Additionally, short positions in the SPX and Nasdaq are still at low levels, indicating that the market still lacks short-selling power.

The market believes that this sell-off mainly comes from "multi-strategy" hedge funds that dominate the macro trading market. The Wall Street Journal reported that top hedge funds (Millennium, Point 72, Citadel, etc.) have rarely experienced multiple standard deviation drawdowns and stop-losses in their performance in February and March, which is extremely rare in their long trading history.
On Tuesday, the market continued to be turbulent. Goldman Sachs sent a report to clients stating that stock-picking hedge funds just experienced their worst 14-day performance since May 2022.
The Millennium fund fell 1.3% in February and has already dropped 1.4% in the first six days of March, with its two teams focused on index rebalancing losing about $900 million this year. -- WSJ

Data from JPMorgan further supports this view, showing that the stock risk exposure of equity quant hedge funds has significantly decreased. In growth and momentum trading, popular long-short pairing strategies have been severely impacted, while funds tracking the most favored stocks by hedge funds have underperformed the SPX by about 10% over the past month.

Unfortunately, the market's pain is not limited to the public markets; investment banking has also been severely affected, with M&A activity slowing to its worst level in over 20 years due to tariff uncertainties.
According to Dealogic data, M&A activity in the U.S. in the first two months of this year has reached its lowest level in over 20 years, with only 1,172 transactions completed as of last Friday, totaling $226.8 billion. Compared to the same period last year, both the volume and size of transactions have decreased by about one-third, marking the least active start to the year since 2003. -- Reuters

On the other hand, aside from gold, (short-term) fixed income is another major beneficiary of this wave of economic growth panic. The futures market has repriced again, predicting more than two rate cuts by the end of the year, while overnight rates are expected to drop to around 3.5% by the end of next year.

Undoubtedly, the ongoing quantitative tightening by global central banks, combined with market concerns over the U.S. fiscal deficit leading to a significant number of short positions in the Treasury market, has further driven the recent rebound in the bond market.

Compared to historical averages, valuations of stocks outside major large caps remain relatively controlled, and the performance of hard economic data may outperform the rapidly deteriorating soft data. Therefore, the market generally believes that while we deal with tariff uncertainties, this remains a "buy the dip" market.

In the cryptocurrency space, market sentiment remains low. After a disappointing U.S. government strategic reserve plan, BTC prices hover around $80K. However, as market risk sentiment warmed up last Friday, altcoins performed better, with Solana (SOL), Chainlink (LINK), and XRP seeing around a 10% increase over the past week.
BTC ETFs saw record outflows last week, and the market seems to have entered a consolidation phase in the short term, with traders beginning to hedge downside risks through put options.

Due to the impact on market sentiment, publicly listed Bitcoin mining companies have begun to turn to the debt market to meet their capital expenditure financing needs. As long as financing channels remain open, mining companies should be able to maintain operations without large-scale BTC sell-offs, thus controlling market selling pressure. However, this area still warrants close attention. Currently, MSTR's net asset value premium remains around 1.8 times, while the weighted average BTC holding cost is about $67K, leaving a price buffer of 15-20% compared to the current market price.

Despite the rebound in risk markets, ETH remains weak, with a weekly decline expanding by another 5%, underperforming BTC by about 10% during the same period. The BTC/ETH ratio has dropped to 0.023, a level not seen since 2021 when the BTC spot price was only about $35K.

Factors such as cold market sentiment, pressure from profit and loss stop-losses, lack of new narrative drivers, and unresolved Layer 2 value distribution issues continue to weigh on ETH's performance. According to CoinGecko data, the total market capitalization of stablecoins ($236 billion) has surpassed that of ETH ($226 billion), as has the total market capitalization of all ERC-20 tokens ($255 billion). Moreover, this is also the first time in ETH's history that it has experienced negative returns in the first three months of the new year, with prices down nearly 48% year-to-date, and less than 50% of active wallet addresses are in profit, with losses widespread.
Unfortunately, based on the current structural issues within the Ethereum ecosystem, it is difficult to expect a rapid price recovery, and there are currently no signs that the Ethereum Foundation will make any significant strategic adjustments.
As the saying goes in the market: "Keep hitting until morale improves" - a reminder to everyone to stay vigilant!