BTC Volatility Weekly Review (January 6 - January 13)

SignalPlus
2025-01-14 09:45:27
Collection

Key Indicators (January 6, 4 PM -> January 13, 4 PM Hong Kong Time)

  • BTC against USD fell by 5.8% ($99.3K -> $93.5K), ETH against USD fell by 12% ($3.65K -> $3.215K)

Overview of BTC against USD Spot Technical Indicators:

  • Last week, after a period of price increase, the coin price experienced a pullback as expected. However, this decline had considerable momentum and exceeded our initial expectation of $94K-$96K, even dipping to the $91K level. Overall, aside from a few occasional tentative breakthroughs, the coin price managed to hold around the $92K level and formed a new support level. Subsequently, the coin price rebounded back to the range of $92K-$98K. As the new year began, the market tested the highs, and we saw the coin price forming a head and shoulders pattern. This further indicates the potential weakness of the coin price after breaking the support level, which may lead to a decline all the way to $88K.

  • As previously mentioned, there are multiple support levels below the current price point, so we believe that any downward movement at this stage is more likely to be a slow decline or a bumpy drop, rather than a gap down. However, if the price falls below $88K, we expect a substantial price correction before the next upward movement. Although the latter is not our base expectation. Currently, we believe the next major market movement will primarily be upward rather than downward, but we will reassess the price trend in the coming days—we expect that the current trend still has decent upward momentum, although the performance in the past few trading days has clearly not reflected this.

Market Themes:

  • This week, strong U.S. data has caused turmoil in the U.S. bond market, dispelling the illusion that the Federal Reserve's hawkish stance last December was overly exaggerated, while increasing the risk that there will be fewer than two rate cuts this year (the market currently prices in one comprehensive rate cut). This is because the U.S. labor market remains under pressure, while average hourly wages and prices continue to exert upward pressure on inflation. The S&P 500 hesitated in the face of high interest rates (the U.S. 30-year Treasury briefly touched 5%), leading to a 2% drop by Friday's close.

  • The situation in global stock markets is also not optimistic. The CSI 300 index fell by 5% in the first full trading week, while economic pressures in the UK continue to mount amid questioning of the government (as revealed by Elon Musk), and weak data has exacerbated the weakness in UK bonds and stocks.

  • This week, the cryptocurrency market has shown high beta value against macro headwinds, retreating from a brief surge to $102K. However, overall, the downward trend is buffered by high U.S. interest rates and stock market corrections, and in the medium term, there will not be a significant bear market in cryptocurrencies.

Implied Volatility

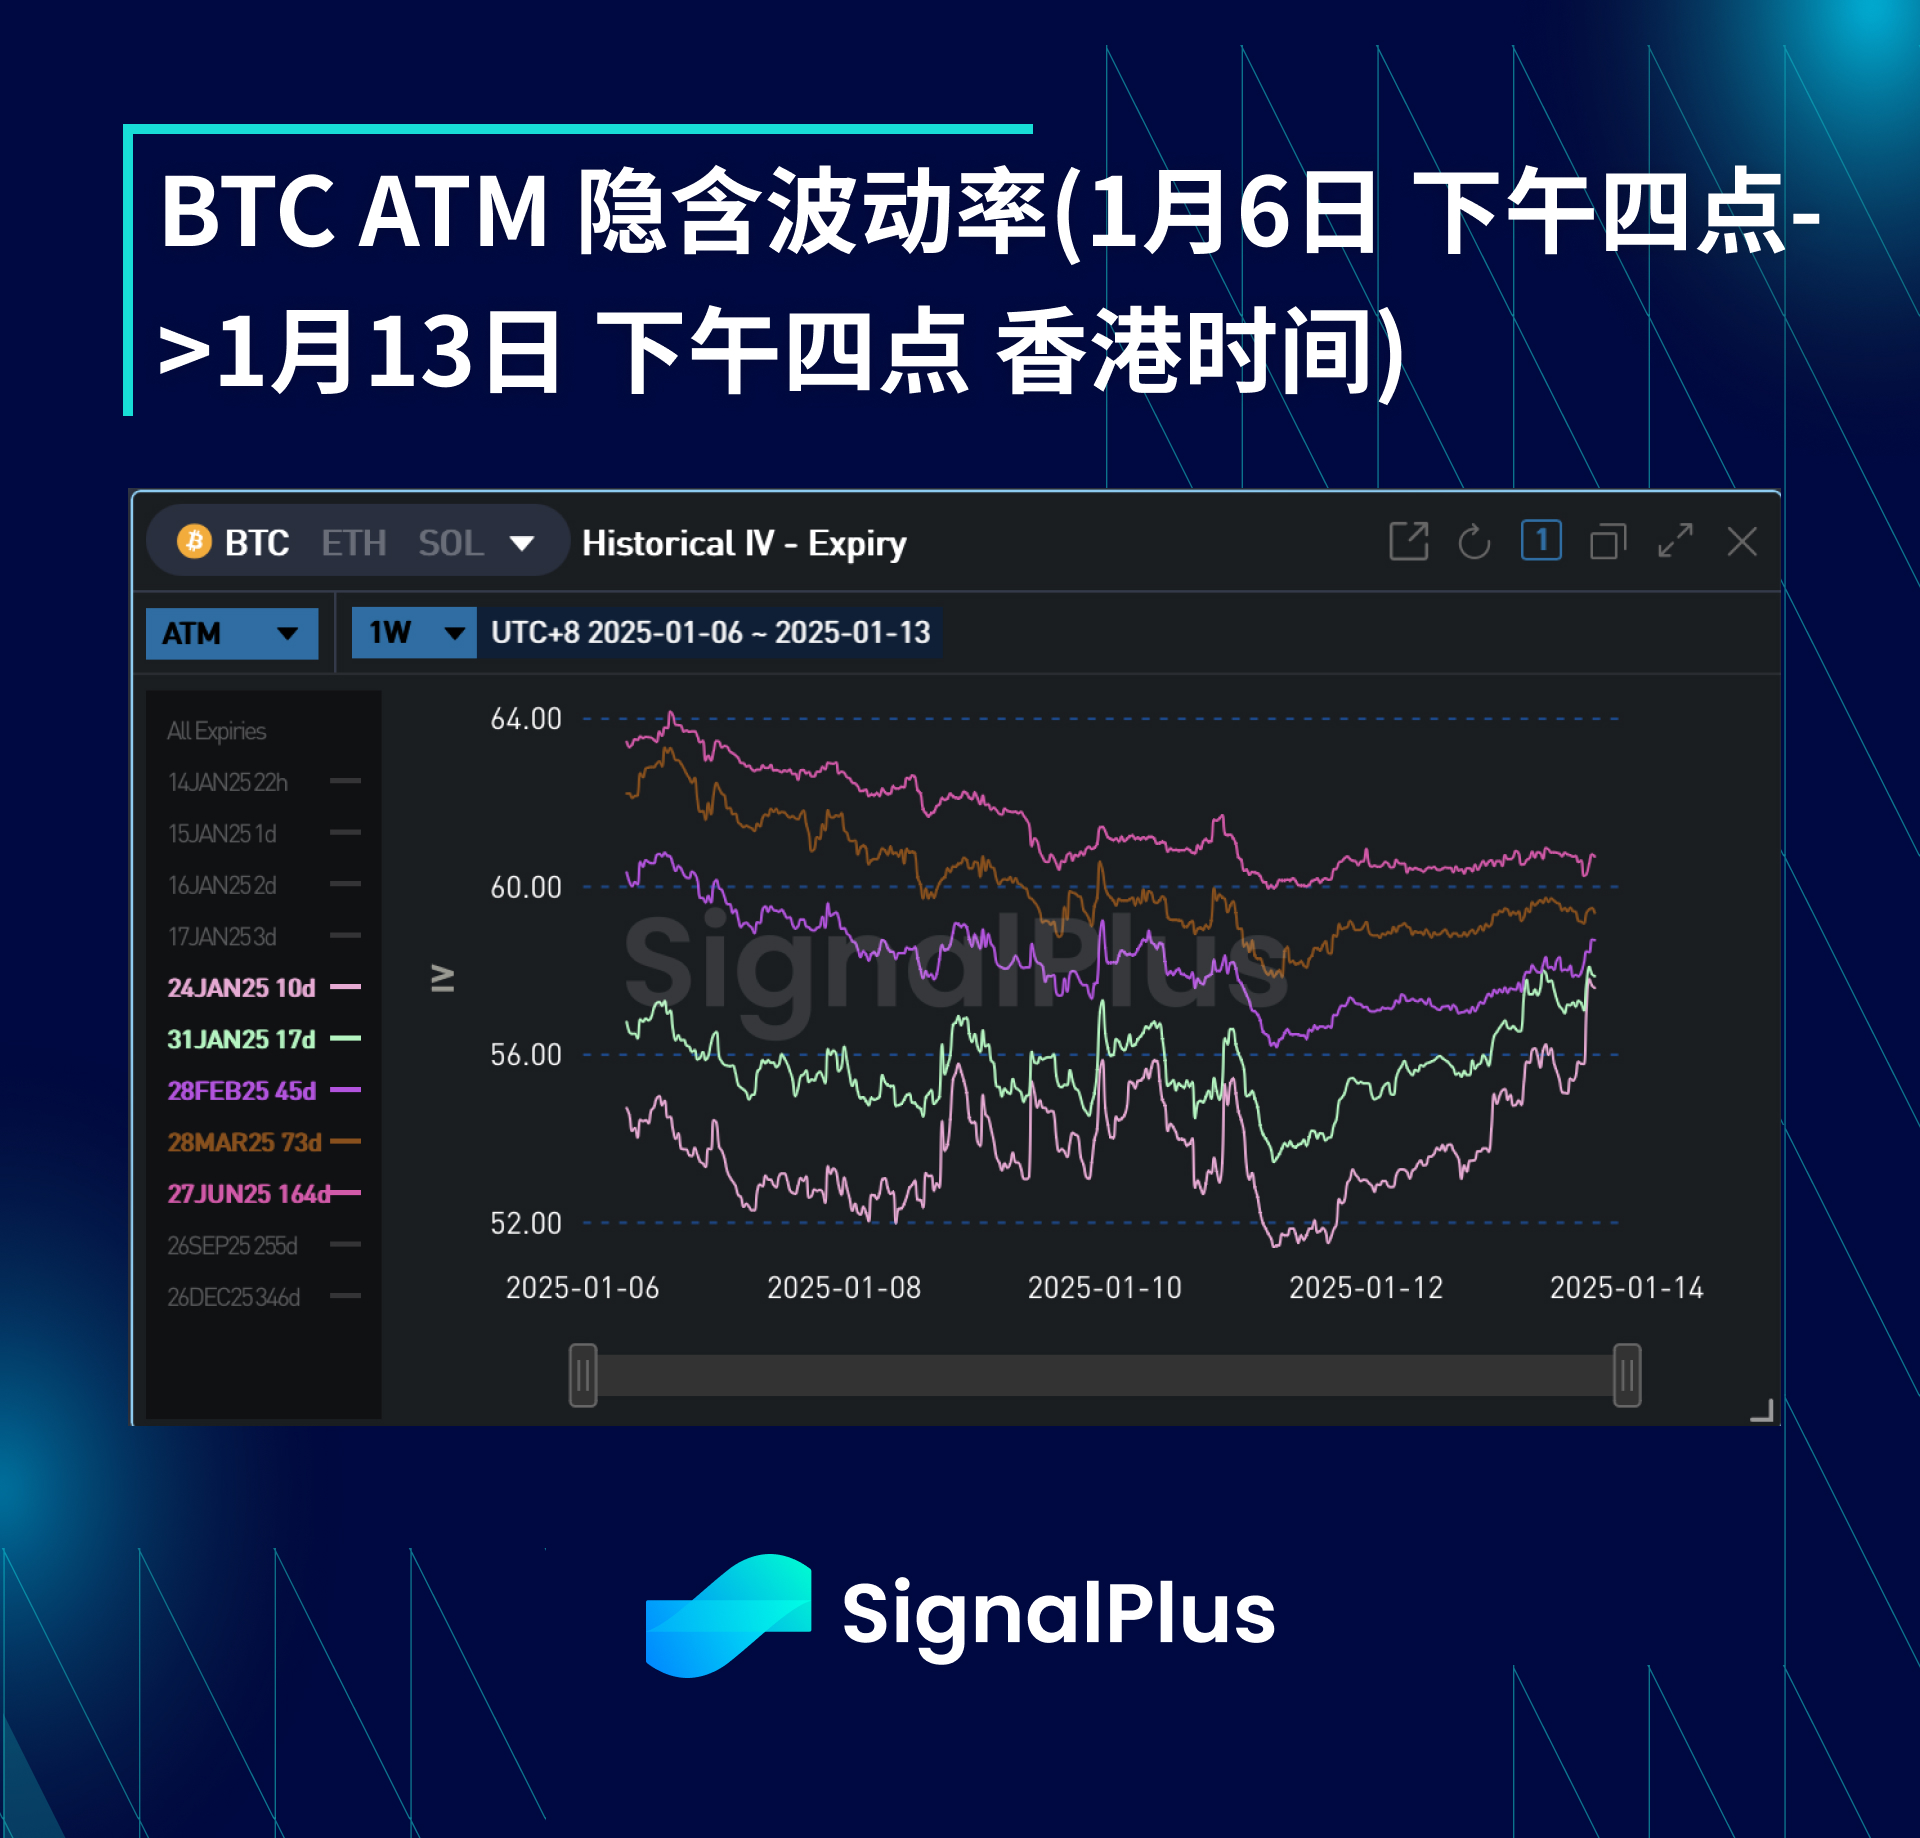
  • The localized sustained volatility of the coin price indeed led to an increase in actual volatility last week. Even considering the degree of fluctuation, the actual volatility is only slightly above 50, still underperforming last week's average implied volatility. However, overall, given that the coin price is still seeking a clear direction, the implied volatility expiring in January has gained good support at the current level.

  • At the far end of the term structure, we see that the high implied volatility at the beginning of the year has been suppressed due to the large flows in December, as expected. The lack of directional trends has also led to a decrease in structural demand for volatility or directional trading, which has weakened support for options expiring from February to June.

BTC Skew/Kurtosis

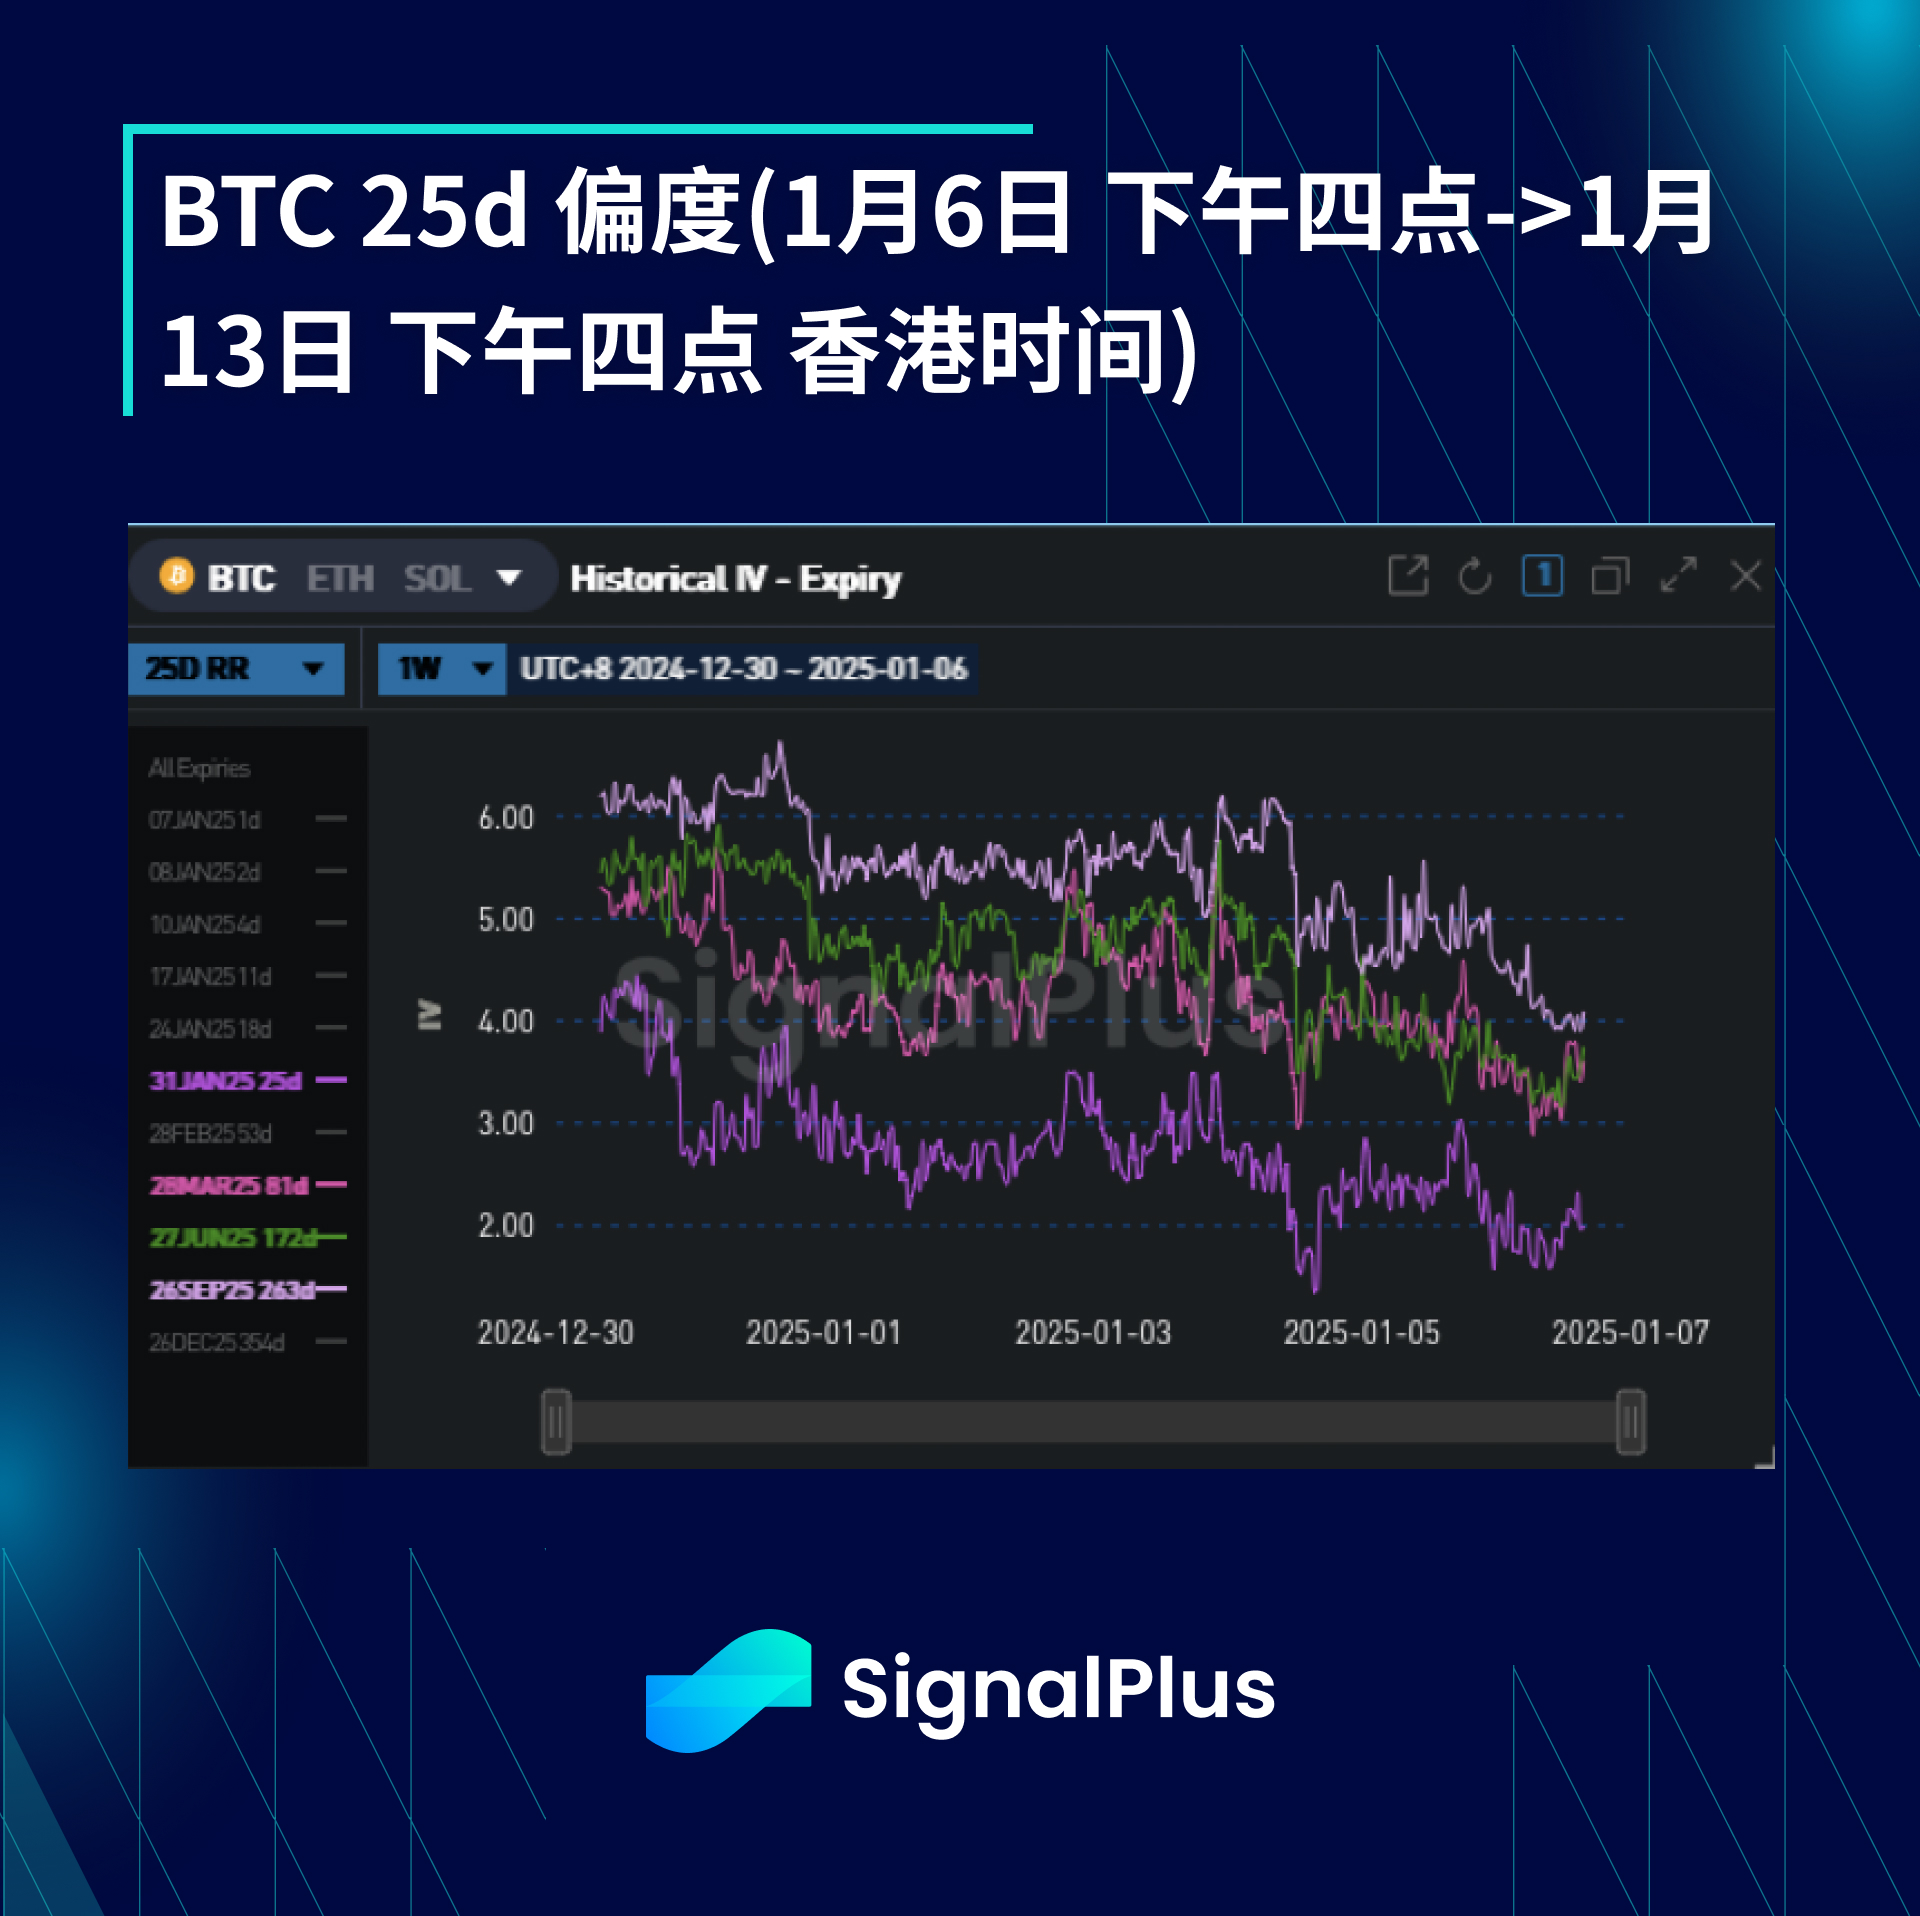
  • With the overall return of liquidity and the rise in actual volatility during the coin price decline, the skew has continued to decrease this week. In particular, all expiration dates in January are skewed towards bearish options. However, the price of skew in the forward market still supports upward movement, as once the macro risks in January and the impact of position adjustments diminish, the market continues to seek structural bullishness after Trump's inauguration.

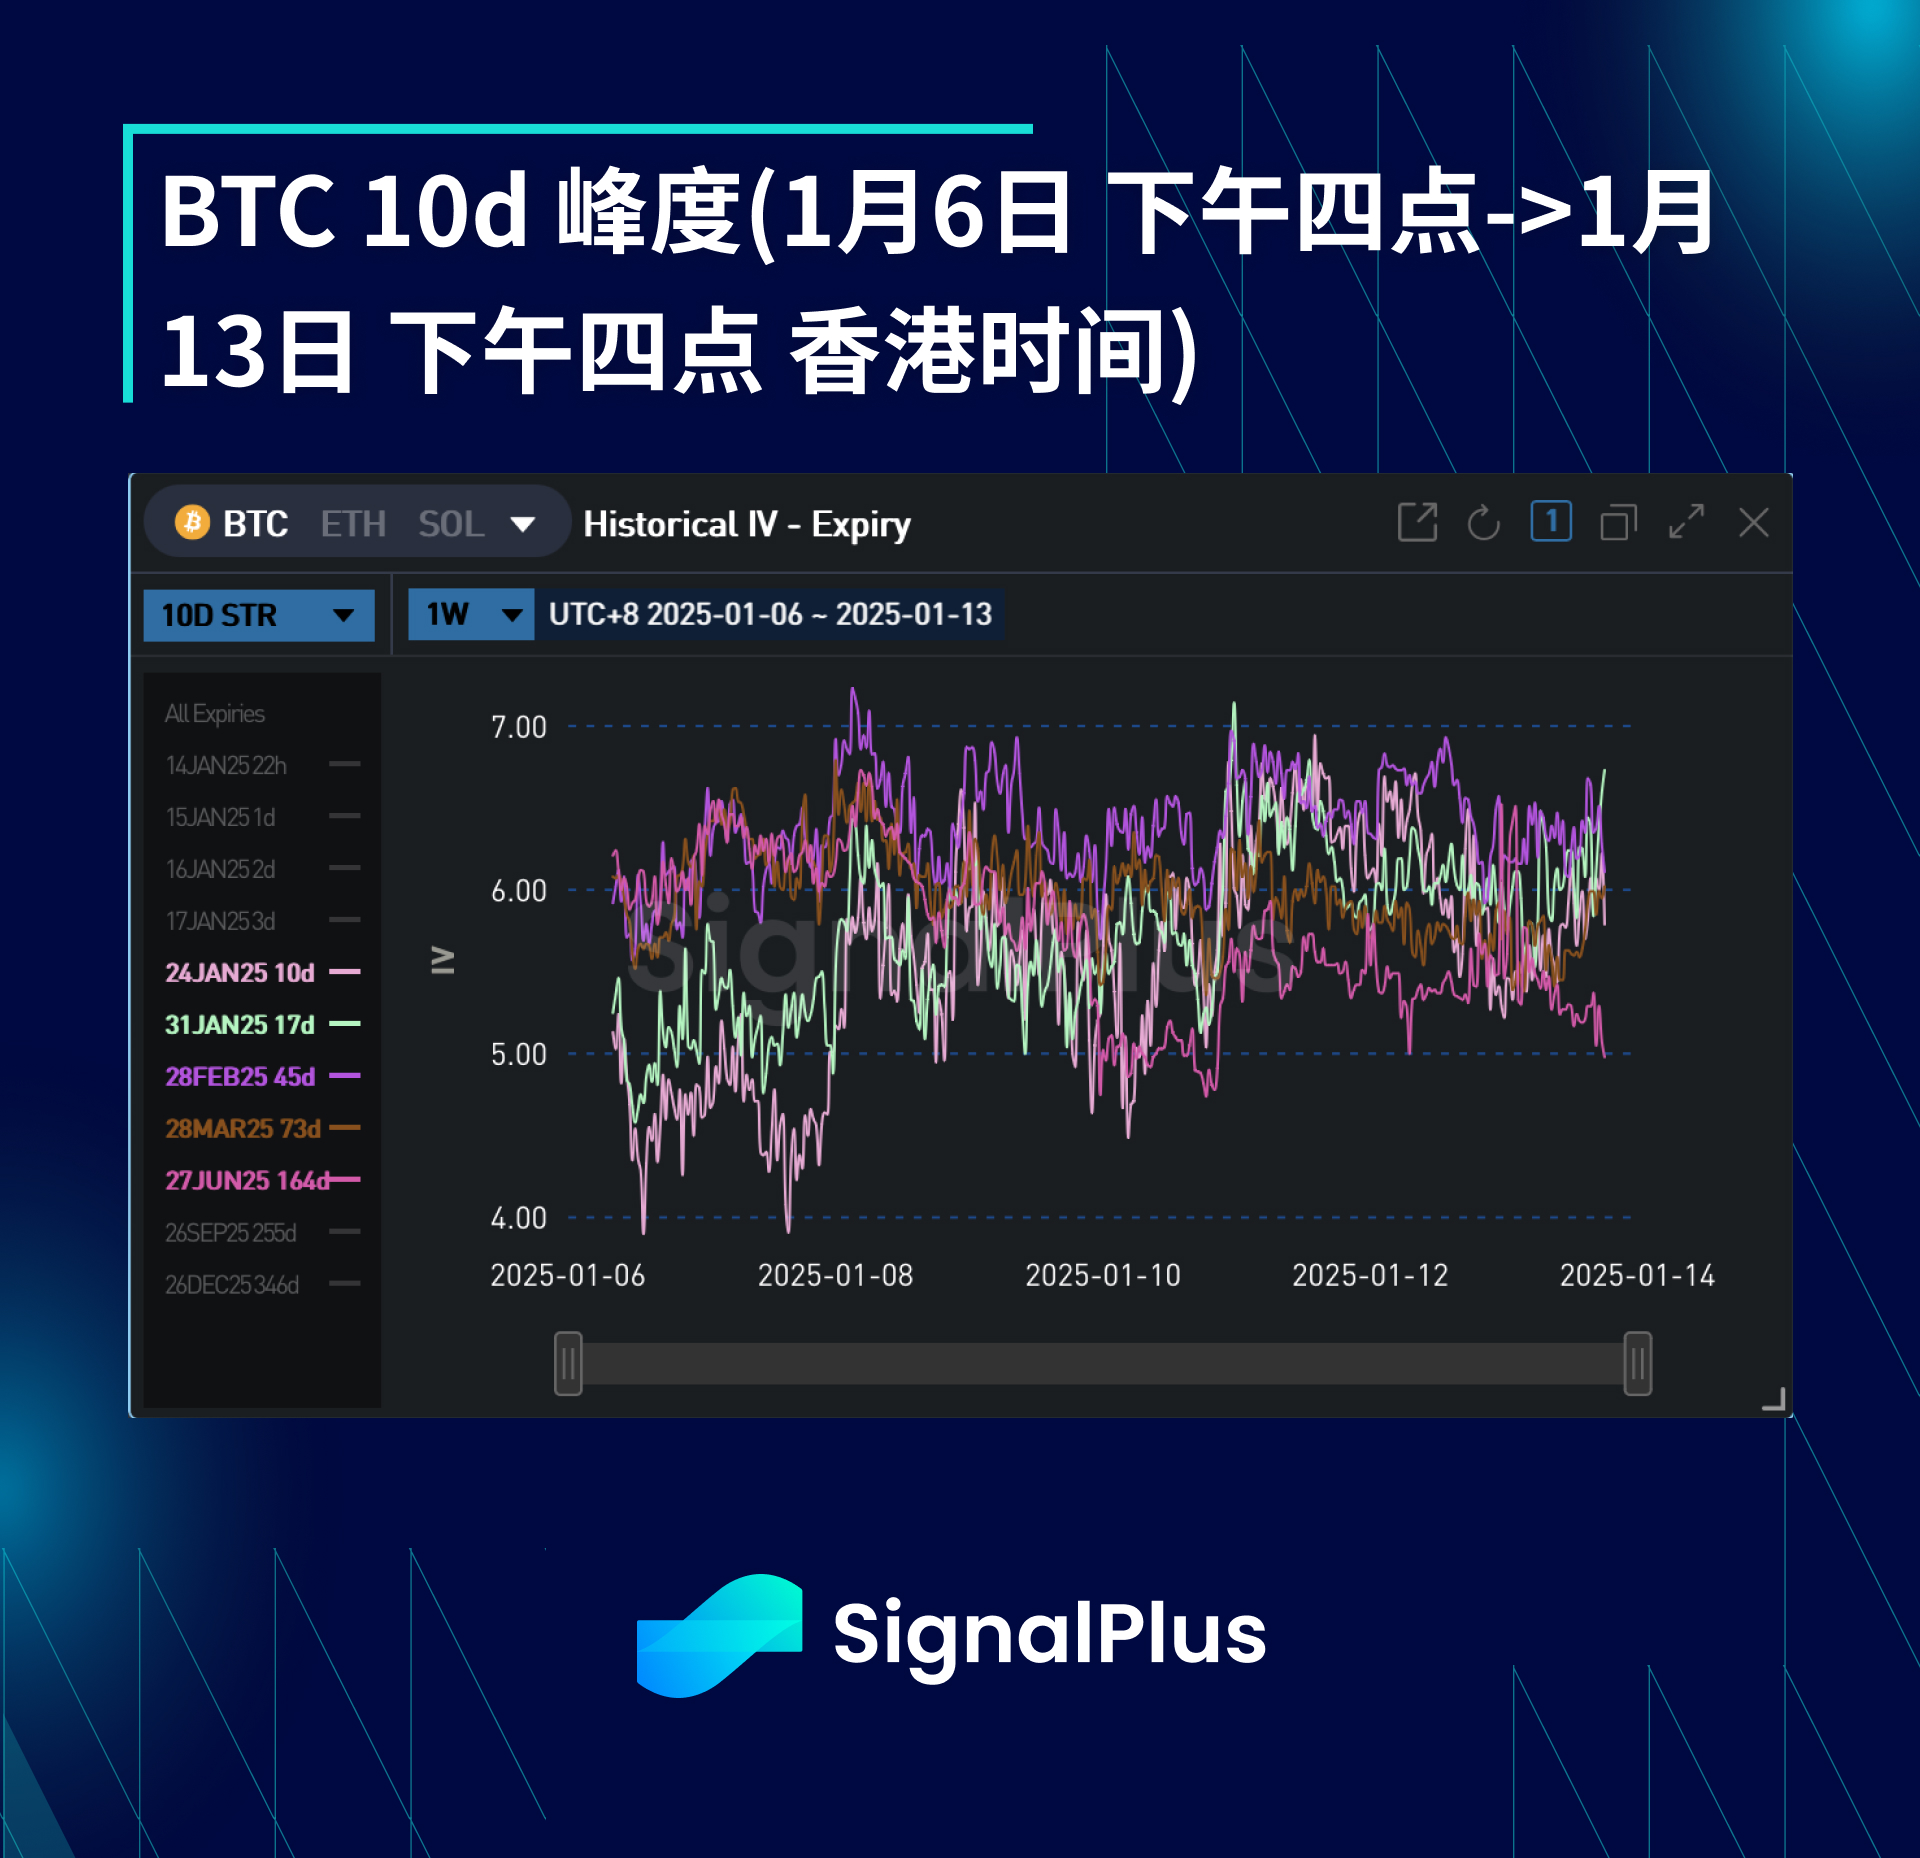
  • The kurtosis this week is somewhat complex. Demand for the wings outside the $92K-$97K range has driven the recent upward movement of the curve. Meanwhile, demand for wing Vega positions in the far market has weakened (in reality, directional trading is mainly completed through bullish option spreads in the upward direction, creating selling pressure on the market's skew).

Wishing everyone good luck in trading this week!

ChainCatcher reminds readers to view blockchain rationally, enhance risk awareness, and be cautious of various virtual token issuances and speculations. All content on this site is solely market information or related party opinions, and does not constitute any form of investment advice. If you find sensitive information in the content, please click "Report", and we will handle it promptly.
banner
ChainCatcher Building the Web3 world with innovators