
BTC Volatility: A Weekly Review from October 14, 2024 to October 21, 2024

2024-10-22 17:18:51
Collection

Key Metrics: (Hong Kong Time October 14, 4 PM -> Hong Kong Time October 21, 4 PM):
- BTC/USD + 6.6% ($64,250 -> $68,500), ETH/USD + 7.9% ($2,525 -> $2,725)
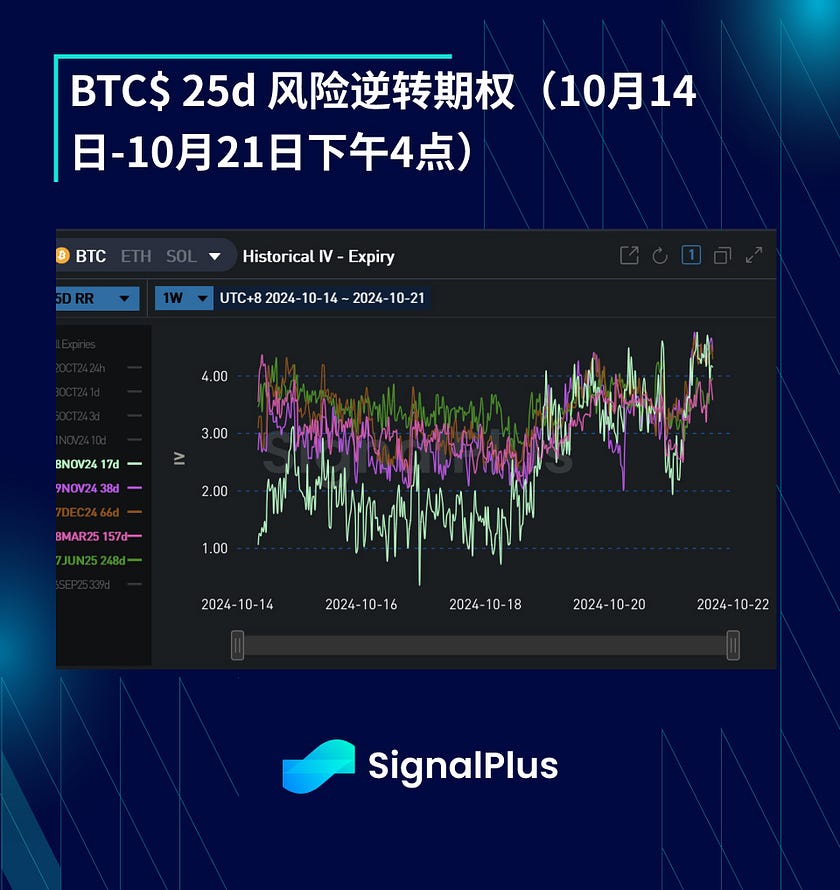
- BTC/USD December (end of year) ATM volatility -1.6 v (57.5 -> 55.9), December 25 d risk reversal volatility +1.4 v (2.9 -> 4.3)
Spot Technical Indicators Overview
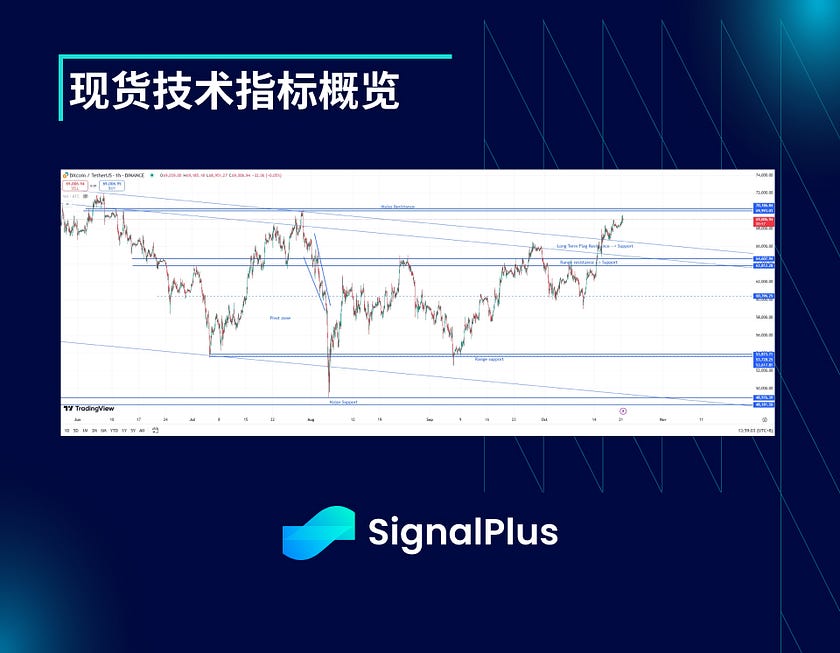
- The spot market finally broke through the long-term flag pattern resistance last week, entering a new price range of $67-$69.5k. With the changing election situation, the market began to position itself for trades related to Trump.
- Currently, the $70k level constitutes very strong resistance. The price uptrend is relatively mild (actual volatility is low), and we expect this situation to continue in the short term. If the price breaks above $70.25k (then $72k), the spot market may see a significant upward trend. Conversely, if it falls below $63.75k, it may trigger a sell-off in the spot market, with prices retreating to $60k and accompanied by larger volatility.
Major Market Events:
- The long-awaited "Uptober" rally has finally begun, with the rising probability of Trump’s election, coupled with strong overall performance in the third-quarter U.S. earnings reports (and retail sales data), and no further escalation in Middle Eastern tensions, leading to a warming of market risk sentiment.
- From a technical perspective, since the market broke through the resistance of the $66.5k - $67k price range, the price trend remains bullish in the short term this week. Meanwhile, ETF inflows have increased, and the performance across asset classes has also boosted this rally, with the gold-to-fiat exchange rate rising to a yearly high and the SPX index hitting a new yearly high.
- Although Trump’s odds have risen significantly (winning probability over 60%), this change has mainly been driven by a few large individual bets. Polling odds remain stable around 50/50, which means we should be cautious about the market's early positioning for a Trump victory (rising dollar exchange rate, increasing cryptocurrency prices, and higher U.S. Treasury yields). It is expected that this election will be decided at the last moment, and we may see a pullback in recent Trump-related trades in the coming week.
ATM Implied Volatility:
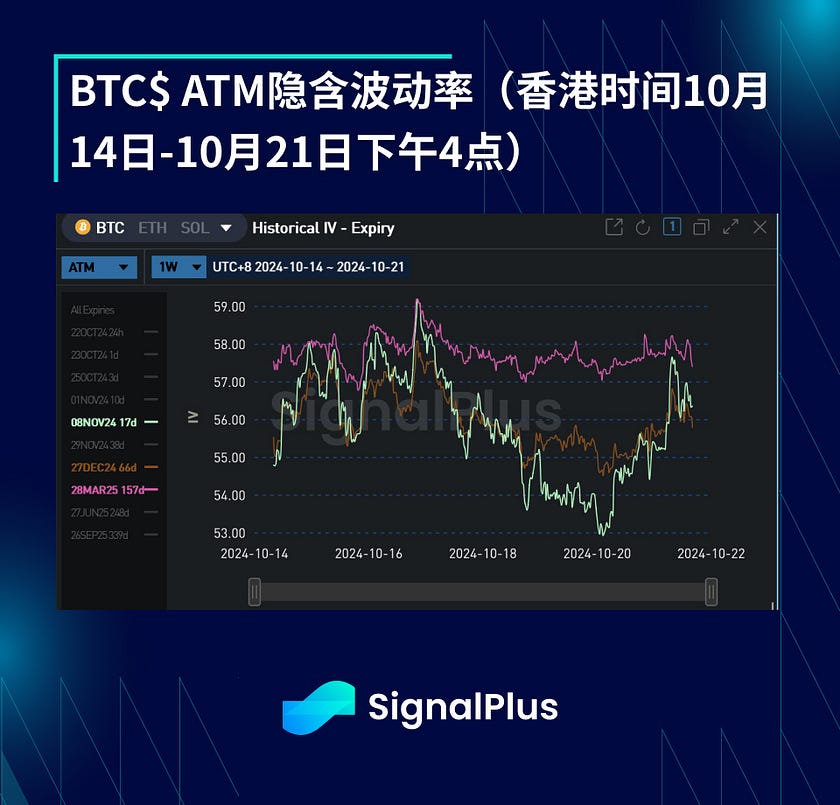
- This week, as spot prices rose and broke through the range resistance, actual volatility increased. However, at other times this week, actual volatility remained relatively subdued, with fixed-term actual volatility around 45 (while 1-week high-frequency volatility approached 54). Large-scale ETF inflows have supported prices during pullbacks, suppressing the decline in actual volatility. Meanwhile, the market seems to be engaging in long gamma trading in high price areas, limiting the rise in spot prices due to gamma hedging.
- After successfully breaking through $67k, implied volatility failed to maintain its upward momentum, as the spot market lacked follow-through and the price trend remained relatively stable, not stirring much excitement in options trading. Additionally, in the short term, the market is mainly enhancing its expectations for volatility through ratio call spreads and overlay selling strategies, so despite new demand, implied volatility has not risen significantly.
- Last week, the spot market's early positioning for Trump reduced the demand for "tail hedging" against events, leading to a decline in the pricing of election volatility. However, considering that polling remains close to 50/50, we believe the market reacted too early based solely on odds. With the intraday breakeven point below 5% and the probability of a Republican sweep rising, we believe holding options positions with election expiration is worthwhile. Meanwhile, in the short term, asset price pullbacks related to Harris may occur very quickly.
Skew/Convexity:
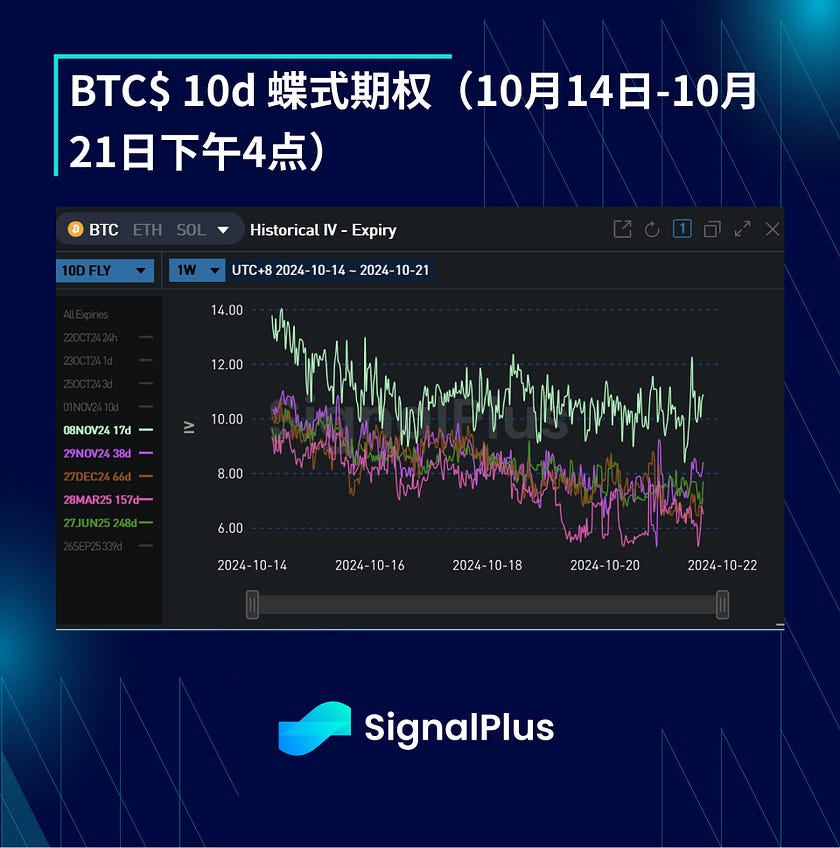
- As spot prices break through the upper limit of the range, there is an opportunity to set a historical high, leading to a sharp rise in volatility skew prices this weekend. However, this is completely contrary to the current correlation between spot and volatility; so far, we have observed that when spot prices rise, implied volatility is relatively low. Furthermore, the changes in volatility skew are not limited to the post-election expiration, as pre-election volatility skew has also risen, indicating that this change cannot be solely attributed to the "Trump premium." We expect that if the odds fall back to the 50/50 level of polling, volatility skew prices will quickly retreat.
- Although we observed a positive correlation between spot and implied risk reversal this week, convexity trading remains stagnant. We attribute this phenomenon to the large number of options contracts still present in the wings at $100k to $120k, as well as insufficient demand from far-end users for tail hedging.
Wishing you successful trading this week!

Related tags
ChainCatcher reminds readers to view blockchain rationally, enhance risk awareness, and be cautious of various virtual token issuances and speculations. All content on this site is solely market information or related party opinions, and does not constitute any form of investment advice. If you find sensitive information in the content, please click "Report", and we will handle it promptly.


Related reading


