
The Great Immortal said: On June 17, the global wave of interest rate cuts began, and the time to buy Bitcoin at the bottom has arrived

 Countries around the world have begun to cut interest rates, indicating that the trend of monetary easing is still unfolding.
Countries around the world have begun to cut interest rates, indicating that the trend of monetary easing is still unfolding. It is quite evident that the Bank of England and the U.S. Federal Reserve will follow suit in the coming months. This global liquidity cycle suggests that the money supply is expected to increase, which will support the rise in safe-haven asset prices, with cryptocurrencies being the first to benefit.
The Bank of Canada announced a 0.25% rate cut on the 5th of this month, becoming the first central bank among G7 industrial nations to lower interest rates. Following this, European central banks also announced a 0.25% rate cut on the 6th, marking the first rate cut by the European Central Bank in nearly five years. The wave of global central bank rate cuts has already begun, making it a good time to buy Bitcoin at the bottom.
Bitcoin 4-Hour Chart
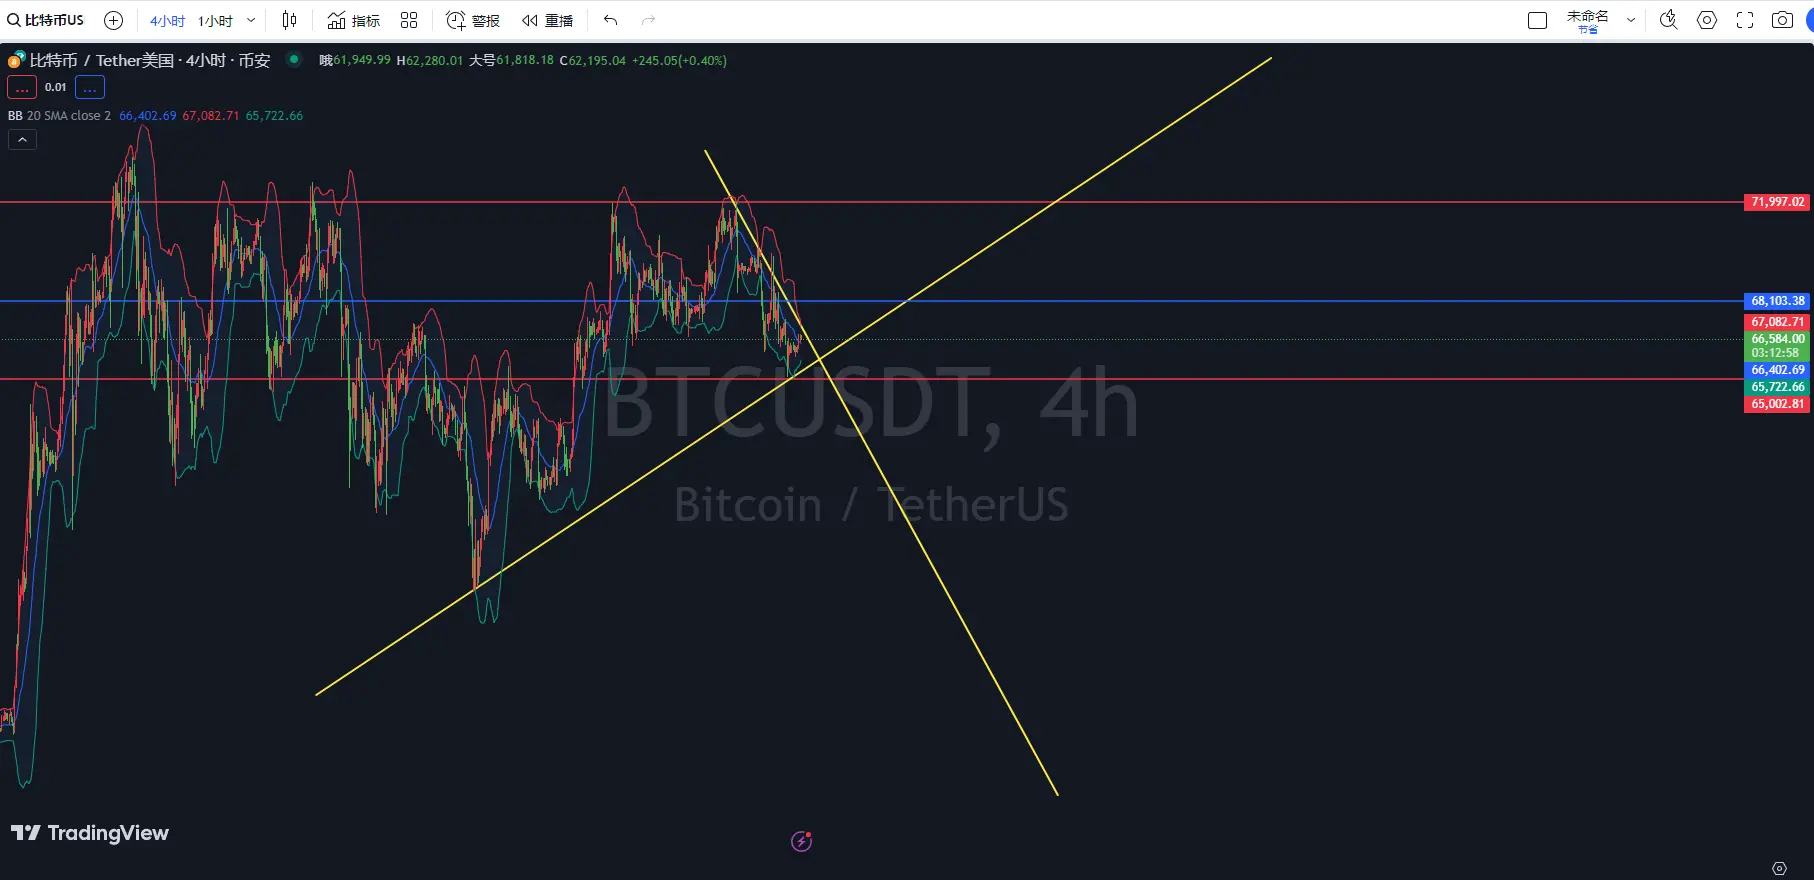
According to the current 4H Bitcoin chart, we can see that the MACD moving average is operating below the zero line, with both the DIF line and DEA line in the negative territory. However, the DIF line is approaching the DEA line, indicating a potential golden cross signal. If the DIF line breaks above the DEA line, it means that bullish momentum is strengthening, which would lead to a continued rise in Bitcoin's price.
Next, looking at the 4H KDJ indicator, the current K-line value and D-line value are moving upwards, with the J-line rising much faster than the other two lines, and all KDJ values are above 50, indicating a dominant bullish trend. Currently, the K-line value and D-line value have formed a golden cross, suggesting that Bitcoin's price has further upward potential in the short term.
Finally, examining the Bollinger Bands indicator on the 4H chart, the current price is operating between the middle and upper bands. If the price can break above the middle band, it indicates that the upward trend will continue. The upper and lower bands are expanding, showing increased market volatility. The current price is close to the 4H middle band, and if it breaks above the upper band and stabilizes, it will further confirm the bullish trend.
Bitcoin 1-Hour Chart

According to the current 1H Bitcoin chart, we can see that the price is located between the middle and upper Bollinger Bands, and is close to the upper band, indicating that the current market is relatively strong. However, it has not effectively broken above the upper band for a long time, so attention should be paid to the resistance at the upper band.
Next, looking at the KDJ indicator in the 1H timeframe, the K, D, and J lines are currently all in the overbought area and showing signs of turning down, with the J line also starting to decline, indicating a risk of a pullback or fluctuation in the short term.
Finally, based on the MACD indicator in the 1H timeframe, the DIF line and DEA line are currently above the zero line, with the DIF line above the DEA line, also indicating that the current trend is bullish. However, the MACD red histogram is gradually shortening, suggesting that the bullish upward momentum is weakening, and caution should be taken regarding the risk of a pullback.
Comprehensive Analysis: Combining the MACD, KDJ, and BOLL indicators, Bitcoin shows potential for a rebound in the short term on the 4-hour chart, but further observation of the MACD golden cross and the breakout of the Bollinger Bands middle band (66413) is needed to confirm the stability of the mid-term trend. On the 1-hour chart, Bitcoin indicates that it may face some fluctuations or slight pullbacks in the short term, but the overall trend still leans towards bullish. It is recommended to closely monitor whether the price can maintain above the Bollinger Bands middle band (66364) and the further movements of the MACD indicator. If the KDJ indicator continues to decline and the MACD red histogram further shortens, caution should be taken regarding a significant pullback.
In summary, the following suggestions are provided for reference:
Buy Bitcoin on a pullback to around 66400, targeting 68100, with a stop loss at 66000.
Instead of giving you a 100% accurate suggestion, I prefer to provide you with the right mindset and trend. After all, teaching someone to fish is better than giving them a fish; learning to earn for a lifetime is more valuable than a one-time gain! Focus on the mindset, grasping the trend, planning the market layout and position. What I can do is use my practical experience to help you, guiding your investment decisions and management in the right direction.
Written on: (2024-06-17, 00:10)


