
IOSG: BTC data indicates that we have entered a new bull market cycle

 IOSG research indicates that we are currently in the sixth cryptocurrency bull market cycle, which has lasted for over a year.
Author: Darko Bosnjak, IOSG Ventures
TL;DR
- IOSG research indicates that we are currently in the sixth cryptocurrency bull market cycle, which has lasted for over a year.
- Based on historical market cycle patterns, IOSG believes: we are currently in the mid-early stage of a medium-length bull market cycle and are entering the mid-late stage (accumulation -> rising -> distribution -> declining), and we are entering the climbing phase.
- Recently, the second occurrence of the 50-day moving average crossing above the 200-day moving average in the crypto cycle represents a positive signal. This technical indicator has stable historical backtesting data, with over 80% of cases showing positive returns in the medium term.
- Compared to previous cycles, the current Bitcoin bull market cycle is unusually stable, but if we refer to historical patterns, IOSG expects at least 10 more corrections (over -5%) before reaching the peak of this cycle.
- Bitcoin prices often experience significant increases both before and after the halving event.
- IOSG: Although the Bitcoin halving event coincides with changes in market cycles, it may not be the direct cause of market changes but rather aligns with broader global economic trends.
Research Motivation
To better understand and respond to the current market situation, we need to study the formation and development of historical market cycles, as well as the various factors that influence these cycles.
By referencing the lessons learned from past market cycles, we can gain deeper insights into market behavior. Additionally, understanding the duration, magnitude, and characteristics of past cycles can help assess the current market situation and identify potential market turning points.
About Cyclicality
Market cycles are generally defined as the periods between two major low points of a broader market index (such as the S&P 500). Global market cycles are influenced by business cycles, economic conditions, and investor sentiment. On a more micro level, various industries, sectors, and assets bear the marks of these macro cycles but are still influenced by their own industry-specific and unique factors.
In general, cycles have four distinct stages or periods that describe the behavior of market participants: accumulation (attracting chips), marking up, distribution (distributing chips), and marking down.
In the initial stage, the accumulation phase marks the end of a downtrend. The prevailing sentiment is distrust and uncertainty, as market participants cautiously navigate a low price volatility environment.
Transitioning to the rising phase, the bull market takes center stage. Investor sentiment is optimistic and active, as the market moves out of a rising trend in price candlesticks.
During the distribution phase of the market cycle, the narrative of sentiment begins to change, as market sentiment becomes dominated by overconfidence and greed.
Finally, the marking down phase signifies the arrival of a bear market. Anxiety and panic dominate market sentiment, with a continuous decline in the candlestick trend. The shadow of adverse economic conditions exacerbates investors' unease during this phase.
In this section, we focus on analyzing the inherent cyclicality of the cryptocurrency market, with particular attention to Bitcoin. Bitcoin has the highest market capitalization, large market value, and high trading volume, occupying an important position in the digital currency market. The price fluctuations of Bitcoin significantly affect the prices of other cryptocurrencies that are usually highly correlated with it.
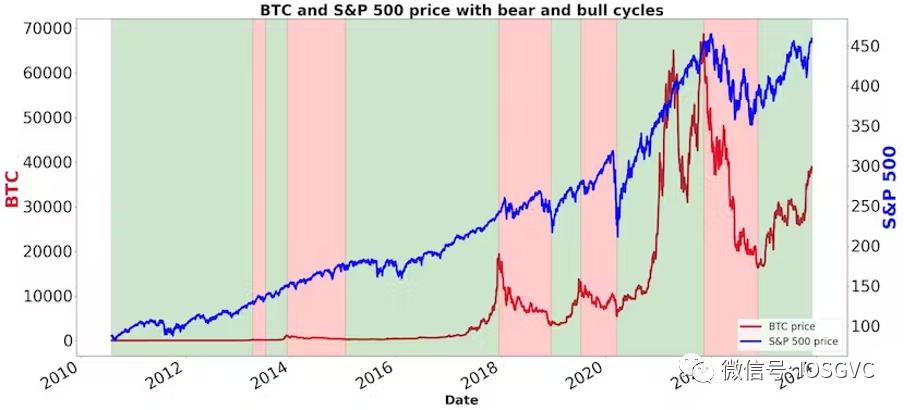
Since its inception, BTC has averaged more than a 2x increase each year; however, from a more macro perspective, we can identify distinct cycles.
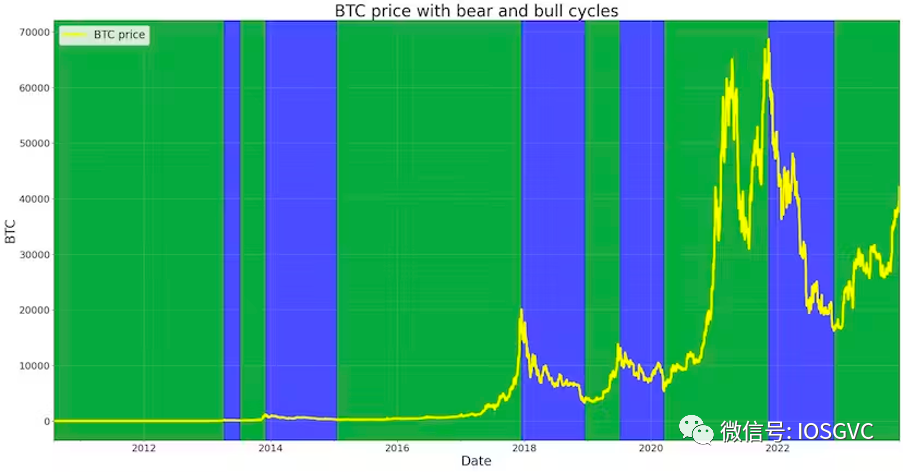
Source: IOSG Ventures
So far, we have experienced five (six if counting the current cycle) bull market cycles (green areas) and five bear market cycles (blue areas).
Currently, it appears that the cryptocurrency market is in the mid-stage of the sixth bull market cycle, experiencing the rising phase. The accumulation phase—the initial stage of the cycle—extended from the end of 2022 to the summer of 2023, when Bitcoin's volatility dropped to historical lows.
Exploring Historical and Current Parallel Performances
Currently, there is a viewpoint that denies the effectiveness of technical analysis, arguing that historical price and volume data lack the consistency needed to predict future stock prices. This perspective suggests that relying on past price trends and trading volumes does not provide an inherent advantage in predicting market trends. We relatively agree with this viewpoint, especially when assessing the performance of individual assets in isolation.
Conversely, we also believe that analyzing historical information is valuable for understanding the cyclicality of the market. While it cannot provide precise predictions of future price movements, analyzing historical data can cultivate intuition and help avoid biases. By carefully studying market cycles, one can help avoid unnecessary bullish enthusiasm, such as the super-cycle rhetoric held during market rises (greed phase), and counteract pessimistic bearish rhetoric during market declines (panic phase). This can cultivate a resilient and insightful mindset, allowing for a more rational and cautious response to the market's ups and downs, without being swayed by transient market emotions.
Basic Data Statistics
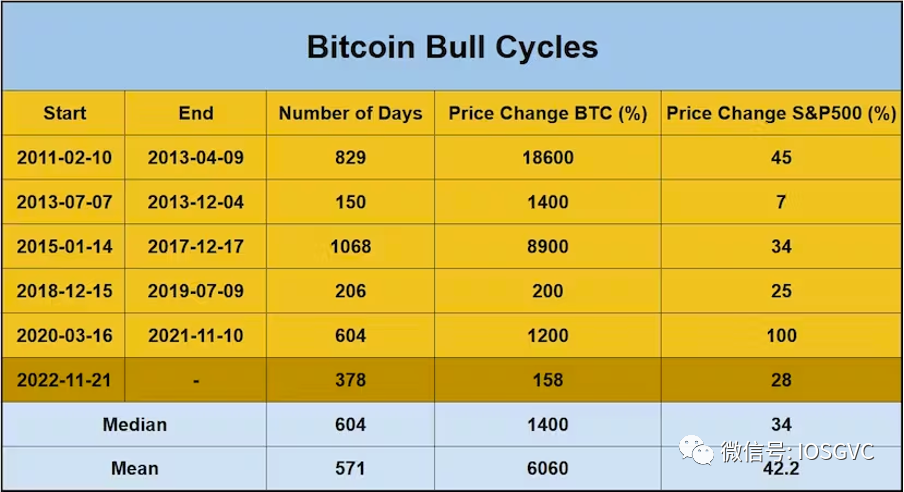
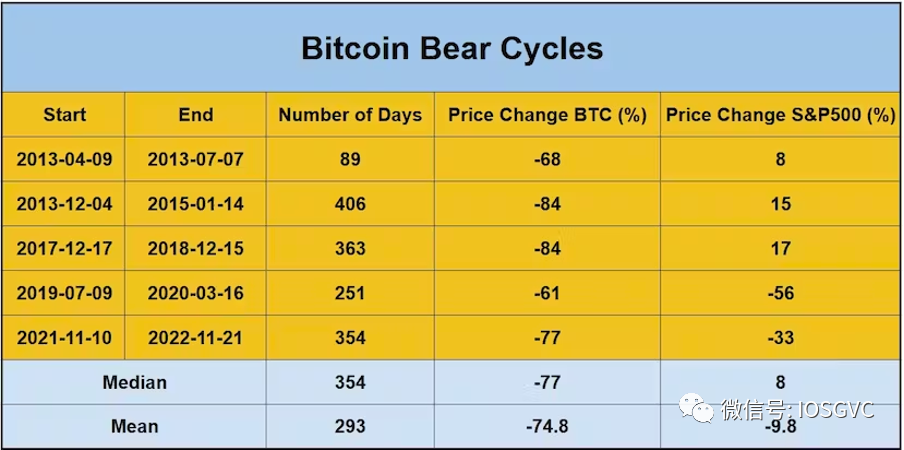
In the table below, we present statistical data for each historical bull and bear market cycle.
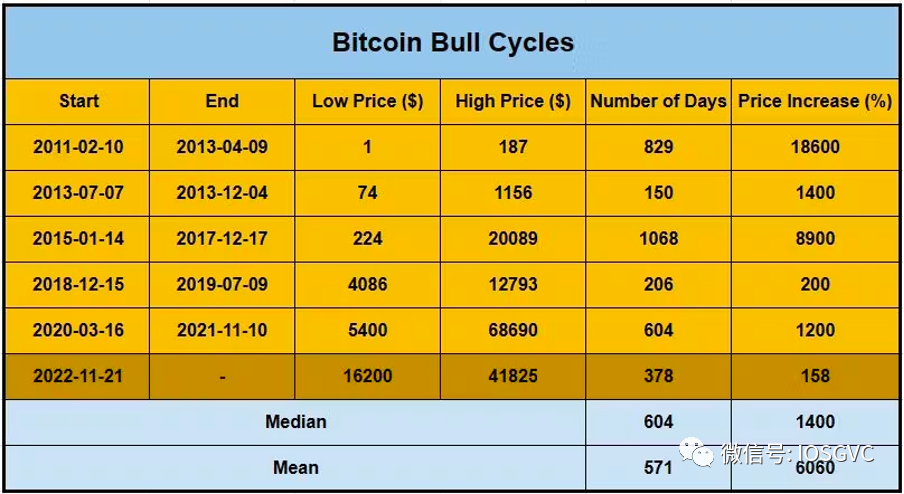
 Source: IOSG Ventures
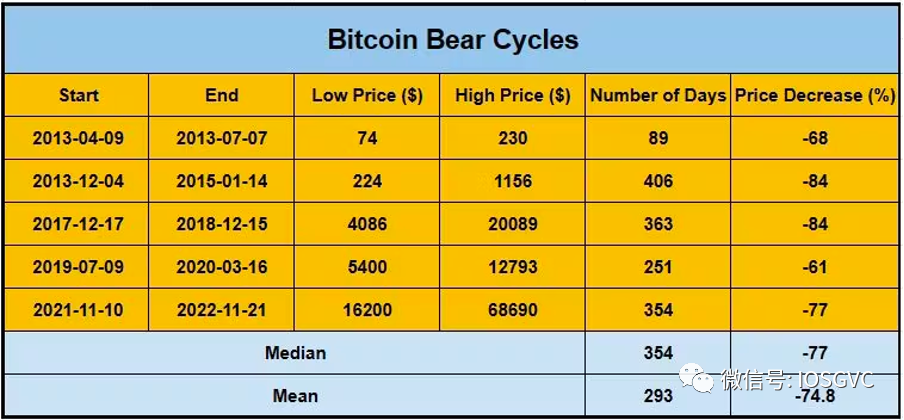
Analyzing past cycles, the median drop in previous bear market cycles was -77% (with an average drop of about -75%). The most recent bear market cycle dropped exactly 77%. On the other hand, the median price increase during bull market cycles was 15 times (with an average increase of about 60 times).
As for the duration of the cycles, the median duration of bear market cycles was 354 days, with an average duration of 293 days. The most recent bear market cycle lasted 354 days. For bull market cycles, the median duration was 604 days, with an average duration of 571 days.
Bull Market Countdown
The current bull market cycle has lasted about a year. Below, we will compare the returns of Bitcoin in this cycle with those of previous cycles within a similar time window.

Source: IOSG Ventures
The bull market cycle from 2018-2019 ended in less than a year, with a return of about 3.9 times. The cycles from 2020-2021 and 2015-2017 lasted over a year, with respective returns of 11 times and 1.9 times in the initial 365 days. Essentially, the returns of the 2020-2021 cycle were primarily realized in the first year of the bull market, while the 2015-2017 cycle accelerated its performance after the first year.
For the current bull market cycle, Bitcoin's price has increased 2.6 times from the bottom, roughly placing it in the middle of a medium-duration bull market cycle.

Source: IOSG Ventures
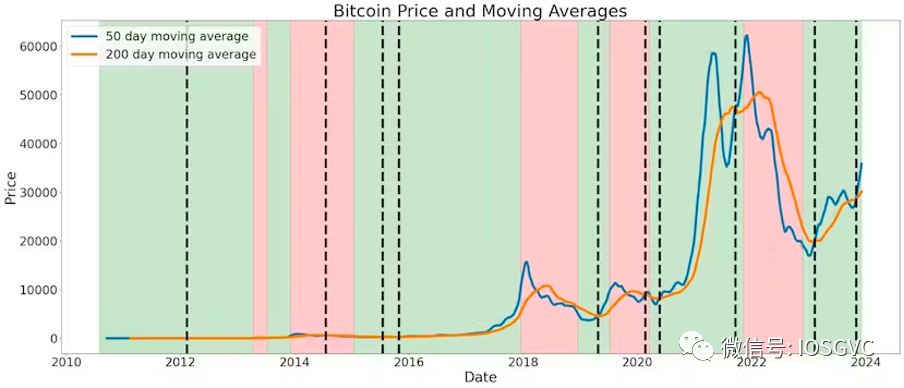
In the past few weeks, for the second time since the start of this cycle, the 50-day price moving average (MA) has crossed above the 200-day MA. In fact, we have rarely seen such a pattern occur twice in a short time. Historically, this event has only happened once during the 2015-2017 bull market.
Source: IOSG Ventures
At that time, after the second 50/200-day MA crossover in the 2015-2017 bull market cycle, BTC's results were as follows:
90 days later - Return of 1.27 times
180 days later - Return of 1.43 times
365 days later - Return of 2.26 times
Throughout Bitcoin's entire history, the 50-day MA has only crossed above the 200-day MA in 6 instances. Statistically, it can be predicted that there is over an 80% chance (5 out of 6 historical events) that there will be positive returns one year after the crossover occurs.
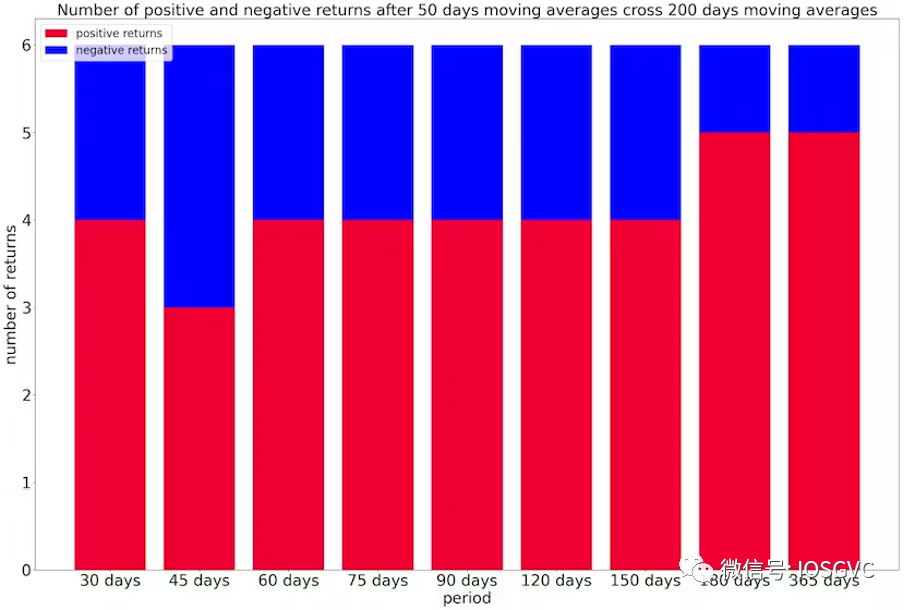
Source: IOSG Ventures
On average, the expected Bitcoin (BTC) returns after bull market crossover events are as follows:
90 days later: 1.1 times
180 days later: 1.33 times
365 days later: 2.5 times
Rugged Road Ahead
According to IOSG observations, the smoothness exhibited in this bull market cycle exceeds that of any previous Bitcoin cycle.
During the ascent to its peak, the previous cycle experienced nearly 115 daily corrections of 5% or more (where we refer to negative returns as corrections), while this cycle has only experienced 10 such corrections. Even shorter cycles have had more corrections than this cycle.
So far, no bull market cycle has ended with fewer than 20 daily corrections of over 5%. Therefore, if this bull market cycle shares characteristics with previous bull market cycles, we expect at least 10 more corrections to occur as the market continues to rise before transitioning to bearish sentiment.

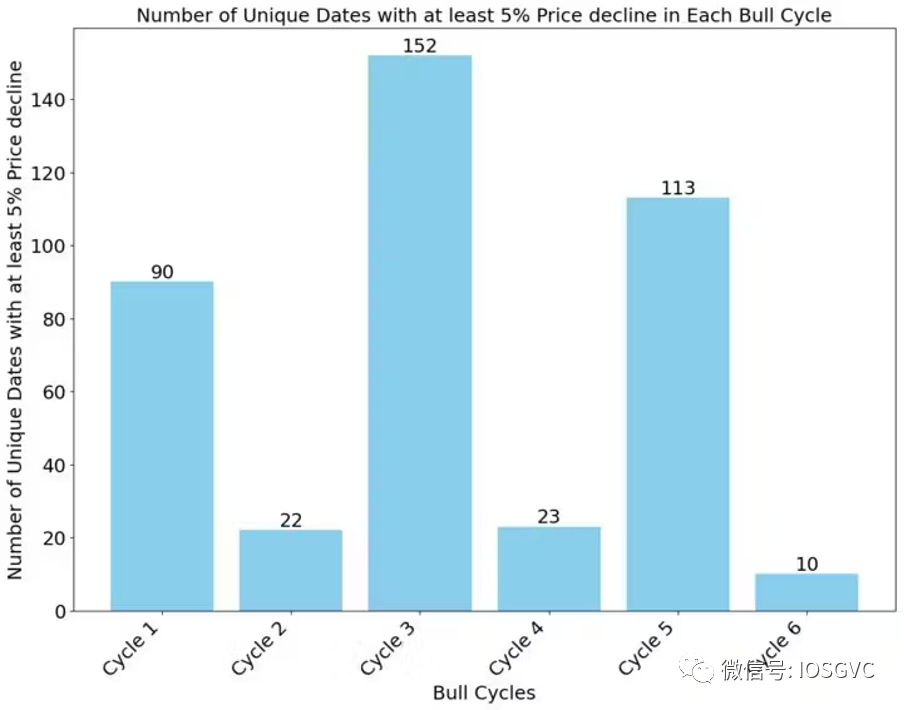
Source: IOSG Ventures
Impact of BTC Halving
Bitcoin halving is a preset event within the network that occurs approximately every four years, specifically when 210,000 blocks are mined. During a halving, the rate of new BTC generation is halved.
This has significant implications for Bitcoin miners, as their mining rewards are also halved. Consequently, competition for mining becomes more intense, prompting miners to seek more cost-effective energy sources to sustain their operations.
Moreover, halving greatly reduces the number of new Bitcoins entering the market, leading many market participants to view halving as a bullish catalyst.
To illustrate the impact of halving, let’s look at the issuance of Bitcoin before and after each halving. Before the first halving, the issuance of Bitcoin exceeded 10 million. Before the second halving, the issuance was slightly above 5 million, and before the third halving, the issuance was about 2.5 million.
These statistics highlight the decreasing issuance of new Bitcoins over time, emphasizing the scarcity and long-term appreciation potential of cryptocurrencies.

Source: IOSG Ventures
While analyzing only three historical halving events may not provide a statistically significant sample size to draw definitive conclusions, the importance of halving events within the Bitcoin community and their widespread discussion as bullish catalysts cannot be overlooked. In light of this, we will delve deeper into the relevant data of historical halving events below.

Source: IOSG Ventures
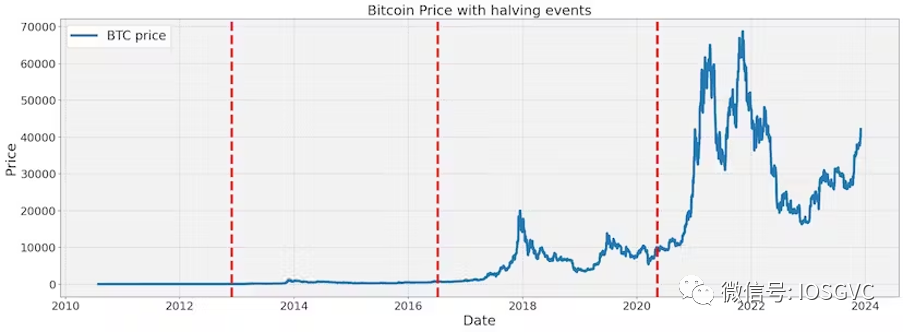
The next halving is expected to occur around April 2024 at block 840,000. The mining reward will decrease to 3.125 BTC.
These cycles are clearly visible and seem to correlate with halving events, as seen in the following chart showing the changes in BTC prices after halving events:
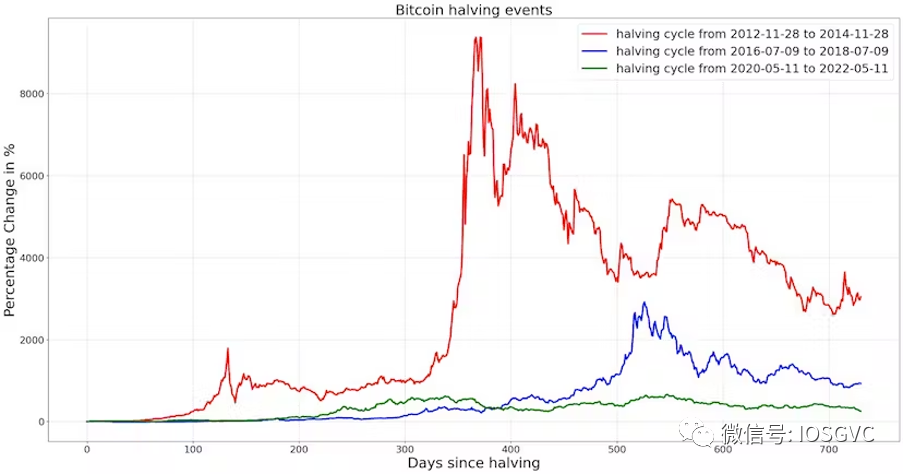
Source: IOSG Ventures
In percentage terms, as BTC matures as an asset, the impact of halving gradually diminishes. After the last halving event, the price increased more than six times one year later.

Source: IOSG Ventures
Analysis of the Pre-Halving Period
In the lead-up to the anticipated halving event, we also observed strong BTC price movements, although not as intense as after the halving. Similarly, in each new cycle, the increases have been moderate, ranging from 400% to 150%, and then peaking at 25%.

Source: IOSG Ventures
Macroeconomic and Cryptocurrency Bull Market Cycle Overlap Analysis
Before determining the impact of halving events on the cyclicality of the cryptocurrency market, we should attempt to separate the influence of global macro cycles on cryptocurrencies.
Source: IOSG Ventures
As shown in the above chart, there are many overlaps, especially in recent years. Therefore, we cannot say that halving events play a decisive role in the timing of new cycle beginnings.
While a positive macro environment may be a primary factor determining the cyclicality of cryptocurrencies, halving cycles and other specific cryptocurrency events may also significantly impact the scale of bull markets.
Source: IOSG Ventures
Cryptocurrency traders may closely monitor the macro environment, as interest rates, oil prices (energy costs), and the outcomes of ongoing geopolitical conflicts will significantly impact the overall macro cycle.
In terms of cryptocurrencies, so far, the main bullish triggers have been a series of high-profile bank failures, speculation around cryptocurrency ETF products, and the resolution between Binance and regulators, which has eliminated one of the largest potential black swan events.
Conclusion
While we remain optimistic about the coming months, the historical trend of cycles transitioning from boom to correction reminds us that reaching overvalued levels is not uncommon. We are at a critical point of overconfidence and greed, where excessive confidence and greed often dominate, potentially leading to volatile environments and irrational valuations.
Although this analysis suggests that enthusiasm for cryptocurrency investment is likely to grow further and that positive momentum will continue, we also need to approach this with caution.
After all, compared to earlier cycles, Bitcoin's current state is that of a more mature asset. The increasing institutionalization and maturation of this asset class raise concerns about the effective market hypothesis coming into play. We recognize that as assets mature, historical pattern analysis may become less applicable. In light of this, it is invaluable to view and analyze the market with a balanced and realistic perspective.


