Can DeFi liquidity trends predict market prices?

 In the past week, MKR and COMP have performed well. How can we extract token price expectation signals from the changes in DEX liquidity?
Original Title: Is DeFi Back in Business?
Original Author: Glassnode, Alice Kohn
Compilation: Daling Think Tank
In 2023, people have been receiving various positive and negative news regarding the regulation of the crypto industry, and the performance of altcoins and DeFi has been greatly influenced by this news. In the past week, MKR and COMP have performed exceptionally well. In this article, we will explore how to extract token price expectation signals from changes in DEX liquidity.
Summary
- Some positive momentum in the crypto industry and the development of DeFi have sparked investor interest in DeFi tokens.
- The rising popularity of DeFi tokens has attracted the attention of market makers, who have increased liquidity in their respective pools, indicating their optimism about the trading and price prospects of these tokens.
- Further analysis of Uniswap's trading volume distribution shows that a significant portion of trades is executed by MEV bots, which primarily focus on ETH-stablecoin pairs.
Among them, DeFi tokens have shown the strongest performance, with the DeFi price index rising 56% since its low on June 11. In contrast, other markets such as GameFi and Staking have performed poorly.
 Figure 1: Price Index (Ethereum Ecosystem)
The DeFi index is composed of the top 8 DeFi tokens by market capitalization and has maintained an upward trend for nearly two months.
 Figure 2: DeFi Blue Chip Index
When we observe the top eight DeFi tokens separately, we find that two tokens stand out as the main drivers of this upward trend: MKR and COMP. A closer look reveals that their performance is likely closely related to the fundamentals of recently launched projects rather than the overall market development.
On June 28, Compound founder and CEO Robert Leshner announced his exit from the lending protocol and launched a new project focused on creating regulated financial products that connect traditional markets and the blockchain ecosystem. Following this announcement, COMP surged 83% within a week.
 Figure 3: Robert Leshner's Announcement
Shortly thereafter, MakerDAO launched its smart burn engine, a buyback plan that uses over $50 million (approximately $19.6 million) of DAI held by the protocol to buy back MKR and add it to the LP on Uniswap V2, resulting in a 43% increase in MKR's price this week.
 Figure 4: DeFi Blue Chip Index: Weekly Price Performance
We analyzed the DEX and CEX trading volumes of the top eight DeFi tokens and observed a renewed interest in DEX. The share of DEX trading volume increased from 3.75% at the beginning of June to 29.2% today, approaching the highs of the second half of 2022.
 Figure 5: DeFi Blue Chip Index: DEX vs CEX Trading Volume Share
Uniswap Trading Volume Distribution
With the continuous increase in DEX activity, we can investigate how recent events have affected DEX activity and the inherent impact on stakeholders. We first focus on one of the leading DEXs: Uniswap, which has also been a major gas consumer over the past week.
Currently, Uniswap's trading volume on the Ethereum mainnet is $5.57 billion per week, significantly lower than levels in previous years. At the beginning of 2023, interest in LSTs (liquid staking tokens) triggered a surge in trading volume, and "Memecoin" trading also saw a brief rise, but then returned to calm.
From this perspective, the recent BTC ETF applications and the SEC-Ripple case have not triggered a noticeable increase in Uniswap trading activity.
 Figure 6: Uniswap Weekly Trading Volume
Next, we look at the distribution of Uniswap trading volume on L2. It is clear that a significant portion of trading has shifted from the Ethereum mainnet to Arbitrum, with Arbitrum accounting for as much as 32% of trading volume in March and maintaining a high level in June and July, which is one reason why Uniswap's trading volume on the Ethereum mainnet is low.
 Figure 7: Uniswap: Weekly Trading Volume Share by Chain
MEV Bots Account for 70% of Trading
Another way to understand the context of Uniswap trading activity is to look at the types of traders executing the trades. Since 2019, we have seen the emergence of various types of MEV bots, which are automated programs that monitor the Mempool to identify trades that can yield extra profits. For better analysis, we focus on two types of MEV bots: arbitrage and sandwich bots.
Arbitrage bots aim to profit from different prices of the same asset across different trading platforms.
Sandwich bots operate by executing their trades ahead of a target trader's (assumed buyer's) trade, causing the price of that asset to rise. Subsequently, the sandwich bot sells the asset again to narrow the price gap, maximizing value for both parties.
The following chart shows the ratio of bot trading volume to manual trading volume on Uniswap (Ethereum).
We observe that sandwich bots generally account for over 60% of daily trading volume. Since the beginning of this year, the share of trading volume from arbitrage bots has decreased from about 20% to 10%. Meanwhile, since early July, the share of trading volume generated by manual traders has increased by 30%, consistent with the period of DeFi token frenzy.
Note: Different types of bots generate different trading volumes and transaction counts. For example, sandwich bots execute at least two trades, creating trading volume that is twice that of manual traders.
 Figure 8: Trading Volume Share by Different Types of Trades
Due to the varying degrees of trading volume inflation caused by different types of bot attacks, the daily trading count categorized by trader type provides another comparative perspective.
We can see that during significant events such as USDC depegging or the Memecoin frenzy, manual traders are very active. As price volatility increases and "target traders" flood in, arbitrage and sandwich bots also become active, with their activity tripling during periods of rising manual trading volume.
 Figure 9: Uniswap: Trading Volume Share by Different Trade Types
The following chart shows the preferred tokens and liquidity pools for each type of trader, indicating that all three types of traders prefer the largest and most liquid trading pairs, ETH-USDC and ETH-USDT.
 Figure 10: Different Types of Traders on Uniswap and Their Shares
Liquidity Pool Performance Reflects Price Expectations
After the launch of Uniswap V3, liquidity providers can allocate liquidity within specified price ranges in the pool. Rather than spreading liquidity across an infinite price range, it is more effective to concentrate liquidity in the price ranges where investors expect the highest trading volume (to collect fees).
 Figure 11: Uniswap V3 Price Range
Since the announcement of MakerDAO's buyback plan, the most successful liquidity pool on Uniswap V3 has been the MKR/WETH pool, which has seen a significant increase in liquidity.
Although MKR accounts for the vast majority in this pool, the liquidity depth of WETH has increased by over 700%. This indicates that liquidity providers are signaling that trading volume for the MKR-WETH trading pair is expected to increase.
 Figure 12: MKR-WETH Depth
After studying the composition of this liquidity pool, we can clearly see that the proportion of WETH has increased, currently accounting for 21.2% of the total. This indicates that traders are increasingly using WETH to purchase MKR, suggesting that demand for MKR in the market has significantly risen since early June.
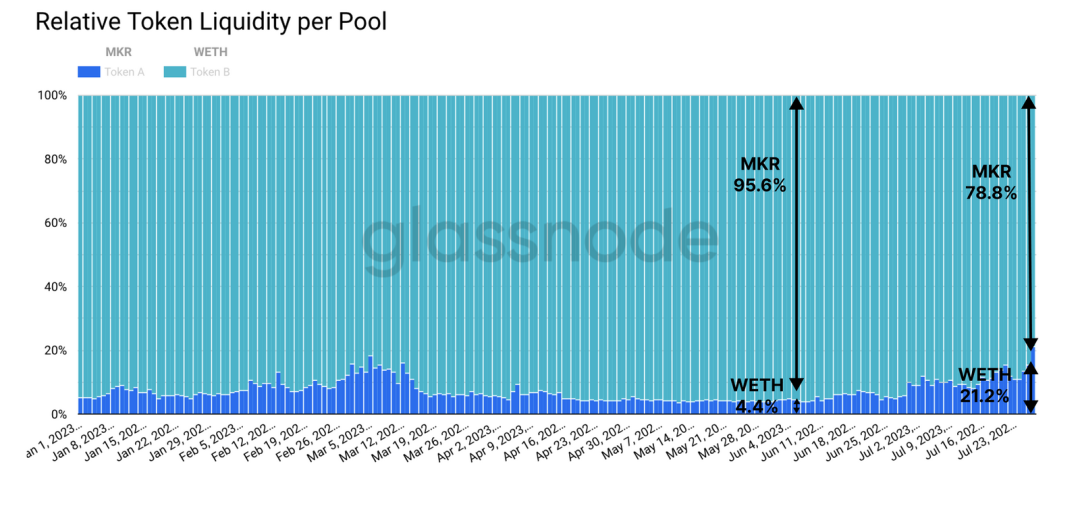 Figure 13: Liquidity Depth of Two Tokens
Can Uniswap's liquidity pools predict the price development of tokens? By analyzing the MKR-WETH liquidity, we find that liquidity tends to increase when the price is significantly higher than the MKR/ETH exchange rate.
As liquidity providers add their liquidity to higher price ranges, they can be seen as a kind of out-of-the-money option on gas fees at higher price points. If we assume that liquidity providers are rational profit-seekers, their changes in liquidity may provide price signals similar to those offered by options markets, yielding predictions about the volatility and price range of the relevant tokens.
 Figure 14: Liquidity Distribution in Price Volatility
Conclusion
In 2023, positive and negative news surrounding digital asset regulation has repeatedly emerged. In recent weeks, DeFi tokens led by MKR and COMP have performed particularly well. However, after analyzing trading activity on Uniswap, the increase in DEX trading activity does not seem to have affected the price movements of these tokens.
One explanation for this is the increasing share of trading volume on L2s like Arbitrum, along with a decrease in the number of human traders. With fewer manual trades, the activities of arbitrage and sandwich bots have also decreased.
For MKR, the significant increase in market makers providing liquidity to the Uniswap pool indicates a certain expectation of increased trading volume. Thus, we propose the concept that the distribution of liquidity can effectively provide expectation signals for the price range of the relevant tokens.