Continue Capital Research: An Exploratory Analysis of the Valuation Model for Leading Public Chains and Their Ecosystems

 Once we have a valuation central system for ecological DEX, it provides a suitable reference for extending from DEX to other tracks in the public chain ecosystem, just like having a weight that can measure the actual value of most projects.
Original Title: 《Discussion and Analysis on the Valuation Model of Top Public Chains and Their Ecosystems 》
Original Author: Pima, Continue Capital
The popular ARB is about to launch, and this time the market has finally returned to rationality. After looking at various valuation models, they are basically reasonable, with a central range of 10-20 billion, and the differences are not significant. Other data (TVL/wallet numbers/transfers/active addresses, etc.) can be referenced. Currently, the market valuation of public chains has stabilized, and the differences in understanding of future technological evolution will determine the future growth potential of public chains, which is a relatively high difficulty alpha.
Moreover, as investors, we must understand what is normal. Just like when a person is sick, you may not know the name of the illness, but you can certainly feel that some of your daily behaviors are different from those of normal people. For example, a normal person has a bowel movement once a day, while you may have it three or four times; a normal person sleeps until dawn, while you wake up once between 1 AM and 3 AM every day. You may not know where the problem lies, but you must understand that this is not a normal state.
Returning to investment, you must also understand some valuation norms. For example, the long-term secondary valuation center for CEX represented by BNB is PE=5. You can look at each quarter's Binance financial report, and other HT/FTX can also be traced. There are data for both bull and bear markets, and the median is basically around 5. Sometimes PE drops to 3 or rises to 10 in a bull market, which are all normal ranges, but you must understand the significant meaning of industry recognition parameters.
The so-called industry recognition parameters refer to a segmented market in its early development stage where most people do not understand it well, but the prospects painted are full of hope. At this time, there are often mixed players, and the typical characteristic is that you do not know who the leader is. The industry grows very quickly, and the PE given will be very high; as the market cap grows rapidly, and industry recognition improves, once the penetration rate reaches the critical point of 30%, the growth rate will begin to slow down, and valuations will gradually stabilize. PE will return to the central line, value discovery will be completed, and the industry will enter a mature development phase, driven by profits rather than valuations. (Currently, L2/ZK is a typical example of the early stage of industry development.)
Regarding public chains, after so many years of development, many data valuation models have also basically stabilized. The purpose of this article is to explore the valuation system of public chains and ecosystems from another perspective.
Assuming we define the market cap of top public chains other than ETH during the same period as PMC, define Ethereum Market Cap as EMC, and define PE=PMC/EMC.
Currently, the normalized stable market cap for top public chains is: ADA 12 billion, MATIC 11 billion, SOL 8 billion; denominator ETH 210 billion.
We select the historical high and low market cap of top public chains over a certain period (rough data):
- ETH Market Cap: 2017 130 billion, 2018 10 billion; 2021 540 billion, 2022 140 billion
- ADA Market Cap: 2017 30 billion, 2018 1 billion; 2021 95 billion, 2022 9 billion
- EOS Market Cap: 2018 15 billion, 2018 2 billion (during these two periods, ETH's market cap was 74 billion and 10 billion)
- SOL Market Cap: 2021 90 billion, 2022 4 billion
Let's look at the PE=PMC/EMC market cap comparison at different times:
- ADA PE: Bull Market 300/1300=23% Bear Market 10/100=10%; Bull Market 950/5400=17.5%, Bear Market 90/1400=6.4%
- EOS PE: Bull Market 150/740=20%, Bear Market 20/100=20% (of course, after a round of bull and bear, EOS is no longer among the top at the same time)
- SOL PE: Bull Market 900/5400=16.6% Bear Market 40/1400=2.8% (considering the extreme factors due to FTX's bankruptcy)
Currently, in a normalized market: ADA 12/2100=5.7%, MATIC 11/2100=5.2%, SOL 8/2100=3.8%.
Here, we are not comparing each public chain's market cap ratio with ETH, but rather selecting the largest non-ETH smart contract market cap at a certain stage (ADA, EOS, SOL) for comparison. Thus, we draw the following conclusion:
Law of Public Chain Valuation One: The optimal non-ETH smart contract platform PE normalizes in the range of 6%-20%.
What is the use of Law One?
Our statistics are based on Market Cap circulating market value, not fully diluted valuation (FDV). During the last two bull markets, project institutional investments were relatively small, unlike most current projects with a low circulating ratio. I believe Law One's greater role is to provide you with a valuation center at the beginning of a new project launch, that is, we use the new project's FDV/ETH market cap to measure the valuation level.
Looking back: On October 23, 2022, when APT was launched, FDV was 10 billion, and ETH was 160 billion, PE=100/1600=16%. When APT hit its lowest point of $3, PE=30/1400=2.1%; on January 26, 2023, APT FDV was 20 billion, ETH was 2000 billion, PE=200/2000=10%, and currently APT PE=130/2100=6.2%.
For OP, on June 2, 2022, FDV was 6.4 billion, ETH was 2100 billion, PE=64/2100=3%; on June 19, OP FDV was 1.8 billion, ETH was 1200 billion, PE=1.5%; currently OP is 11 billion, PE=5.2%.
Now we have a central concept. Assuming ARB launches with FDV of 10/20/30 billion, PE would be 4.7%, 9.5%, and 14.2%, respectively. The corresponding high or low range in Law One is clear. In the high range, it is suitable to replace the numerator public chain with the denominator ETH.
It is important to note that the applicable condition for Law One is that it must be a top public chain that you consider non-ETH; you cannot just throw any random project into this range. Many public chains may not even reach 6%, possibly less than 1% of ETH's market cap. So the question becomes which is the top public chain? This is essentially a buying question. Sorry, but as the saying goes, "different people have different views," and Lu Xun did not say this. However, Law One can provide a rough selling point: the closer you get to the 20% upper limit, the more you can sell and exchange for ETH.
It is important to distinguish that this selling point is not an absolute single price selling point. For example, if you sell APT at $10, and it rises to $100 in 2025, you cannot compare it like this. By 2025, ETH might be $10,000, PE=1000 billion/12000 billion=8.3%. The essence of Law One is to measure the growth rate of top public chains relative to ETH.
Will Law One be broken in the long term? For example, in a ten-year cycle? It is very possible. From the historical development trajectory, it is difficult for any entity to dominate in a completely competitive market. When a leader occupies 70% of the market share, that leader's market share is certainly at a peak stage.
The development of everything cannot have one entity dominating. With the presence of countries like the Netherlands, France, the UK, the US, and the Soviet Union, any country in a ruling phase will certainly have a second to counterbalance it. Similarly, in our stock market, well-known markets like chips, e-commerce, new energy, real estate, and many other sectors have a ratio of market share between the leader and the second (whether it is 4:3, 4:2, 3:2, 5:2). Including the current crypto market, BTC accounts for 43%, and the second ETH accounts for 18%. Therefore, in the long run, there will definitely be projects challenging ETH for a market cap share of 40% or even 50%, meaning that the upper limit of Law One's 20% will be broken. However, there is a timing issue here. ETH took nearly ten years to achieve stability at 50% of BTC's market cap.
The next project to stabilize at 50% of ETH's market cap will likely need to maintain long-term competitiveness amidst constant changes, which is very challenging. On the other hand, ETH is also continuously evolving, meaning that ETH's market cap will also continue to grow. To achieve 50% of its market cap may require challengers to have a very high absolute market cap, further increasing the difficulty of competition.
Law of Public Chain Ecosystem Valuation Two: The normalized range for conventional DEX in their respective public chain ecosystems falls between 1%-3%.
Assuming we define the fully diluted valuation of top DEX in each ecosystem as DFDV and the fully diluted valuation of public chains as PFDV, then DP=DFDV/PFDV, which means DEX total market cap/public chain total market cap.
Public chain ecosystems are diverse and varied. We will first focus on the core part. Currently, any public chain ecosystem's development cannot be separated from DEX, and the DEX market cap can serve as the value center for each public chain ecosystem, thus serving as a reference for measuring the valuation of other types of projects.
First, we need to understand what is normal. The current normalized market cap (as of March 20) is:
- UNI 6.5 billion, ETH 210 billion DP=65/2100=3%
- CAKE 3 billion, BNB 68 billion DP=30/680=4.4%
- JOE 180 million, AVAX 12 billion DP=1.8/58=3%
- ORCA 80 million, SOL 12 billion DP=0.8/120=0.6%
- Quickswap 84 million, MATIC 12 billion, DP=0.84/120=0.7%
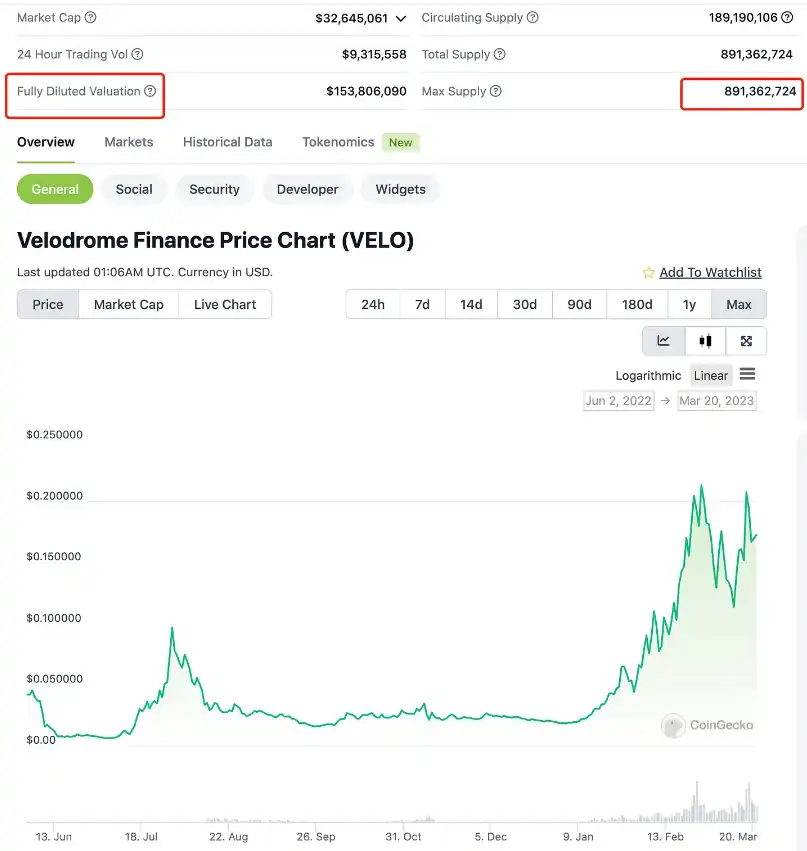
- Velodrome 150 million, OP 11 billion, DP=1.5/110=1.3%
- Camelot 400 million, ARB unknown
Next, let's look at the valuations given to DEX in the DeFi environment as a new track and when the entire market is in a bull market:
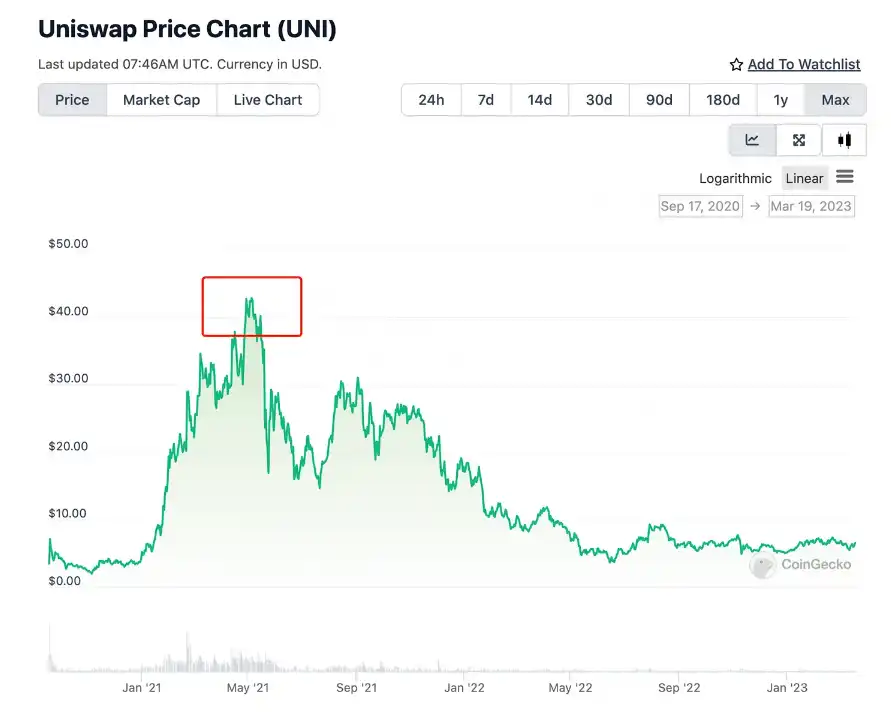
UNI peaked at 40, corresponding to FDV of 4 billion, while ETH's market cap was 40 billion, DP=400/4000=10%.
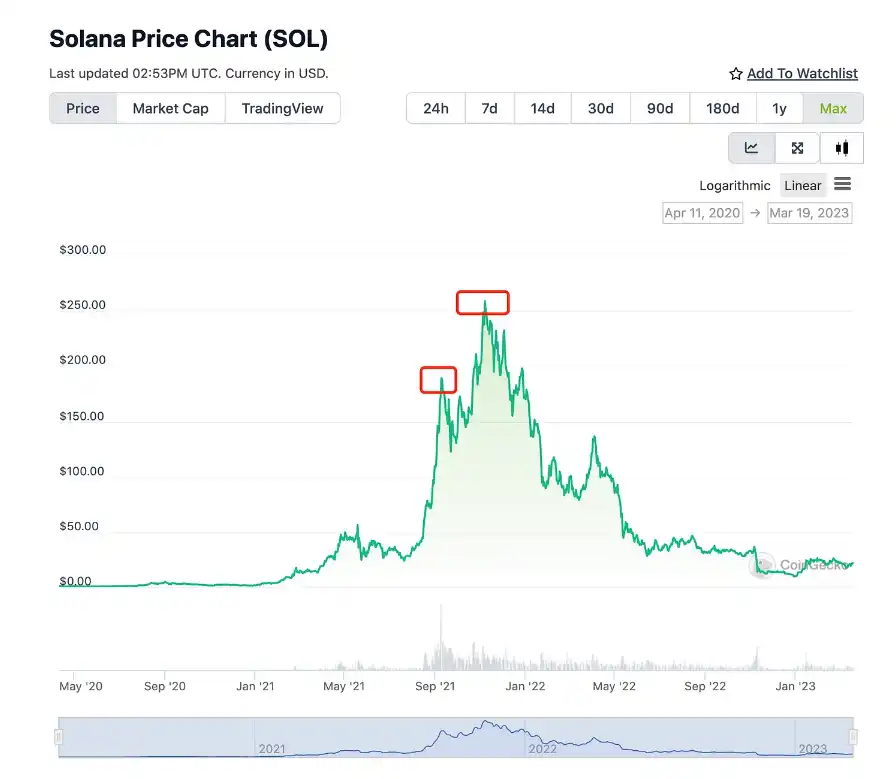
In the SOL ecosystem, DEX ORCA reached FDV of 1.8 billion twice in October and November 2021, with SOL FDV at 95 billion and 125 billion, respectively. The two DPs corresponded to 1.9% and 1.4%.
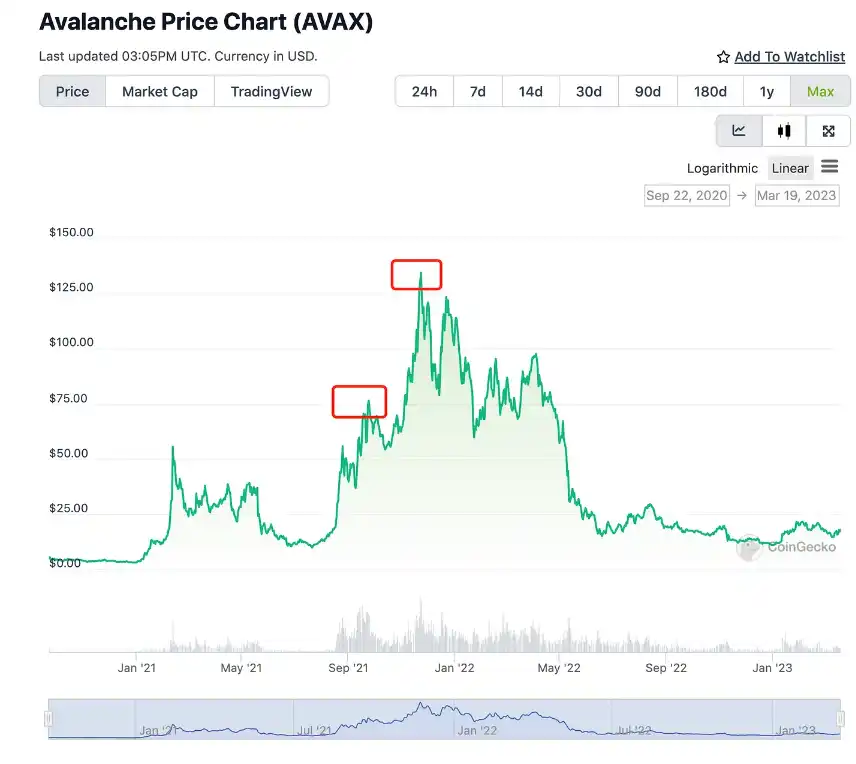
In the AVAX ecosystem, DEX JOE reached FDV of 2.2 billion in September and November 2021, with AVAX FDV at 54 billion and 96 billion, respectively. The two DPs corresponded to 4% and 2.2%.
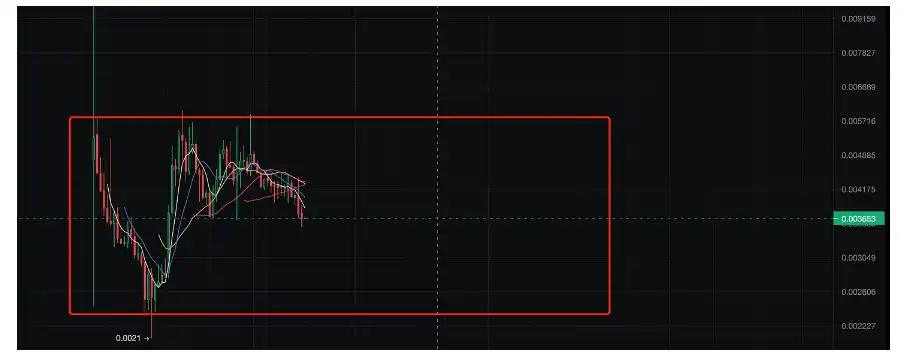
We see that as the most typical project in the DeFi industry, UNI enjoyed exclusive monopoly premiums and was given high valuations during the early development phase of the entire DeFi track, with a maximum DP of 10%. Therefore, it is difficult for conventional DEX to reach this valuation again. Additionally, we see that the price chart of UNI/ETH has long been in the range of 0.002-0.006. Considering the quantity differences between the two, the corresponding circulating market cap of UNI/ETH is roughly in the 2%-6% range. Given UNI's current monopoly position and the special nature of its premium, I still believe that the normalized upper limit for conventional DEX in their respective public chain ecosystems is 3%.
We do not deny that short-term factors such as sentiment, funds, and liquidity will affect DP changes, but we still believe that long-term normalization is the anchor for valuation, allowing it to become the center of value return. On the other hand, we are only examining conventional DEX here, excluding cross-chain DEX. I personally believe that cross-chain DEX will become the crown jewel of DeFi and the final breakthrough point (cross-chain DEX can interact with both EVM and non-EVM assets without using cross-chain bridges). We will have the opportunity to elaborate on this later.
What is the significance of this public chain ecosystem valuation Law Two?
Firstly, for undervalued ranges. We know that there will definitely be a DEX that matches its public chain market cap. For example, Velo is currently 150 million, OP 11 billion, DP=1.5/110=1.3%, which can only be considered reasonable. Similarly, there must also be a DEX for upcoming projects like zkSync/Starkware, which will reach 1%-3% of zkSync/Starkware's market cap in the future. Although these two mainnets have not yet launched, you can roughly provide a certain valuation based on the lower limit of Law One, for example, 8 billion, which means the corresponding DEX FDV would be around 800 million to 2.4 billion. As for which DEX it is, that requires deep community engagement and continuous observation of its data, users, development capabilities, and other conventional factors to make a choice. The key here is that zkSync/Starkware has not issued tokens, but their ecosystem's DEX may have already issued tokens, meaning you have a window for early participation, and all that remains is patience.
For example, APT has already issued tokens, but I do not know which DEX will emerge from its ecosystem. However, it is worth participating when the DEX FDV is at 5-10 million or even lower because according to Law Two, there will be a DEX on APT that reaches 1%-3% of its market cap.
Secondly, for overvalued ranges. Similarly, you can refer to the upper limit range of Law Two; the more it exceeds, the more suitable it is to exchange for the denominator public chain.
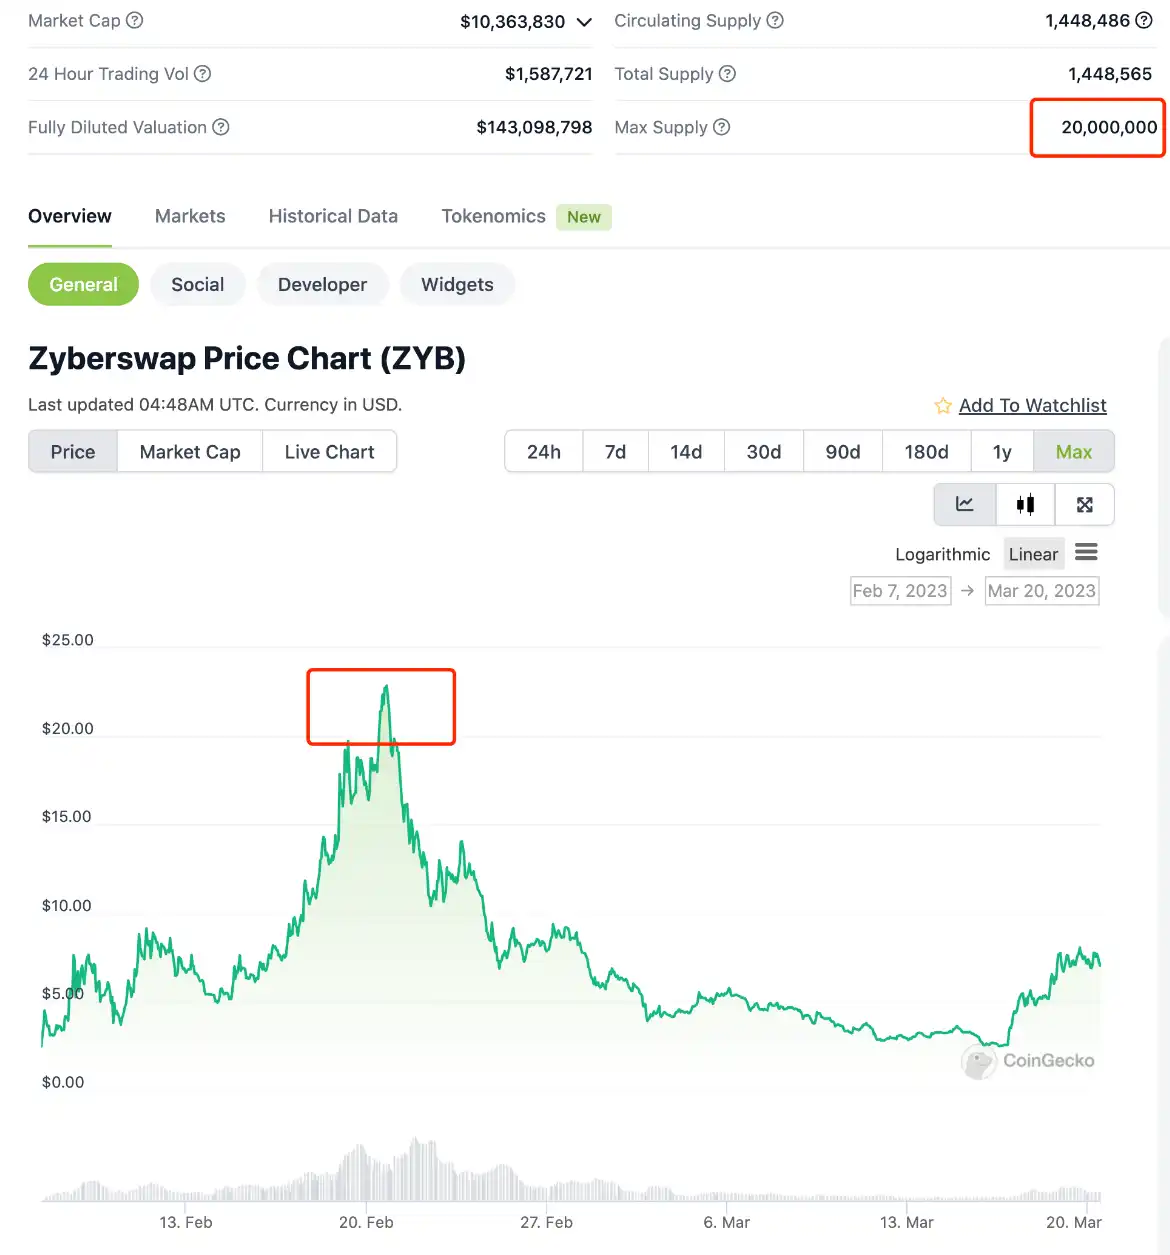
The last DEX on the ARB ecosystem, ZyberSwap, peaked at an FDV of 400 million. Conventional DEX are basically minor innovations, with no significant differences. Factors like liquidity mining, ve, and (3,3) models are not closely monitored. The short-term liquidity is low, TVL is rapidly increasing, airdrop expectations, and short-term sentiment and funds are high, contributing to a surge. However, this is not important; the core is that the valuation is 400 million, which means if ARB is 10 billion, then DP=4/100=4%. If ARB is 20 billion, then DP=2%. Conventional DEX will face constant attacks from other competing products in the long term, making it difficult to establish a moat. Therefore, the closer it gets to the 3% upper limit of Law Two, the more suitable it is to exchange for ARB.
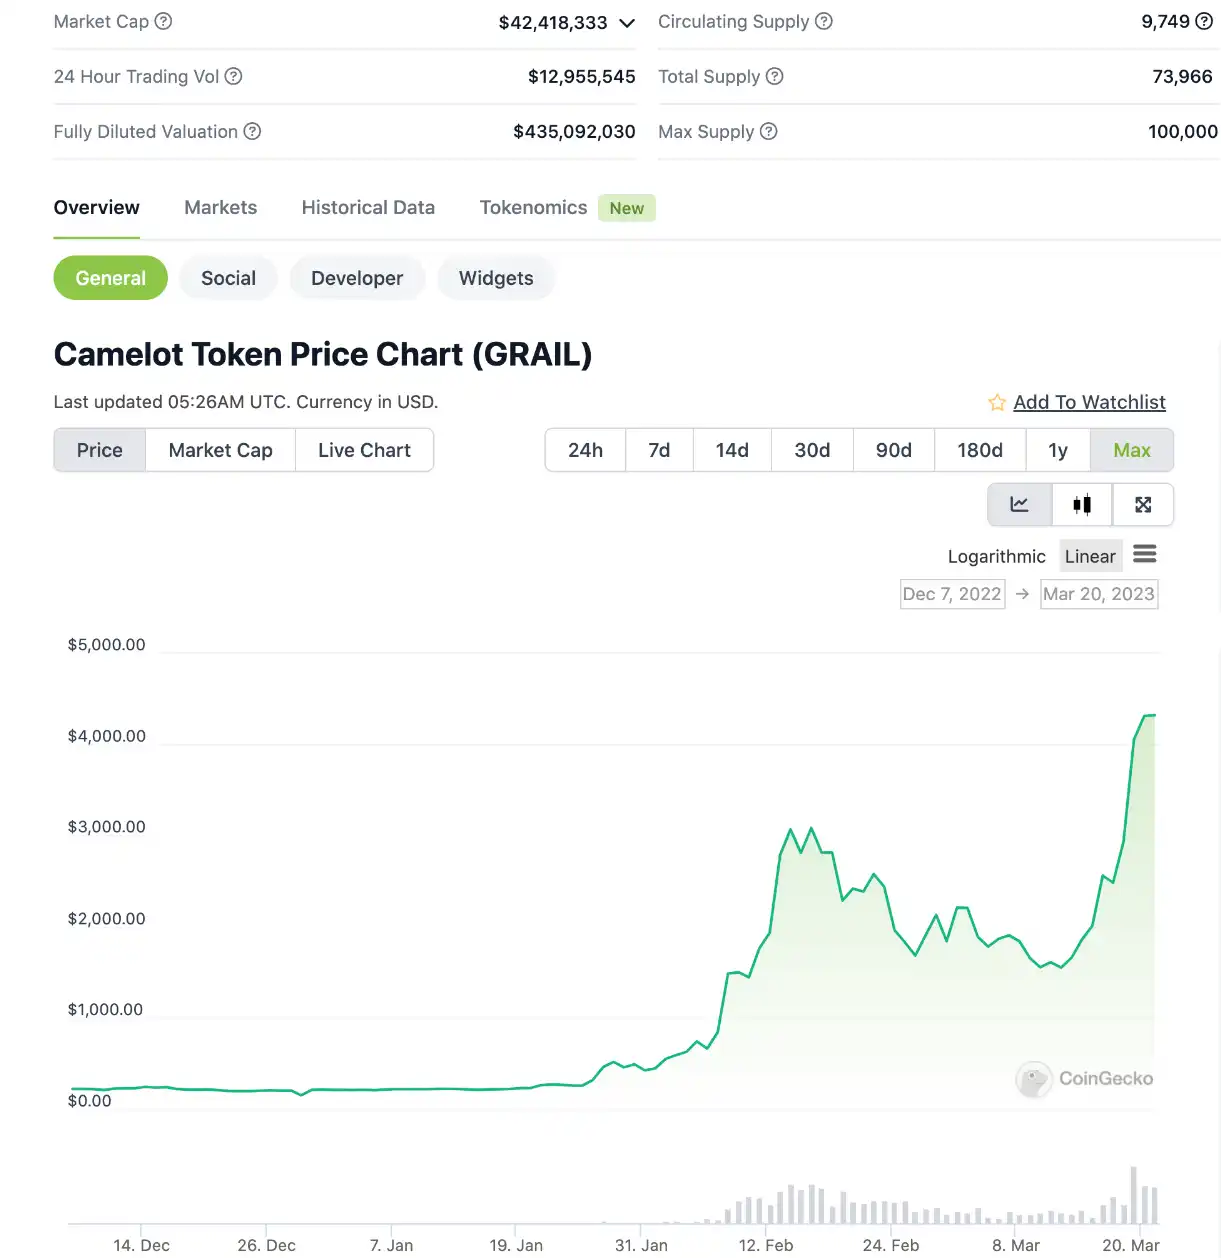
The same example applies to the DEX Camelot on ARB, where we find the valuation is also 430 million. Assuming ARB FDV is 10 billion and 20 billion, Camelot's DP would be 4.3% and 2.15%, respectively, also positioned in the upper half of the public chain ecosystem valuation Law Two, which is also cautious.
Once we have a valuation central system for ecosystem DEX, we can extend from DEX to other tracks in the public chain ecosystem, providing suitable references, just like having a weight that can measure most projects accurately.
Thus, we have summarized the valuation model of public chains and their ecosystems through the selection of some data, aiming to find more universal laws and seek the balance point of the pendulum. Of course, I believe that this can be extended from DEX to lending, contracts, NFTs, games, and various other tracks. I have not conducted further research on this, but I hope to inspire further exploration for those interested in modifying parameter models.