Dragonfly Capital: How to Measure the Performance of a Blockchain?

 Ethereum is the MS-DOS of smart contract operating systems. However, the current blockchain era has brought us into the Windows 95 era.
Original Authors: GM and Haseeb Qureshi, Dragonfly Capital
Original Title: 《The AMM Test: A No BS Look at L1 Performance》
Compiled by: DeFi之道
Multi-chain has now become a reality. The lack of scalability in Ethereum has led to a massive migration to the new generation of L1s. Most of these L1s use EVM (Ethereum Virtual Machine), which makes them compatible with Ethereum wallets and development tools.
However, Solana has completely rebuilt its stack from scratch. Solana claims to be the fastest blockchain in existence. So it raises the question: How much faster is Solana compared to EVM chains?
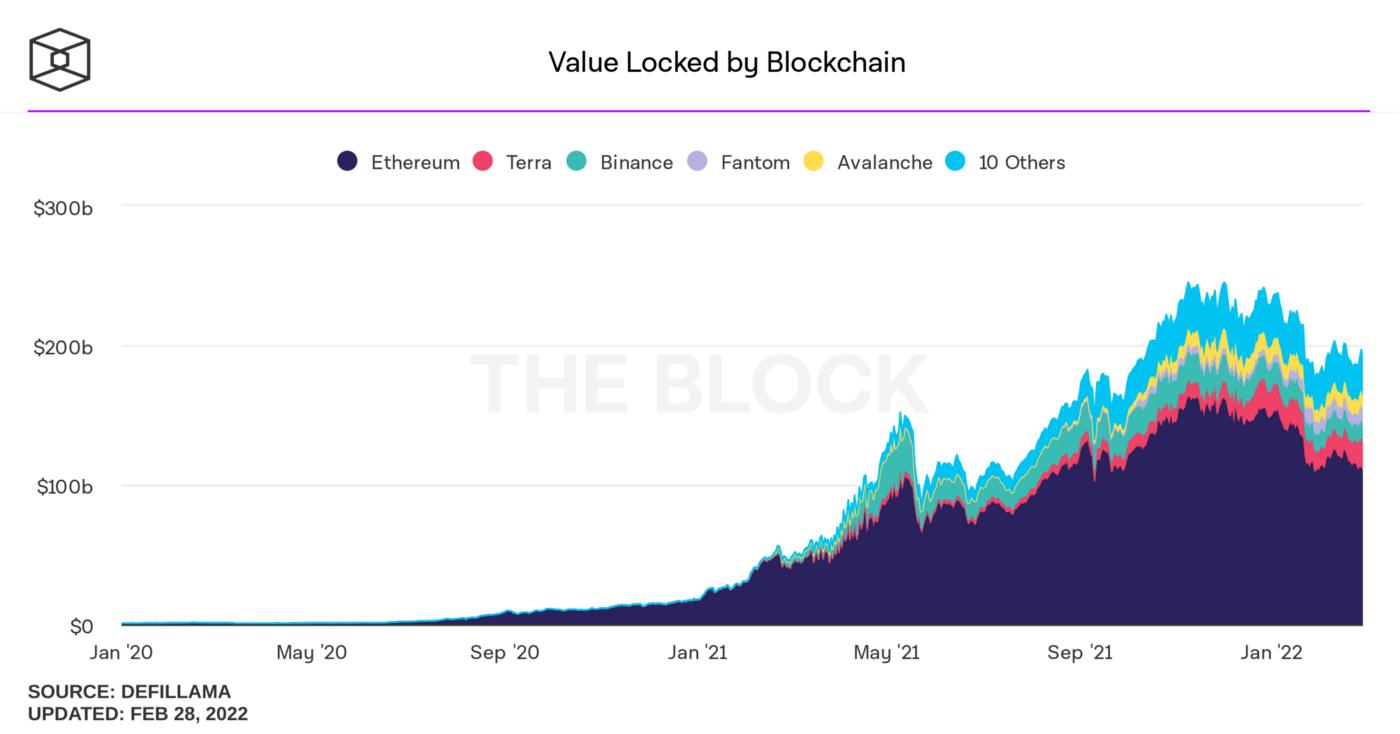
TVL growth of L1 blockchains, image source: The Block
First, we need to agree on how to measure performance. Since ancient times, new blockchains have claimed how much better their performance is compared to Ethereum. This is an old refrain. You will see a lot of numbers and hastily assembled charts comparing self-reported TPS (transactions per second). Unfortunately, these TPS numbers often come from their own marketing materials, which are mostly nonsense.
Most benchmarks published by L1s themselves measure the TPS of simple value transfers—i.e., transferring coins from one account to another. Simple transfers are very cheap, which leads to huge numbers that everyone loves. But in reality, no blockchain bottlenecks on such transfers, and this activity does not reflect real-world usage patterns.
Moreover, many of these numbers are generated on development or test networks, not on the mainnet. We don’t care what someone’s software can abstractly do: we care about what is possible on the current mainnet.
In fact, there is no unified method for benchmarking TPS. This is often the case in benchmarking. It is a chaotic and concerning area, filled with misleading marketing, overfitting/"teaching to the test," and cheating.
So, how should we actually measure L1 performance?
This is a tricky question because performance has multiple dimensions.
First, performance is always a compromise against decentralization. Highly centralized testnets and development networks can produce incredible numbers compared to the mainnet environment. Many mainnets cut corners on decentralization, squeezing out extra performance.
However, let’s assume we want to ignore decentralization and focus solely on performance. Well, it is well-known that benchmarking blockchain performance is very difficult because most new chains have poor data visibility.
For seven years, Ethereum's performance has been highly studied and well understood. But when you start exploring newer chains, most of their tools are much scarcer, visibility is poor, and they are still evolving. By the time you read this, these benchmarks may already be outdated.
Furthermore, benchmarking is always arbitrary and filled with pitfalls. The best you can do is choose a benchmark that measures something valuable and then determine your results as carefully as possible. That’s what we will try to do here.
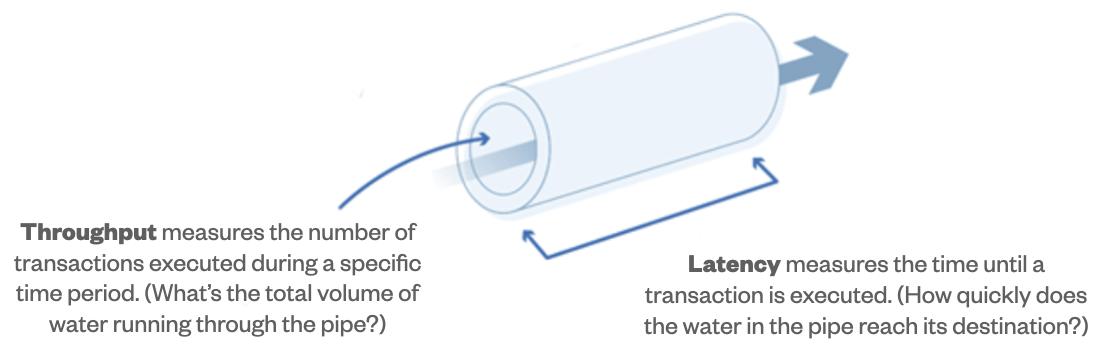
But what do we mean by performance? Performance has two aspects: throughput and latency.
You can visualize blockchain performance like water flowing through a pipe. Transactions are the water—you want a lot of transactions to flow through the pipe simultaneously. But the length of the pipe determines its latency—if a transaction takes a long time to get confirmed, even if many transactions can be confirmed at once, that is not ideal.
Latency can be broken down into block time (the time between blocks) and finality time (the time after which a block will definitely not be rolled back). Block time and finality time are easy to measure.
But to actually measure throughput, you need a standard unit of measurement. What is throughput?
Instead of using token transfers, we looked at one of the most gas-consuming products on Ethereum: Uniswap V2, and turned it into a very simple benchmark. If you filled an entire block with Uniswap V2 style trades, how many transactions could be settled per second?

We chose this benchmark because 1) it is simple and easy to measure, 2) every blockchain has a Uniswap V2 style AMM in production, and 3) it is a typical usage pattern for smart contracts.
For most blockchains with a gas model, this rough exercise should be straightforward. First, find the block gas limit and block time, derive the chain's gas/sec throughput; next, find a Uniswap V2 style AMM and select an equivalent SwapETHforTokens transaction; finally, divide the first number by the second number to get how many tx/sec it would achieve if its block were filled with the same AMM transactions.
Note: This is not a perfect benchmark! It is special, it does not account for parallel transactions (since trades on the same pool in Uniswap must be linearized), and it cannot represent every usage pattern. But the usage of smart contracts is always power-law distributed, and the most commonly used Dapps tend to be AMMs, so in a set of benchmarks, we think this helps provide a comprehensive understanding of performance.
So, without further ado, let’s look down the list.
Uniswap v2 Transactions per Second: Average 9.19, Maximum 18.38 (due to EIP-1559)
Average Block Time: 13.2 seconds (PoW, so blocks are mined randomly in a Poisson process)
Finality Time: 66 seconds (approximately, ETH blocks are not truly finalized)
Assumptions and Method: At a target of 15 million gas, Ethereum can achieve 9.19 transactions per second when it balances with EIP-1559; at a gas limit of 30 million, it can achieve 18.38 transactions per second (but if kept here, fees will increase exponentially). We use this swapExactETHForTokens transaction as a representative on-chain hop transaction. Assuming block producers can perfectly fill a 15 million gas limit block with Uniswap trades, each transaction costs 123,658 gas, which means we can fit 15M/123,658 = ~121.3 swaps into a block. If we assume blocks arrive every 13.2 seconds, that means Ethereum processes ~121.3/13.2s = ~9.19 Uniswap v2 swaps per second.
We will use similar calculations for other EVM chains on the list.
(Note: We ignore rollups in this method since all smart contract L1s can add rollups.)

Ubeswap Transactions per Second: Average 24.93, Maximum 49.86 (due to EIP-1559)
Average Block Time: 5 seconds
Finality Time: 5 seconds (Celo uses a PBFT-style protocol that can finalize blocks immediately)
Assumptions: This swap transaction is representative, with a 10 million gas target and a 20 million gas limit.

Quickswap Transactions per Second: Average 47.67, Maximum 95.33 (due to EIP-1559)
Average Block Time: 2.5 seconds
Finality Time: Polygon has two concepts of finality
Probabilistic: This is similar to most Ethereum-style blockchains, where the canonical chain depends on the most work done (the heaviest chain). In the case of Polygon, the finality of the Bor layer (i.e., the block producer layer) depends on a more difficult fork.
Provable: This is similar to Tendermint/IBFT, with an absolute majority of signatures on the canonical chain. This happens through checkpoints on the Heimdall layer (Polygon's validator management and state synchronization layer). These checkpoints are submitted to Ethereum.
Reorganizations and forks can occur on the Bor layer but cannot occur on Heimdall. Checkpoints are snapshots of the Bor chain state. Once a block is included in a submitted checkpoint, it cannot be reorganized (unless >=1/3 of the validator set is dishonest). Checkpoints are submitted approximately every 25 minutes.
Assumptions: This swap transaction is representative, with a 15 million gas target and a 30 million gas limit.
Trader Joe Transactions per Second: Average 31.65, but due to its elastic block time, the Avalanche C chain can handle enough gas to achieve 175.68 transactions per second at maximum throughput. However, maintaining throughput at that level would lead to exponentially increasing fees.
Average Block Time: Average 2 seconds (Avalanche is a leaderless protocol with elastic block times: blocks can be produced at any time as long as sufficient minimum fees are paid. The Avalanche C chain has had periods where more than 10 blocks were produced in under 1 second.)
Finality Time: Approximately 1.75 seconds after block production
Assumptions: This swap transaction is representative, with a current 8 million gas limit.
Avalanche is relatively difficult to compare because its block production mechanism is so different from Ethereum and PoS chains. For Avalanche, there is a significant difference between operations executed at maximum throughput versus those executed at average throughput. (The average throughput of chains like Ethereum that have already implemented EIP-1559 is twice its average throughput.)
PancakeSwap Transactions per Second: 194.60 (Binance Smart Chain does not use EIP-1559, so this is a fixed number)
Average Block Time: 3 seconds
Finality Time: 75 seconds
Assumptions: This swap transaction is representative, with an 80 million gas limit.
This concludes the benchmarking of EVM blockchains—blockchains whose virtual machines are modeled after Ethereum. Since all EVM chains use the same gas model, we can consider gas/sec as a benchmark for throughput. Solid bars represent target throughput, while hollow bars represent limits.
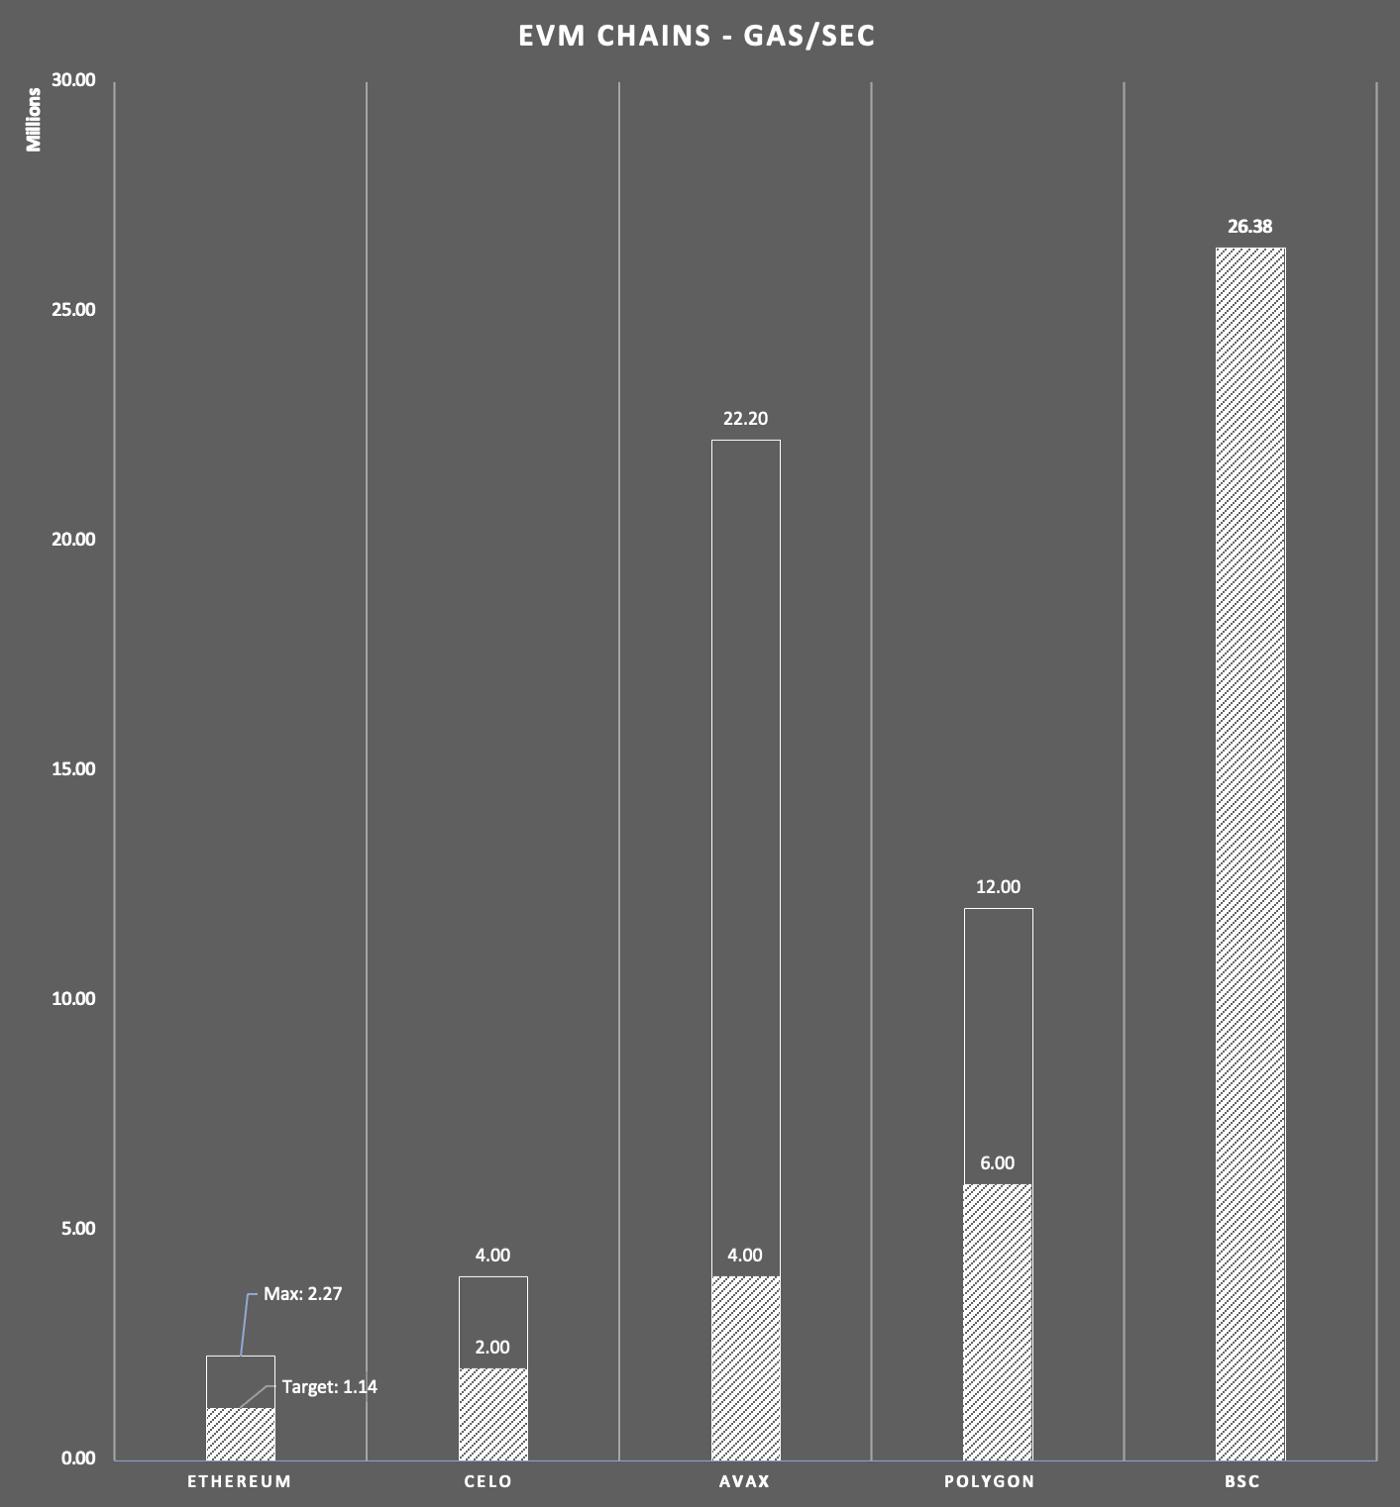
Gas/sec of EVM chains
You can imagine running EVM at absolute limits, which is what happens with Binance Smart Chain (BSC) (now renamed BNB Chain). If you want higher performance from smart contracts, you will have to completely move away from EVM.

Orca Transactions per Second: 273.34
Block Time: 590 milliseconds
Finality Time: 13 seconds (Solana also issues faster "optimistic confirmations," but these can only withstand about 4.7% of damage. Most Dapps accept this threshold.)
This is how we calculated this number. It is a clumsy method.
We first wanted to find an equivalent "gas limit" for Solana. You cannot find any such number on the block explorer. We first asked some Solana developers we know, but it seems no one knew exactly if such a limit exists. So we rolled up our sleeves and set out to investigate.
We first learned that Solana does have something similar to gas, called compute units (CUs). From our conversations with validators, most seem to think that Solana validation is "packing as many transactions as possible within block time," but the actual limit is that each block can only contain 48 million CUs.
Secondly, only a limited number of CUs can be written to a single account in a single block. This limit is to prevent too many transactions from writing to the same account, thereby reducing the parallelism of a block—though this is exactly what happens during massive congestion, such as during popular IDOs when all transactions compete to use a single contract.
The limit per account is 12 million. If you follow this 12 million account CU limit, the 590 milliseconds block time on the mainnet, and the 74,408 CU cost per Orca swap, we derive a theoretical limit of 273.34 swaps/second.
This number seems lower than expected! To convince ourselves of this number, we wanted to empirically validate this method.
To confirm that we measured its performance correctly, we decided to directly spam test Solana. For obvious reasons, we did not want to spam the mainnet, so we targeted the Solana development network.
Note that Solana's development network runs on smaller clusters, so it has faster block times than the mainnet (380 milliseconds versus 590 milliseconds), which will improve its performance compared to the mainnet. Given the 380 milliseconds block time, we should expect the development network to settle 424.40 swaps per second.
We spammed the Orca SOL-ORCA trading pair on the development network to see how many Orca swaps we could perform in a single block, then inferred the maximum throughput.

In development network block height 106784857, we managed to achieve 184 Orca swaps
The highest number we managed to achieve was 184 swaps in a single block. Assuming a block time of 380 milliseconds, this gives us 484.21 swaps/second on the development network. (Note that the block time is not accurate, so there is some deviation in these numbers. If you average the three blocks where we achieved the most transactions, it looks more like 381 swaps per second, which seems more reasonable).
This seems to confirm that our analytical method is correct (about a 10-15% increment), which means Solana's mainnet might execute about 273 swaps/second on AMMs.
Of course, this is just a test run, so here is our code—we encourage you to use it and share your results with us.
We have covered a lot of details here, and none of this would have been possible without the help of our friends at Blockdaemon. If you want to know the details required to do this (and get a deeper understanding of Solana's internals), check out Part 2, where we will cover the technical details.
You might see all this and wonder: But I thought Solana could generally achieve 3000 TPS?
The way block explorers measure Solana's TPS can be misleading—it treats internal consensus messages as transactions, which other blockchains do not have.
About 80% of Solana's throughput consists of consensus messages. Subtracting those, you are left with about 600 TPS, most of which are very cheap Serum transactions. As long as enough other contracts are touched, Solana can also achieve higher performance in production.
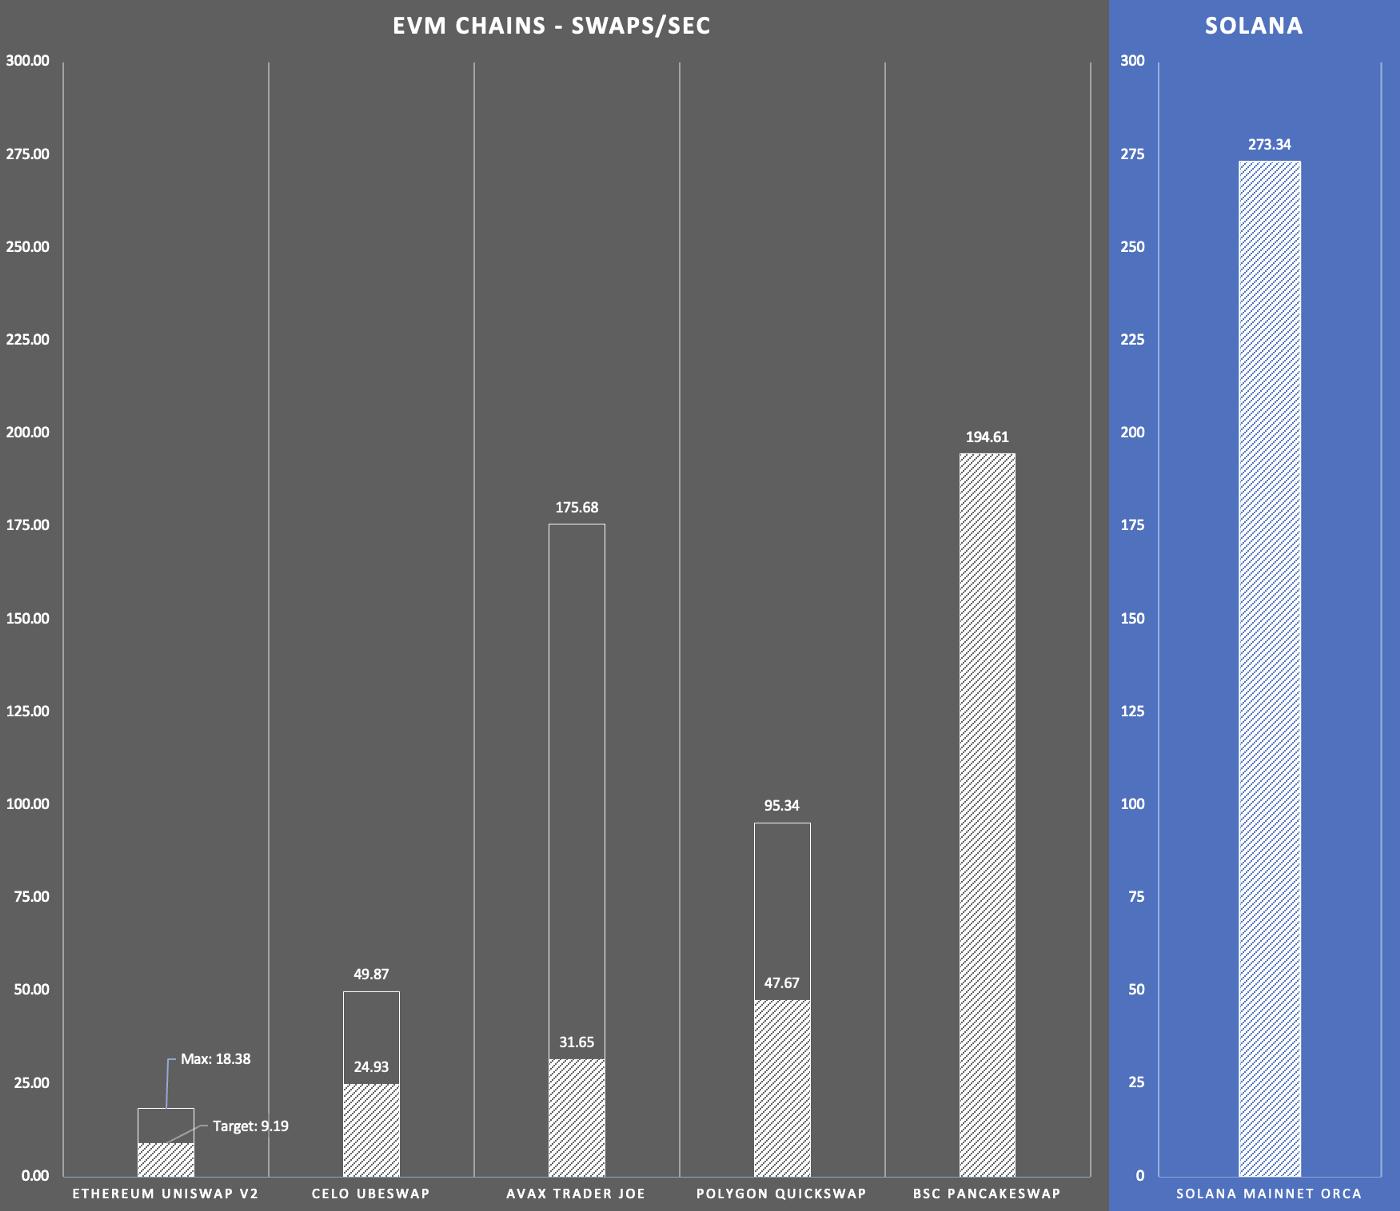
AMM Test: Uniswap v2 style swaps/second performance
So what are the takeaways from all this?
First, don’t take this as gospel. Do the math yourself.
Second, remember that all these blockchains are moving targets. They are constantly being optimized, and the technology is evolving rapidly, while any benchmark is a snapshot in time. We hope to see more independent organizations create standardized benchmarks, but this is our best attempt.
Third, note that the performance differences between these blockchains are not as great as advertised. The performance difference between Ethereum and the best chains is about 10-25 times, not 100 times or 1000 times. No one can achieve such outstanding performance from linearized VM transactions. That will require more work and optimization.
Fourth, if you want truly high performance, you must abandon EVM. We only benchmarked Solana here, but there are other non-EVM L1s, such as NEAR and Terra, that also achieve higher performance.
But like Solana, they cannot benefit from the tools and ecosystem built around EVM. (Although NEAR has an EVM-compatible Aurora shard, and other L1s are trying to develop similar virtualized EVM instances.)
Fifth, users are currently not as sensitive to performance considerations of non-Ethereum L1s. They care more about the overall strength of the ecosystem, good user experience, and low fees. These blockchains are not currently competing on performance because they are not actually being used to capacity, except during rare peak periods, such as during IDOs or market crashes.
We expect the performance of all major L1s to improve over time as development teams spend more time tuning performance for typical usage patterns. It is no surprise that in the early days, none of these blockchains were well optimized!
But overall, my impression is that Ethereum is the MS-DOS of smart contract operating systems. However, the current blockchain era has brought us into the Windows 95 era.
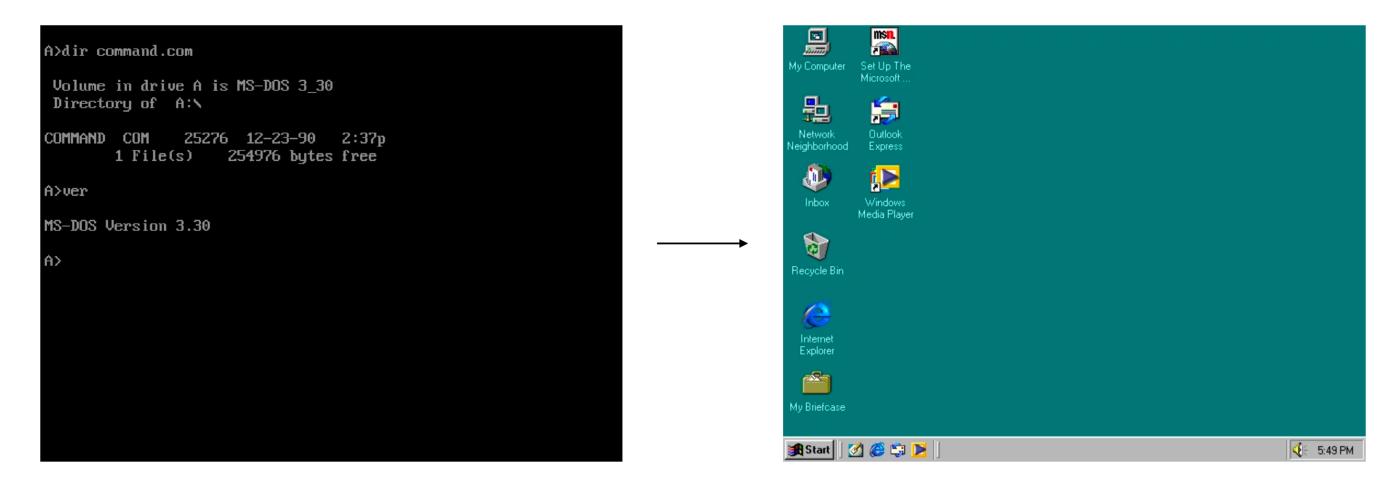
MS-DOS (left) to Windows 95 (right)
The next generation of blockchains represents a significant advancement, but there is still a long way to go for mainstream adoption.
 Risk warning
 Risk warning


Popular articles