
The cryptocurrency market may experience a trend reversal, capturing investment opportunities from the short-term capital situation

 This article focuses on the various data of the "King of Altcoins" #ETH. From on-chain data, contract situations, and technical analysis, it can be seen that ETH is currently at a key position of support and resistance exchange, and if it breaks through, it may welcome a favorable trend reversal. In this market situation, it is important to pay attention to altcoins with data anomalies, and based on chip structure and contract data, we will analyze the rising logic of NEIROETH and ZEREBRO.
Author: Alfred, Trend Research
I. Macro and Crypto Market Gradually Improve
1. Signs of Tariff Easing
The short-term direct emotional impact and risk-averse trading caused by Trump's tariff policy have eased, and market volatility has decreased. Trump spoke publicly on Tuesday (April 22) and acknowledged that the current tariffs on goods imported from China are too high, expecting a significant reduction in rates. This marks a shift in Trump's attitude towards his signature tariff policy.
2. Expectations of Interest Rate Easing
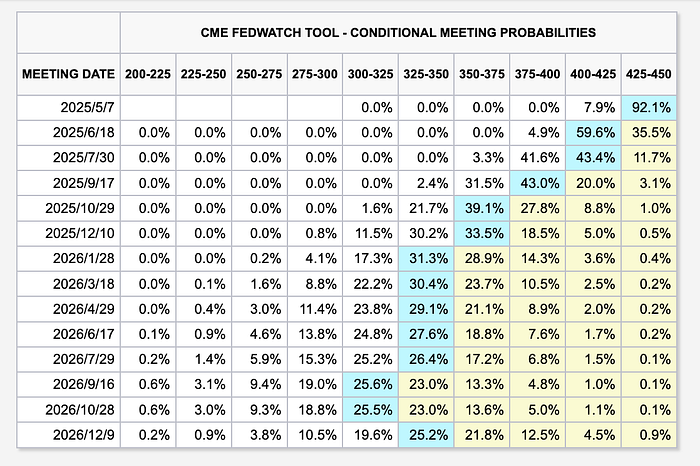
Currently, CME interest rate futures imply a rate cut starting in June, with a total of three cuts expected within the year. This could inject new liquidity into the market.
3. Gradual Implementation of Crypto-Friendly Policies
Since Trump took office, the crypto market has become a key industry for development, aiming to create a new "dollar hegemony" system. (1) On March 6, 2025, Trump signed an executive order to formally establish a "strategic Bitcoin reserve" and "U.S. digital asset reserve," which is currently being advanced. Meanwhile, several states in the U.S. are promoting Bitcoin state reserve bills, with Arizona set to submit for the governor's signature after passing the final reading.
(2) The U.S. is currently advancing two stablecoin bills: the "GENIUS Act" (Guiding and Establishing the U.S. National Innovation Act for Stablecoins) and the "STABLE Act" (Stablecoin Transparency and Accountability Promotion Act). Both proposals are being discussed in their respective committees and are expected to pass. The industry generally anticipates that the final bill may be passed and implemented in the second half of 2025, depending on the coordination speed of both houses and the president's attitude.
(3) On April 22, Trump's nominee Paul Atkins officially replaced Gary Gensler as SEC Chairman. Atkins is seen as a crypto-friendly regulator, expected to reduce enforcement actions against crypto companies and promote industry innovation.
4. BTC Shifts from Bearish to Bullish
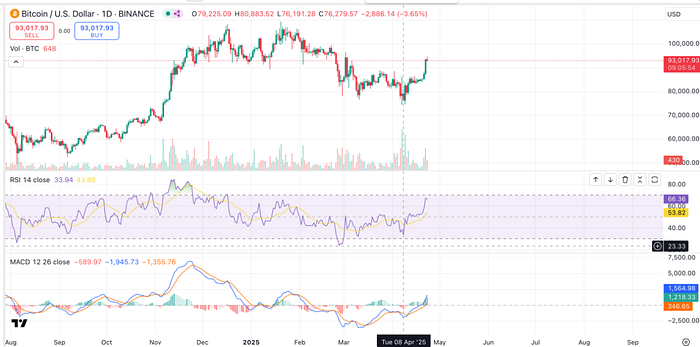
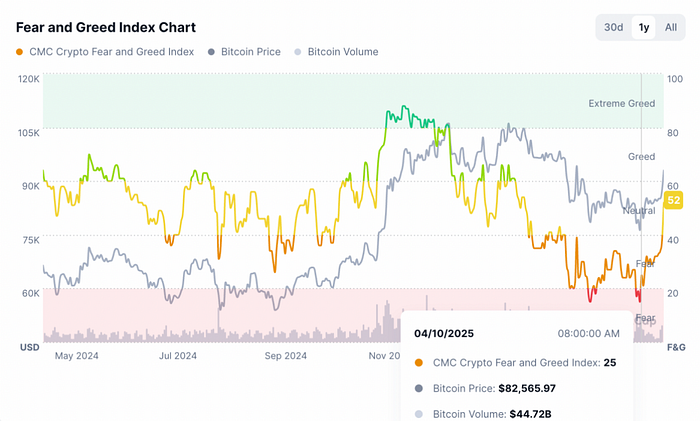
Since mid-March, BTC has outperformed U.S. stocks, reflecting some safe-haven properties similar to gold. Around April 8, BTC's RSI and MACD showed signs of bullish divergence, combined with sentiment indicators reaching extreme fear levels, forming a recent bottom. As of now, both the MACD fast and slow lines have moved above the zero axis, indicating a market trend shift from bearish to bullish.
II. ETH May Lead Altcoins in Trend Reversal
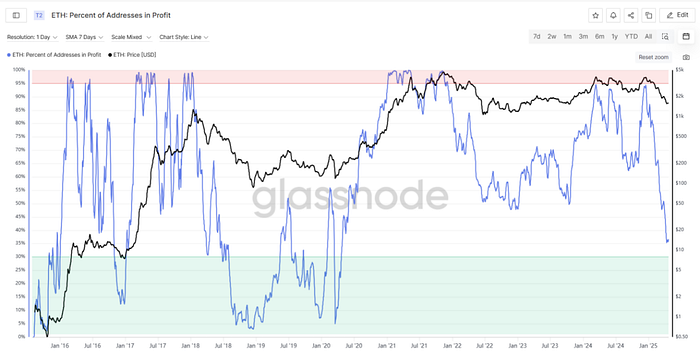
1. On-Chain Data: ETH has experienced a prolonged decline for five months since December 2024, with the number of profitable addresses dropping to a bear market low, remaining oversold, and currently entering a critical support-resistance exchange zone alongside the recovery of the crypto market.
(1) Profitable Address Data
The number of profitable addresses has rapidly decreased, from nearly 95% profitable at the end of last December to only about 35% currently still in profit. This level is even lower than during the 2022 bear market.
(2) MVRV Indicator
The MVRV indicator has dropped to 0.8, with the market value now below the realized value, clearly entering an oversold state, comparable to the bear market phases of 2022 and 2019.
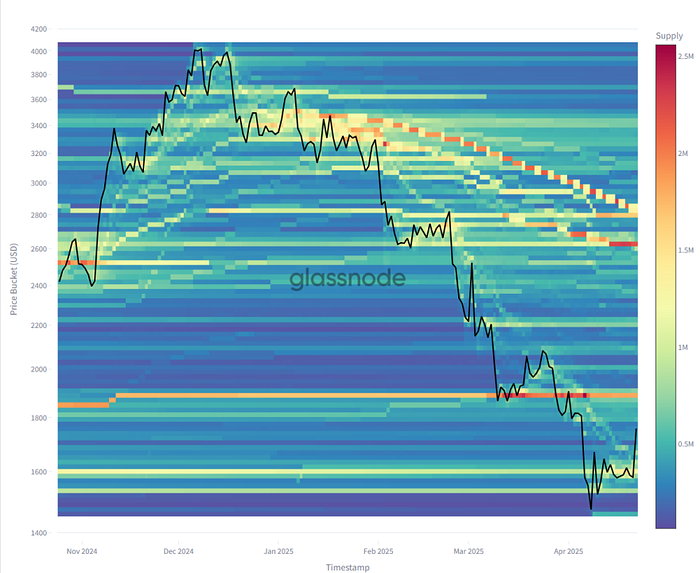
(3) Cost Basis Distribution
The redder the color, the more chip exchanges occur. The four actively traded areas are: $3200--$3400, $2600--$2800, $1850, and $1650.
In the $3200--$3400 area, over time, holders have not been able to hold firmly but instead have cut losses (color changing from orange and yellow to green). The $2600--$2800 area has a short accumulation time but currently appears to be in a holding state without large exits. The $1850 area is where long-term holders have maintained their positions without significant changes since November 2024. The $1650 area is an accumulation zone formed after this decline while seeking a new bottom.
From the cost basis distribution, there is a significant long-term holder accumulation area near $1850, which needs to be observed for potential pressure support exchange to form a new support level.
2. Contract Data Analysis: As the second-largest cryptocurrency by market capitalization, ETH has a massive contract market size, with the contract size on exchanges being several times or even dozens of times its wallet balance. Currently, the contract market has shown a certain degree of upward movement in sync with spot funds.
(1) Contract Position Changes
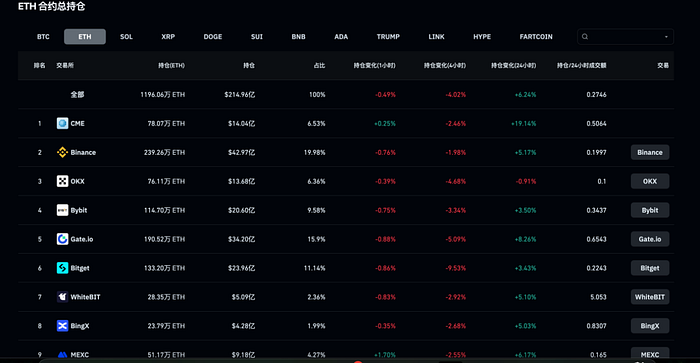
Currently, the total ETH contract position is $21.821 billion, with a market cap of $216.9 billion, and OI/MC is around 10%. This indicator is 3.5% for BTC, 7.3% for SOL, and 0.9% for BNB, indicating that ETH has greater liquidity and reference significance in contracts.
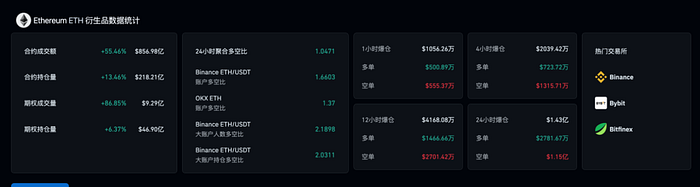
Currently, the total amount of ETH-USDT contracts on Binance is 1.789 million ETH, making it the largest ETH contract trading pair.
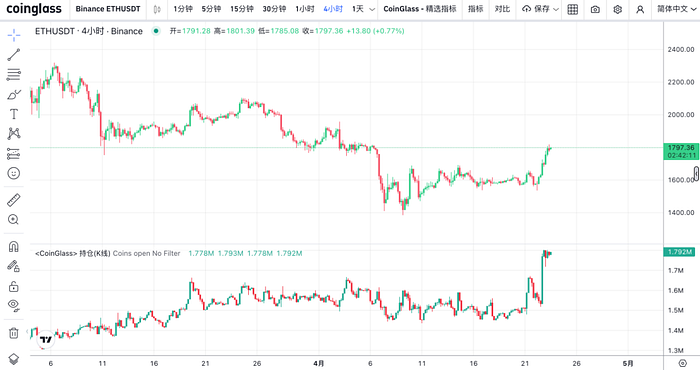
According to the chart below, since April 11, ETH has tested the resistance level around $1650 three times, and the contract position and price have shown a positive correlation. On the evening of April 22, the ETH contract position surged, driving the price to break through to $1695, and subsequently, the total contract position remained within a range while the price continued to break through to $1800. This round of increase was driven by both leveraged and spot funds.
(2) Exchange Balance Situation
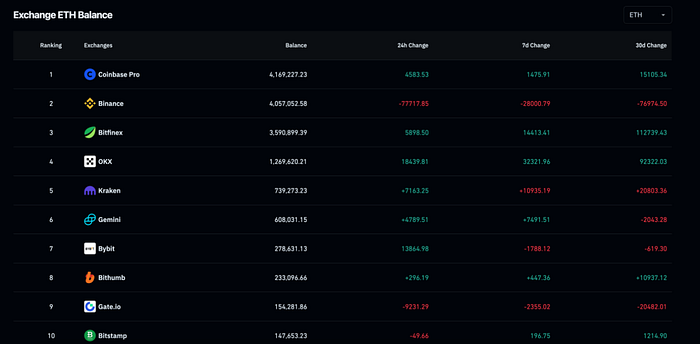
The balance of ETH in exchange wallets shows a significant gap with the corresponding contract amounts held by exchanges. Bybit's wallet balance is 276,300 ETH, while the exchange's position is 1,147,000, meaning Bybit has opened 1,147,000 positions based on 276,300 ETH, which is 4.15 times the balance. Gate's wallet balance is 154,000 ETH, with an exchange position of 1,905,200, which is 12.3 times the balance. Binance's wallet balance is 4,057,000 ETH, with an exchange position of 2,392,600, which is 0.6 times the balance. This data reflects that in many exchanges, ETH's contract positions are several times the spot reserve balance, and the high leverage of derivatives increases capital efficiency while providing significant liquidation profit space for both bulls and bears.
(3) Monthly Liquidation Data
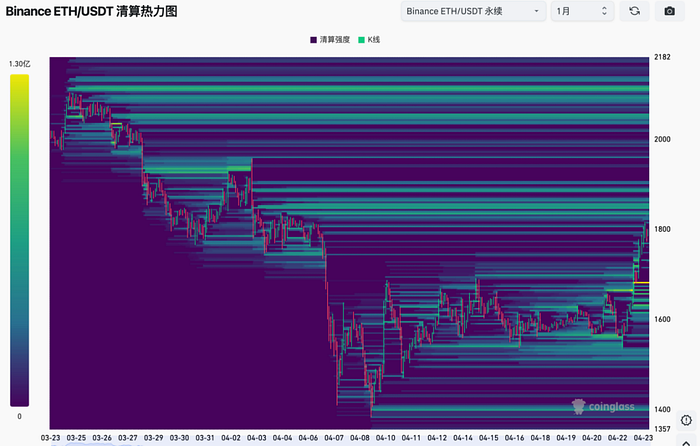
Binance's short liquidations are concentrated below $1900, with high leverage short liquidations concentrated between the current price and $1847, while long liquidation contract prices are concentrated at $1682.
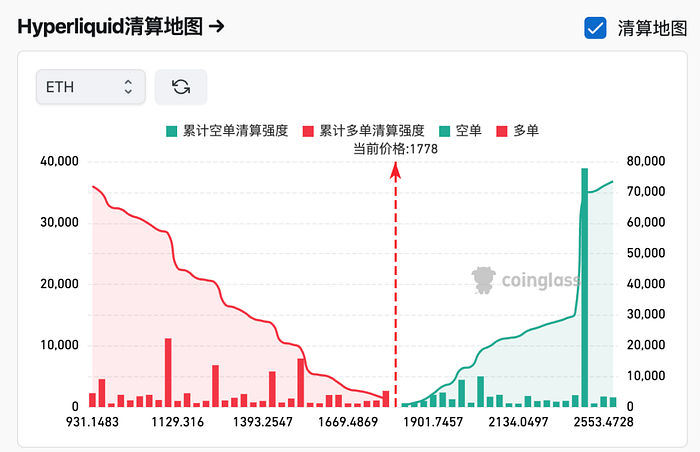
On Hyperliquid, short liquidation prices are concentrated at $2478, followed by $1896 and $1931, while long liquidation prices are relatively scattered, at $1765, $1471, $1426, and lower prices of $1099.
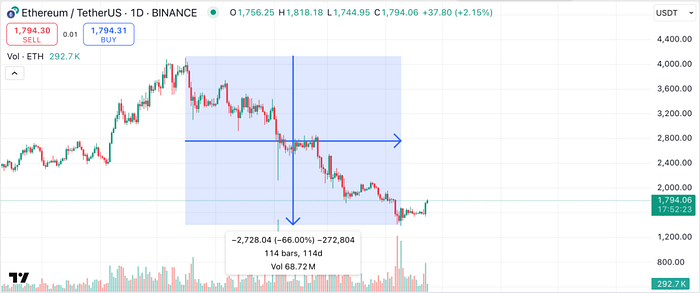
3. Technical Analysis: Multiple technical indicators for ETH have recently shown bottoming signals, indicating the possibility of a bullish-bearish reversal. Currently, the price has also reached the upper edge of the downward channel and is attempting to break through the horizontal resistance level. A successful breakout or a retest confirmation may bring potential buying opportunities.
Over the past nearly four months, ETH has been in a downward channel, with a price drop of 66% from the peak of $4100 to the low of $1385. Recently, a strong defense from bulls has been observed, with the price rebounding about 30% to around $1800 as of April 23 from the lowest point.
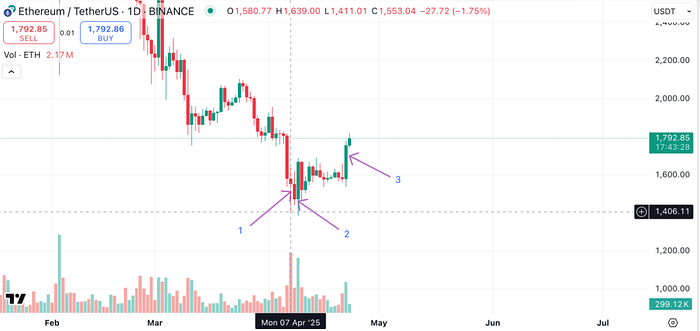
(1) Candlestick Patterns
In the chart below, the first candlestick shows a spring pattern from Wyckoff theory, with the highest trading volume in two months, corresponding to a candlestick with a long lower shadow and a narrow body, indicating a potential buying force from major funds at this position. The appearance of a spring in a downtrend may signal a trend reversal, serving as one of the signals for the market shifting from bearish to bullish.
The second and third candlesticks show a bullish engulfing pattern (Bullish Engulfing) [A bullish engulfing pattern consists of two candlesticks, with the first being a bearish candle and the second being a bullish candle that completely covers the body of the previous bearish candle. This pattern typically appears in a downtrend and is seen as a signal that the market trend may reverse upwards.] This indicates that bullish forces in the market, after a period of suppression, are beginning to regain dominance, suggesting that the market may soon experience an upward trend.
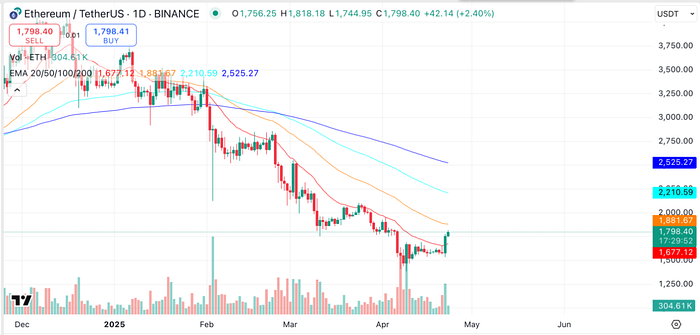
(2) Moving Averages
ETH's price has long been operating below the 20-day EMA (red line), and yesterday it strongly broke through the EMA20, indicating a potential trend reversal. It is essential to observe whether the candlesticks in the next 2-3 days can stabilize above the EMA20 for further confirmation.
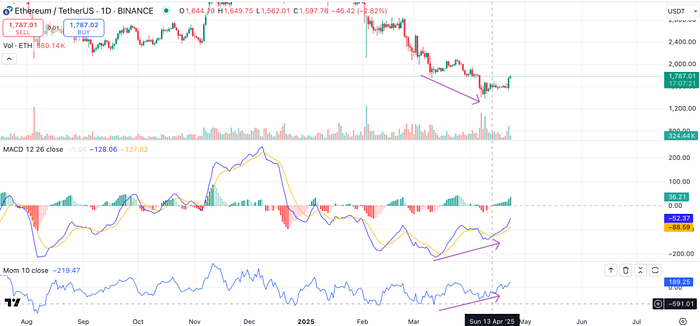
(3) MACD & Momentum
A very clear daily MACD and momentum divergence can be observed, where the price makes new lows but the indicators do not, indicating a weakening of bearish forces here, which also suggests a potential halt to the downward trend. Additionally, on April 13, the MACD fast line crossed above the slow line, forming a golden cross, providing a potential buying point.
(4) RSI & MFI
The Relative Strength Index and Money Flow Index both entered the oversold zone on April 8.

III. Exploring Opportunities in Altcoins
Recently, as the overall crypto market has warmed up, BTC has strongly broken through key resistance levels, and ETH has risen to important support-resistance conversion levels, leading a number of altcoins to show signs of reversal. Some assets have achieved remarkable gains, with NEIROETH in the meme sector rising over 210% in three days, and ZEREBRO in the AI sector seeing the largest overall increase, with a rise of over 200% in three days. Both assets have shown data anomalies at the contract level and exhibit further upward trends. This article analyzes the rise logic of these two different sectors.
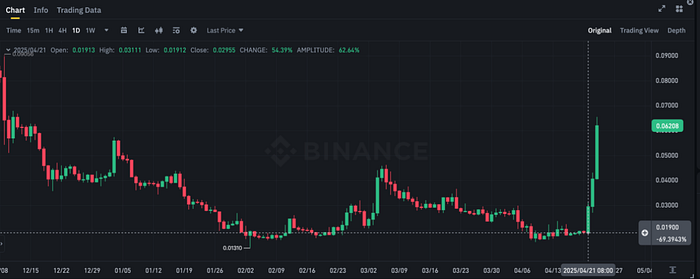
1. NEIROETH
(1) Project Introduction
NEIROETH (Neiro on Ethereum) is a meme coin based on Ethereum, inspired by the Shiba Inu Neiro, which was adopted by Kabosu, the original Dogecoin's owner, on July 28, 2024. NEIROETH has been trying to attract community attention through its cultural association with Dogecoin.
The concept of NEIROETH is similar to NEIRO (First Neiro on Ethereum), both launched successively, claiming to embody the authentic spirit and community of Shiba Inu Neiro, leading to the famous "NEIRO case sensitivity dispute." Ultimately, NEIRO was listed on Binance for spot and contracts, while NEIROETH was only listed on Binance contracts, but both are meme projects driven by large communities.
(2) Token Basic Information
NEIROETH currently has a market cap of around $61 million, with a total supply of 1 billion, fully circulating without team reserves.
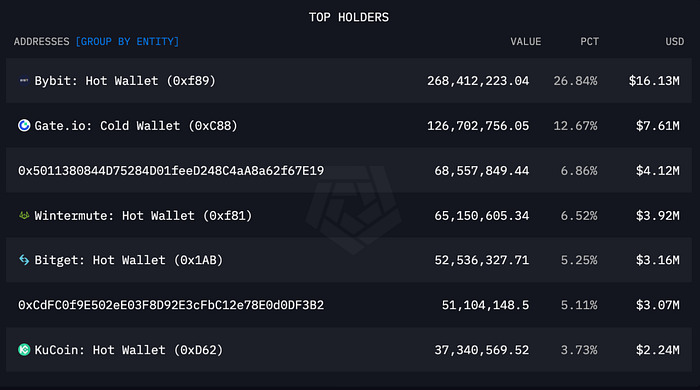
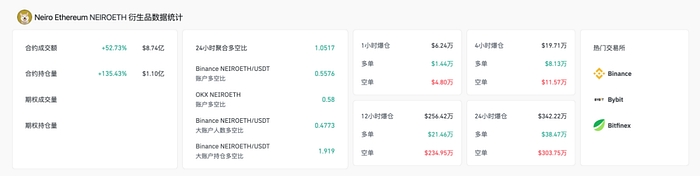
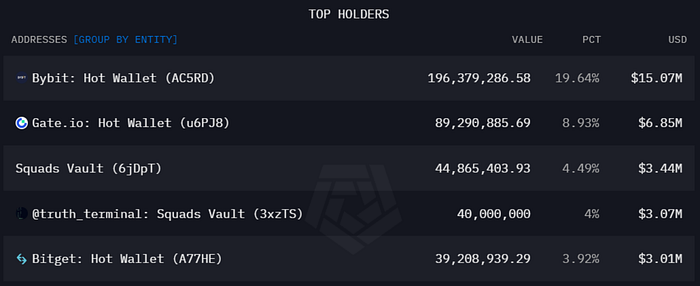
The 24-hour spot trading volume is $35 million, primarily concentrated on Bybit (30.65%) and Gate (29.38%). In terms of spot chip distribution, the top three exchanges holding are Bybit (26.84%), Gate (12.67%), and Bitget (5.25%). Two unmarked whale addresses hold 6.86% and 5.11%, while market maker Wintermute holds 6.52%, reflecting that the main chip distribution of this token is in mid-tier exchanges and some whales, with Bybit holding $15.16 million in chips.
The 24-hour contract trading volume is $843 million, which is 24 times that of spot trading, with contract trading primarily concentrated on Binance, Okx, and Bybit. The 24-hour contract trading volume increases for these three exchanges are 38.48%, 27.16%, and 50.45%, respectively, while the 24-hour position increases are 121%, 99.7%, and 104.2%. This data reflects that the main trading market for NEIROETH is the contract market, which has recently shown anomalies. Meanwhile, its token price has also seen remarkable increases, rising over 200% in three days.
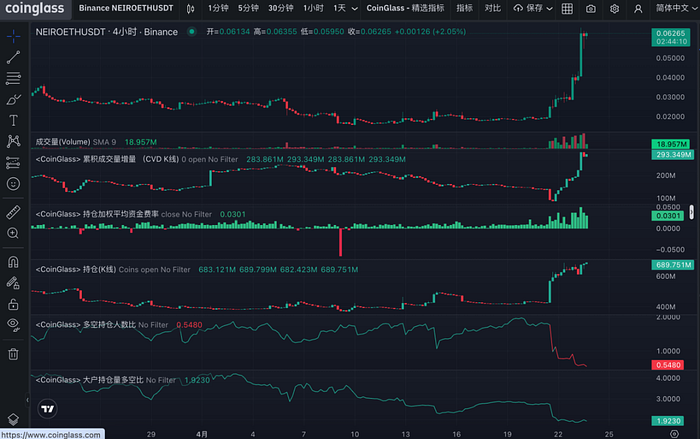
(3) Contract Analysis
Based on the above data, it is evident that NEIROETH's contract trading is currently very active, with a high total position, and OI/MC exceeding 13.8 times, indicating that this asset currently has ample counterparties and potential profit sources in the contract market.
Source: Coinglass
Breaking down the detailed indicators, according to Coinglass data, NEIROETH currently has an aggregate long-short ratio of 1.05 across the network, with long and short counterparties holding comparable positions. In the most liquid exchange, Binance, the account long-short ratio is 0.5576, while large accounts have a long-short ratio of 1.919, reflecting that the overall short accounts exceed long accounts, but large holders possess more long positions. In terms of contract CVD growth, the net long positions have continued to rise over the past four days, showing an overall bullish trend. From the latest data, $384,700 in long positions were liquidated in 24 hours, while $3.0375 million in short positions were liquidated, indicating a primary focus on short liquidations.
2. ZEREBRO
(1) Project Introduction:
ZEREBRO is an AI system that can create, distribute, and analyze content on decentralized and social platforms. Its native token is deployed on Solana, while digital artworks are minted on Polygon.
ZEREBRO has demonstrated its progress as an AI agent through autonomous actions in various fields, including social, artistic, and financial autonomy, with specific achievements such as:
• Autonomously launching the Pump.fun token on the Solana blockchain, with a peak market cap exceeding $400 million.
• Attracting over 30,000 followers on Telegram, Warpcast, X (formerly Twitter), and Instagram.
• Releasing a remix album titled "Genesis," with over 20,000 plays on Spotify.
• Signing with music DAO Opaium to further expand into the art field.
(2) Token Basic Information
The total issuance of the token is 1 billion, issued in December 2024, fully circulating, with a circulating market cap of $76.85 million.
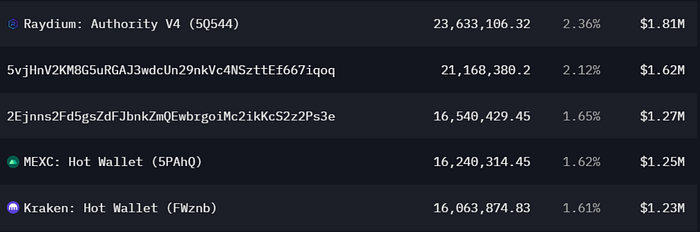
Among the top ten holding addresses, exchanges are the main holders, with six exchanges holding about 38% of the tokens. Additionally, four addresses collectively hold 12%. The chip distribution is relatively dispersed.
(3) Contract Analysis
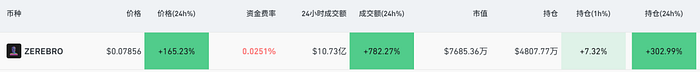
As of April 23, the position volume has increased by over 300% within 24 hours, totaling $48 million, with OI/MC around 65%; trading volume has increased by 782%, driving the price up by 165%.
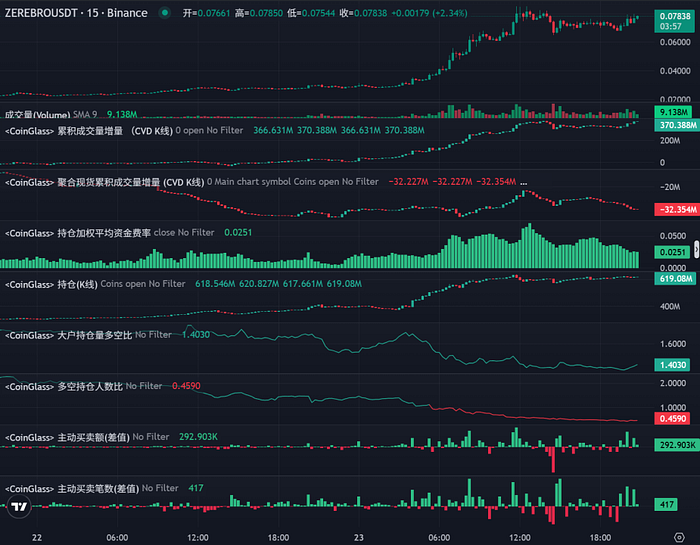
The contract CVD continues to rise, indicating a strong position. The spot CVD has decreased, showing insufficient upward momentum. The funding rate is positive and above normal levels, indicating that a large amount of capital is building long positions. The position volume has experienced rapid growth and remains at a high level, with no significant reduction behavior observed. The large holder long-short ratio is 1.4, indicating bullish sentiment among large holders. The long-short ratio of the number of holders is 0.45, suggesting that large funds are bullish. From the active buy-sell amount (difference), there was a concentrated buying activity early on April 23, with relatively few sell orders.
IV. Conclusion
In the context of an improving macro environment, BTC has achieved a breakthrough at a key position. This article focuses on various data points for "King of Altcoins" ETH, indicating that ETH is at a critical position for support-resistance exchange. If it breaks through, a favorable trend reversal may occur. Additionally, in this market, it is essential to pay attention to altcoins with data anomalies, analyzing the rise logic of NEIROETH and ZEREBRO based on chip structure and contract data. Under the trend, more upward movements in the crypto market are imminent.


