
After the violent correction in the first quarter, will BTC replicate the trend of 2017?

 This article will evaluate the correlation between the current Bitcoin price trend and historical bull market cycles through data analysis, and look ahead to the potential development paths for BTC in the future.
Author: Bitcoin Magazine Pro Team
Compiled by: BitpushNews
After breaking the $100,000 mark and setting a historical high, Bitcoin has entered a sustained downtrend. This price correction has naturally raised questions in the market about whether Bitcoin still follows the cyclical patterns of 2017. This article will analyze data to assess the current Bitcoin price trend's correlation with historical bull market cycles and explore potential future developments for BTC.
Is it replicating the 2017 trend?
Since the low point of the 2022 bear market cycle, Bitcoin's price trajectory has shown remarkable similarity to the 2015-2017 cycle (which ultimately reached a historic bull market peak of $20,000 in December 2017).
However, the recent downtrend in Bitcoin marks a significant divergence from the 2017 cycle—if it strictly followed the 2017 pattern, the past month should have been a period of rising prices for Bitcoin to set new highs, but the actual market has shown sideways consolidation and a downward trend, suggesting that the correlation between the two cycles may be weakening.
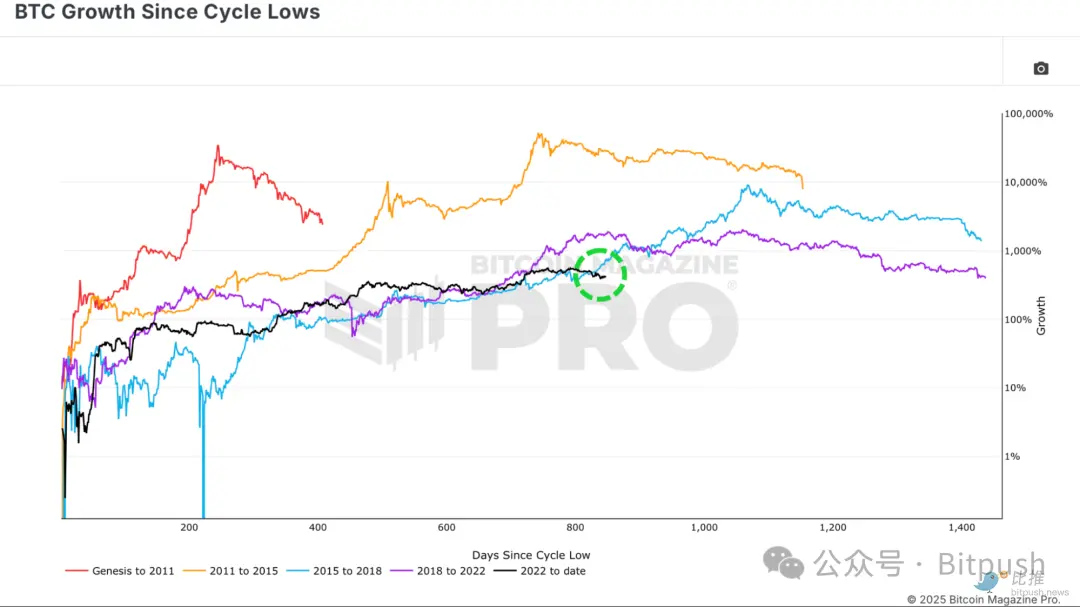
Figure 1: The current cycle's trajectory has recently diverged from historical patterns
Despite the recent divergence, the current Bitcoin cycle still maintains an unusually high historical correlation with the 2017 cycle. Earlier this year, the correlation between the current cycle and the 2015-2017 cycle was about 92%. Recent price deviations have slightly reduced this correlation to 91%, which is still considered extremely high in financial markets.
Investor Behavior Analysis
The MVRV ratio (Market Value to Realized Value ratio) is a key indicator for observing investor behavior, measuring the relationship between Bitcoin's current market price and the average cost basis of all BTC holders on-chain.
When the MVRV ratio rises sharply, it indicates that investors' unrealized profits have significantly expanded, often signaling the formation of a market top; conversely, when this ratio falls back toward the realized price, it suggests that Bitcoin's price is approaching the average holding cost for investors, typically marking the market's entry into a bottoming phase.

Figure 2: The MVRV ratio still exhibits a similar fluctuation pattern to the 2017 cycle
Latest Dynamics of the MVRV Ratio
The recent decline in the MVRV ratio reflects Bitcoin's pullback from historical highs, but its overall structure still shows similarities to the 2017 cycle—early bull markets often experience multiple deep corrections, so the correlation between the two remains at 80%.
Data Lag Effect
One possible reason for the current divergence in trends is the impact of data lag. For example, Bitcoin's price movements are highly correlated with global liquidity (the total money supply of major economies), but historical data shows that changes in liquidity typically take about two months to reflect in Bitcoin's price.

Figure 3: There is a lagged transmission effect of global M2 money supply on Bitcoin prices
Verification of Lag Effect
If we apply a 30-day lag to the current Bitcoin price trend compared to the 2017 cycle, the correlation will rise to 93%, becoming the highest recorded correlation between the two cycles. This lag-adjusted trend suggests that Bitcoin may soon return to the trajectory of 2017, indicating that a strong upward trend may be on the horizon.

Figure 4: The price trend remains highly consistent with 2017 data after a 30-day lag adjustment
Core Conclusion
History does not simply repeat itself, but it often has similar rhythms. The current Bitcoin cycle may find it difficult to replicate the exponential surge of 2017, but the underlying psychological mechanisms of the market still exhibit remarkable similarities. If Bitcoin re-establishes its connection with the lagged 2017 cycle, historical patterns suggest that Bitcoin may soon recover from the current adjustment and experience a breakthrough rally.


