
Step-by-step tutorial: Quickly master the method to view the liquidity price range of Meteora

 If we want to know at what price dev sells and accumulates using a unilateral pool, it is essential to know the corresponding price range.
Author: Zibu
Meteora is a DeFi project on the Solana chain, focusing on creating an efficient, sustainable, and flexible liquidity layer for the Solana ecosystem. Its goal is to address the issue of insufficient liquidity on Solana, making transactions smoother and cheaper, while providing better returns for users who provide liquidity.
Meteora's pools mainly consist of DLMM pools and Dynamic Pools, where bilateral and unilateral pools can be added in the DLMM pool. For example, the dev can use unilateral pools for selling and accumulating, such as the trump/sol trading pair. When the price rises, the dev can add a unilateral pool of $trump at a higher price range. When the price reaches this range, it will automatically convert $trump to $sol for selling, while also earning transaction fees. When the price drops, the dev can add a unilateral pool of $sol at a lower price range. When the price falls to the corresponding range, it will automatically buy $trump to accumulate.
If we want to know at what price the dev uses the unilateral pool for selling and accumulating, it is necessary to know the corresponding price ranges.
1. Basic Concepts
Website: https://app.meteora.ag/
1. Trading Pair
Any two tokens can form a trading pair, such as $trump and $sol forming the trump-sol trading pair, or $trump and $usdc forming the trump-usdc trading pair.
2. Pool (LP Pool)
Each trading pair can have multiple Pools, distinguished by different Bin Steps and Fees. For example, the trump-usdc trading pair has 57 Pools, each corresponding to a unique address, as shown in the image.

3. Bin
In DLMM, each bin represents a price, and each bin corresponds to a buy or sell order at a specific price.
4. Bin Step
Bin step refers to the price interval between two adjacent bins, calculated in basis points (1 basis point = 0.01%). It determines the density of bins and the granularity of liquidity distribution, set by the pool creator.
For example:
- Suppose the current price of SOL/USDC is $20, and the bin step is set to 25 basis points (0.25%).
- The price of the next bin would be 20 × 1.0025 = $20.05, and the next one would be 20.05 × 1.0025 ≈ $20.10, and so on.
5. Position
A position is used to describe how liquidity providers allocate funds to specific price ranges, with each position corresponding to a unique address. A position is created within a specific pool, and a pool can have multiple different positions.
A position typically includes the following key elements:
(1) Price Range
Each position has a clear price range, indicating the range of prices the liquidity provider wishes to support, composed of a series of consecutive bins.
(2) Amount of Funds
The quantity of the two tokens (e.g., SOL and USDC) invested. Meteora calculates the specific ratio of each token based on the current price and range to ensure it meets the pool's needs.
(3) Distribution Strategy Meteora offers several liquidity distribution methods, allowing users to decide how to allocate funds across bins:
- Spot (Uniform Distribution): Funds are evenly distributed across each bin, suitable for scenarios with expected low price volatility.
- Curve (Bell Curve Distribution): Funds are concentrated near the current price, decreasing as the distance from the current price increases, resembling a bell curve, suitable for LPs focusing on the current price.
- Bid-Ask (Two-Sided Distribution): Funds are concentrated on both sides of the current price, forming two peaks, suitable for high-volatility markets.
(4) Bin Step Users cannot change the bin step when creating a position; it is set when creating the pool.
2. Connect Wallet to View
Meteora supports connecting a wallet address to view held positions, and it also allows for observation mode. We can use this feature to check the price ranges of the pools.
Taking $trump (6p6xgHyF7AeE6TZkSmFsko444wqoP15icUSqi2jfGiPN) as an example.
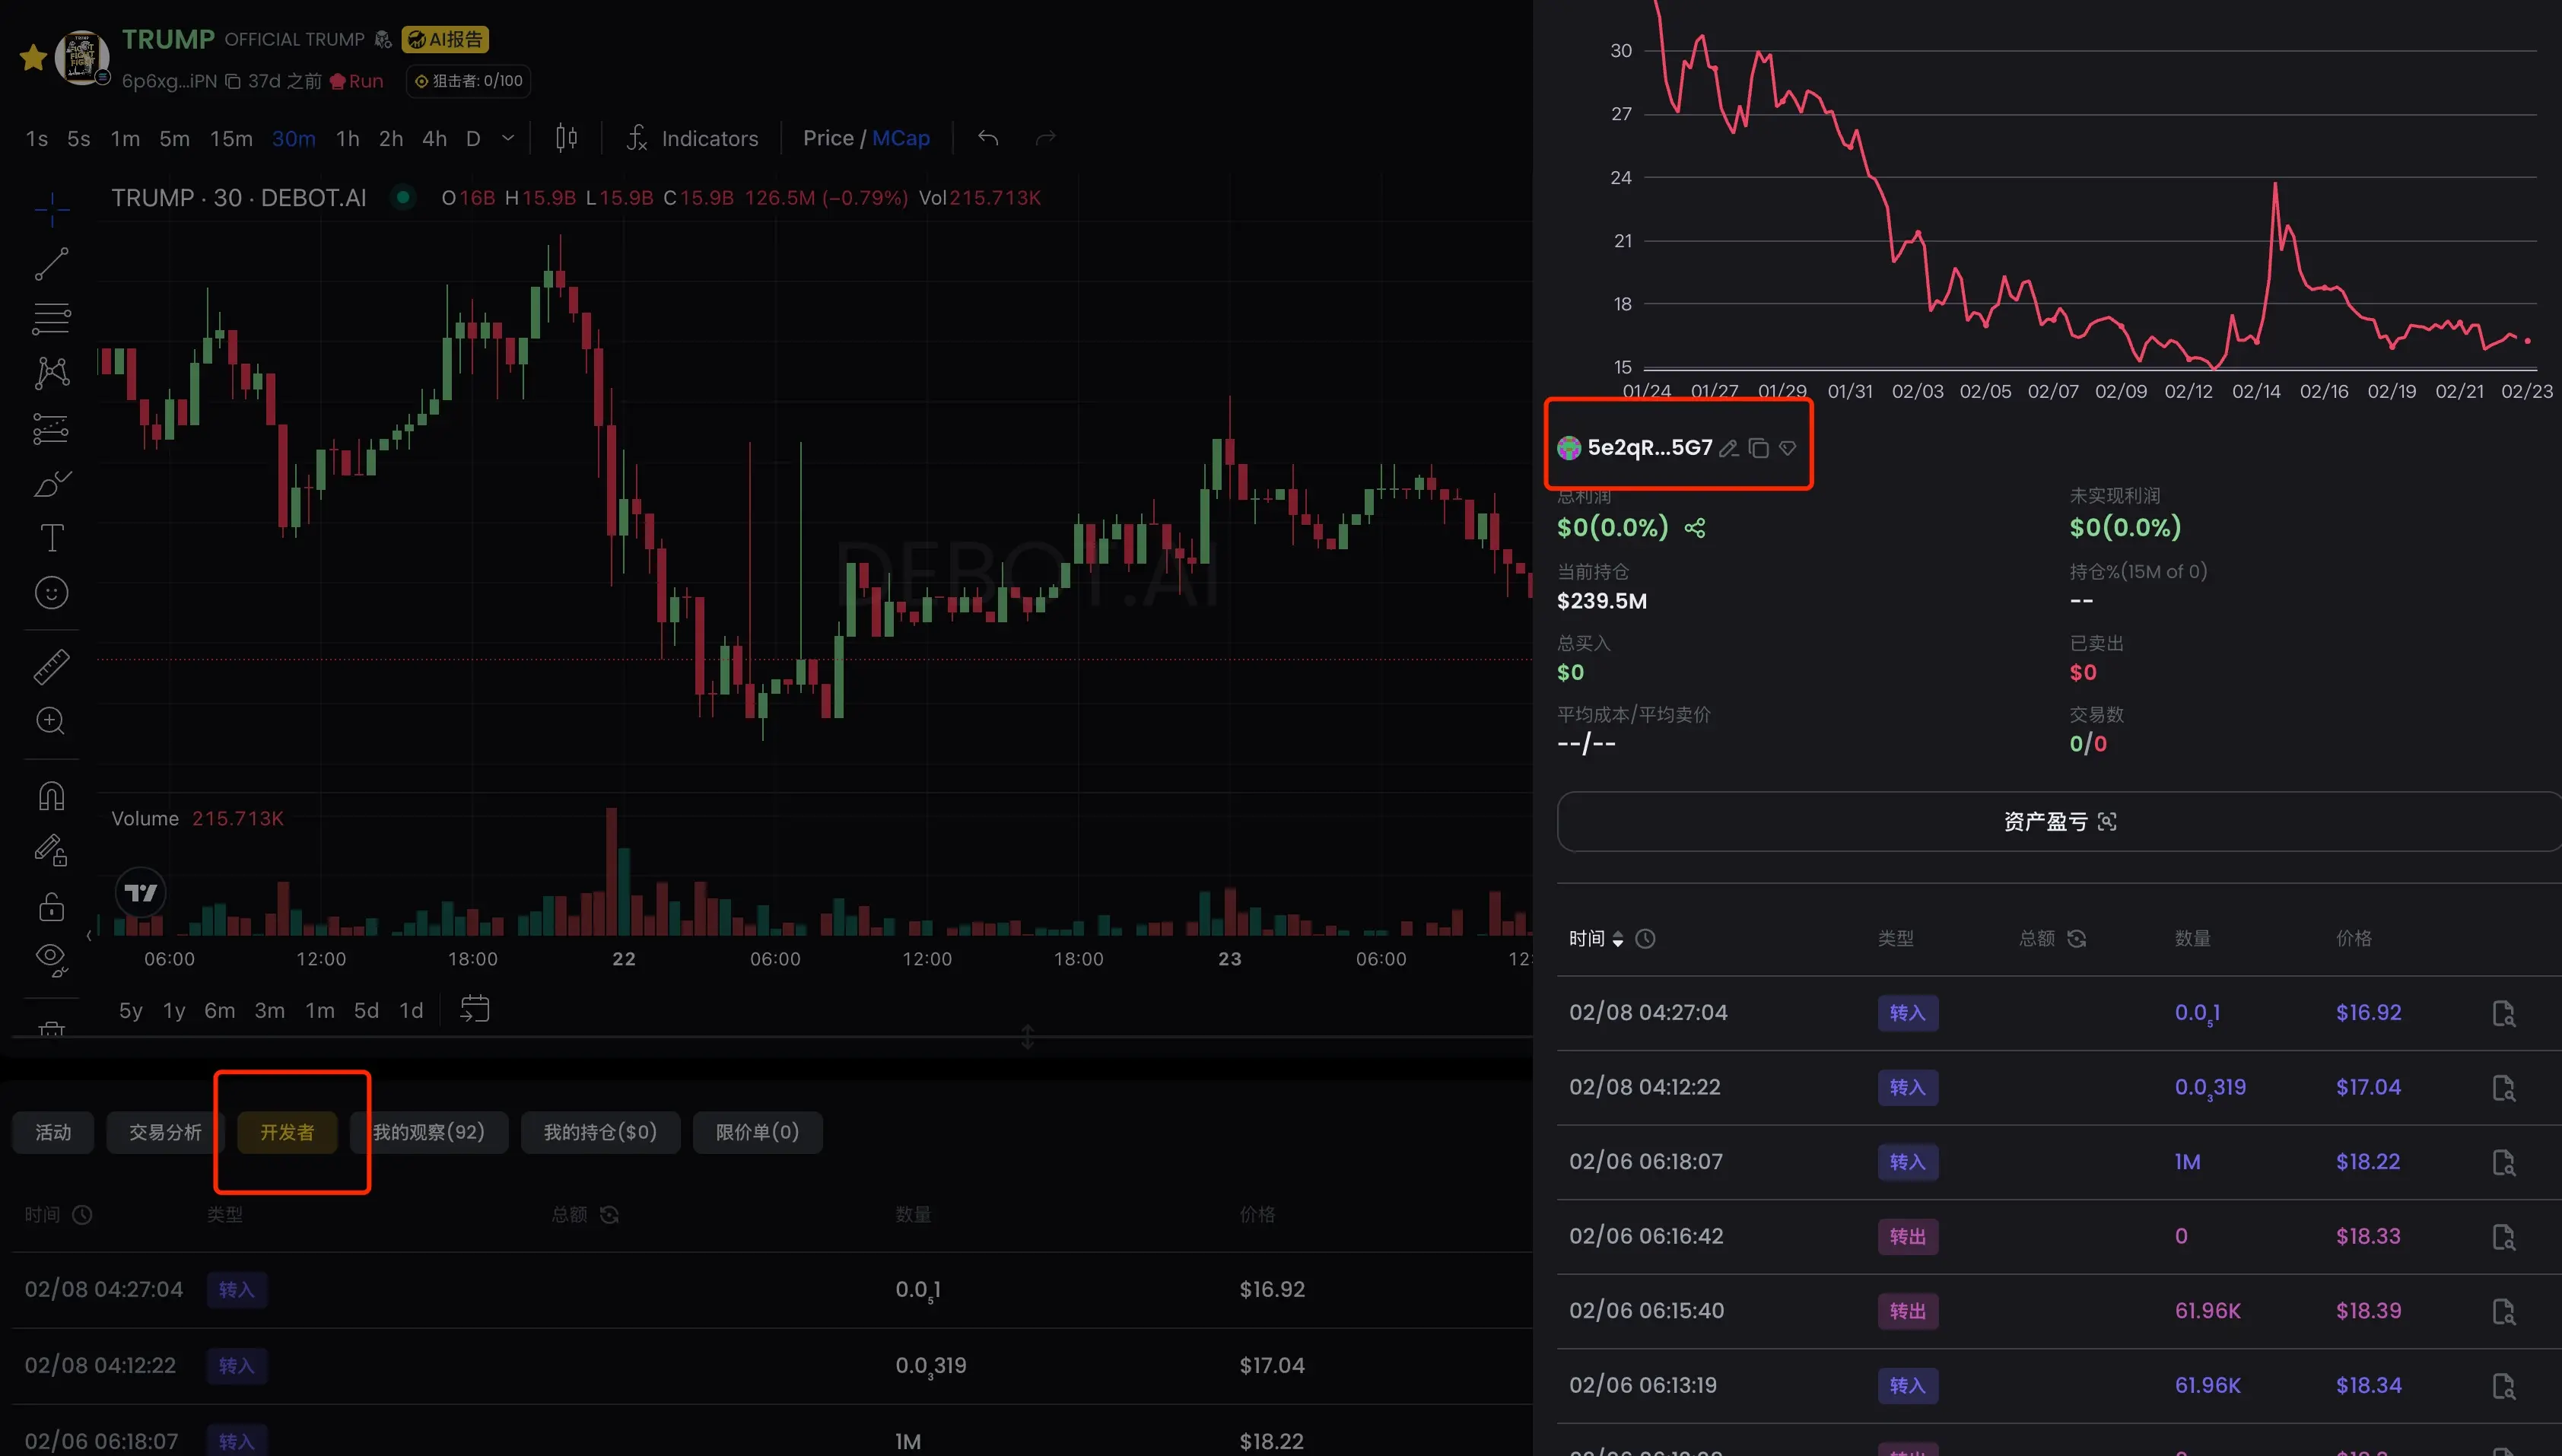
First, we open debot (https://debot.ai?inviteCode=175623) and input the CA of $trump to find the dev's address 5e2qRc1DNEXmyxP8qwPwJhRWjef7usLyi7v5xjqLr5G7, as shown in the image.
Then, we open the Phantom wallet, click on 【Add/Connect Wallet】--【Monitor Address】, input "Name" and "Address", filling in the dev's address 5e2qRc1DNEXmyxP8qwPwJhRWjef7usLyi7v5xjqLr5G7.

Finally, we open Meteora, connect the Phantom wallet, and click on 【Portfolio】 at the top to see all added pools. Clicking on any DLMM pool will display the pool's details and all positions, as shown in the image.

The Bin Step and Base Fee on the left side of the image represent the current pool information, while the middle section shows the positions at different price ranges. Clicking on any position will reveal current balances, unclaimed fees, distribution strategies, and more.
The advantage of viewing price ranges this way is that it is convenient and intuitive, allowing us to list all existing position data; the downside is that once liquidity is withdrawn, it cannot be viewed.
3. On-Chain Data Calculation
We can calculate the price range of each position using on-chain data, regardless of whether the position still exists.
Meteora's documentation provides the calculation formulas:
Minimum price range: minprice = (1 + binstep/10000) ^ lowerbinid
Maximum price range: maxprice = (1 + binstep/10000) ^ upperbinid
If the trading pair is represented as A/B, where token A has a precision of decimalsA and token B has a precision of decimalsB, the final calculation formulas are:
Minimum price range: minprice = (1 + binstep/10000) ^ lowerbinid / 10^(decimalsB-decimalsA)
Maximum price range: maxprice = (1 + binstep/10000) ^ upperbinid / 10^(decimalsB-decimalsA)
It is important to note that the price calculated here is the price of token A relative to token B. If we want to see the price of token A relative to USD, we also need to check the USD price of token B and then convert it.
From the above formulas, we can see that to calculate the data, we need to know a pool's binstep, the position's lowerbinid and upperbinid, as well as the precision of the two tokens in the trading pair.
Continuing with the example of $trump (6p6xgHyF7AeE6TZkSmFsko444wqoP15icUSqi2jfGiPN), we calculate the price range of a certain unilateral pool of this dev.
We open solscan, input the dev address of $trump (https://solscan.io/account/5e2qRc1DNEXmyxP8qwPwJhRWjef7usLyi7v5xjqLr5G7?activitytype=ACTIVITYTOKENADDLIQ&page=5#defiactivities), open the 【Defi Activities】 tab, filter the 【Action】 for "ADD LIQUIDITY", and in the Amount column, we can see that all listed liquidity addition transactions are unilateral pools, either adding only $trump or only $usdc. This article takes the last transaction in the image as an example.
 Open the last transaction in the image (https://solscan.io/tx/284UXTrgWNFFXTovbCAQsJA8U5mW4rntwa8KyRvSmhNYf7cus1rtskiVqwNkErdosDMUsJfxXm8KgkCf1DzTPmPr), check the transaction details, and we can see that this pool addition only added $trump.
 We can check the links for $trump and $usdc to find that the precision of $trump is 6, and the precision of $usdc is also 6.
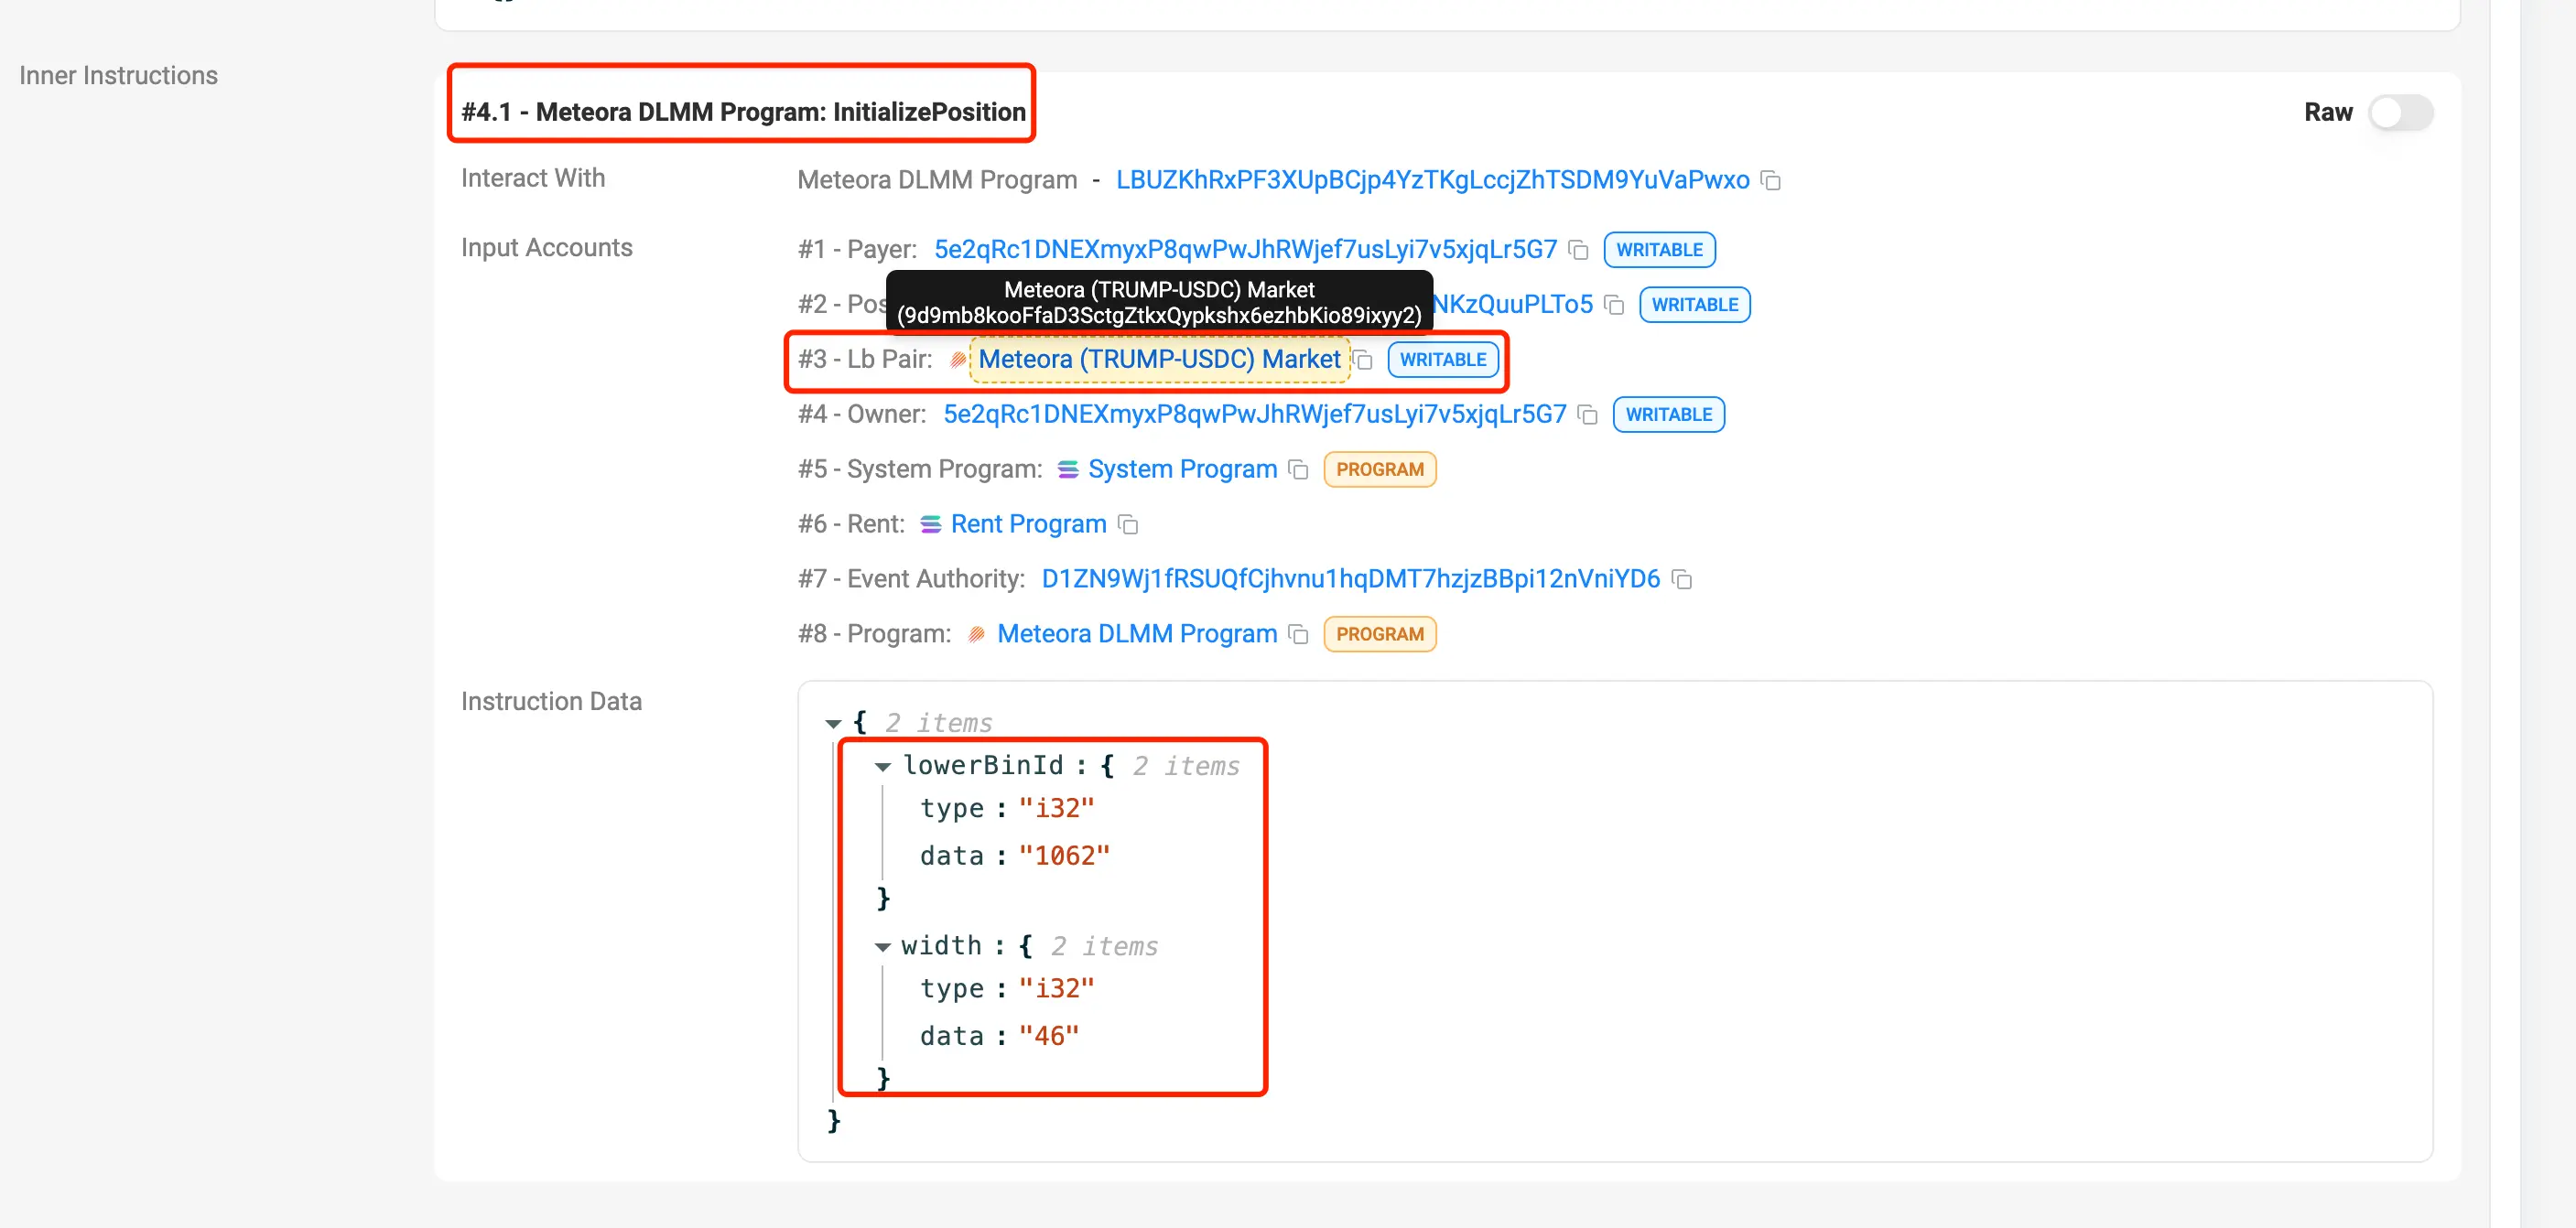
 Scrolling down on the transaction details page, in 【#4.1 - Meteora DLMM Program: initializePosition】, we can find that lowerBinId is 1062, the width of the bin is 46, and the pool address is 9d9mb8kooFfaD3SctgZtkxQypkshx6ezhbKio89ixyy2, as shown in the image. From this information, we can calculate upperBinId = lowerBinId + width - 1 = 1062 + 46 - 1 = 1107.
 On solscan, we open the pool address 9d9mb8kooFfaD3SctgZtkxQypkshx6ezhbKio89ixyy2 (https://solscan.io/account/9d9mb8kooFfaD3SctgZtkxQypkshx6ezhbKio89ixyy2), click on the 【data】 tab, and switch "LbPair" to "Table" to find that the binStep value is 50, as shown in the image.
 From the above information, we can obtain all the necessary data for the calculation formulas:
binstep = 50
From the above information, we can obtain all the necessary data for the calculation formulas:
binstep = 50
lowerbinid = 1062
upperbinid = 1107
decimalsA = 6
decimalsB = 6
Thus, we can calculate:
Minimum price range: minprice = (1 + binstep/10000) ^ lowerbinid / 10^(decimalsB-decimalsA) = (1 + 50/10000) ^ 1062 / 10^(6-6) = 199.6905832
Maximum price range: maxprice = (1 + binstep/10000) ^ upperbinid / 10^(decimalsB-decimalsA) = (1 + 50/10000) ^ 1107 / 10^(6-6) = 249.9368917
The calculated price range is completely consistent with the price range in the second part of the image.
4. Conclusion
By using monitoring tools, when we find that the dev or other large holders are adding unilateral pools, we can use the above methods to calculate the price range they are preparing for selling or accumulating, and then make decisions based on K-lines and other data. The $libra issued by Argentine President Milei also used unilateral pool additions for selling, and we can use the methods introduced above to review the price range at which he added to the pool.
The tools I commonly use are debot, gmgn, and okx, but these three tools are not very convenient for viewing liquidity. Some ideal features I would like to see include:
- Listing all operations of the dev, including deposits, withdrawals, pool additions, and pool withdrawals, and being able to identify and mark transactions involving locked positions and pool additions/withdrawals.
debot can identify all deposits and withdrawals, but not pool additions and withdrawals;
gmgn can identify pool additions and withdrawals but cannot identify the dev's deposits and withdrawals, and it did not recognize the dev's pool addition and withdrawal transactions for the trump token;
okx has a liquidity pool change feature that separately lists pool additions and withdrawals, but it also did not recognize the dev's pool addition and withdrawal transactions for the trump token. - For each pool addition and withdrawal, providing specific price ranges, so manual calculations are not necessary.
- When calculating the dev's profit data, including the fees received and the changes in funds during pool withdrawals, so manual profit statistics are not needed.
This feature is mainly possible for debot and gmgn, as they have already done profit data for each address.
I look forward to these tools becoming more and more user-friendly!


