The Great God said: On November 27, Bitcoin experienced its largest drop since Trump's election! Falling to $90,000, who is selling?

 Bitcoin began to show the most obvious pullback after Trump's election, fluctuating downwards from around $99,500, reaching a low of about $90,800 this morning.
Since Trump won the U.S. election on November 8, Bitcoin has been steadily pushing towards the $100,000 mark, reaching a high of nearly $99,500 on November 23, with a cumulative increase of 37.6% over the past month. However, since last weekend, Bitcoin has started to show the most significant correction since Trump's election, fluctuating downwards from around $99,500, hitting a low of about $90,800 this morning. As of the time of writing, it has slightly rebounded, priced at $93,353, with a decline of 1.68% in the past 24 hours.
Bitcoin's repeated failures to break through the $100,000 mark can be attributed to long-term investors in the market taking substantial profits during the post-election rally. These individuals have begun to exit with realized profits, with long-term holders selling off up to $2.02 billion daily, setting a historical high. This indicates that the market needs strong demand to absorb this excess supply. However, this process may require a period of reaccumulation to complete.
Bitcoin 4-Hour Chart
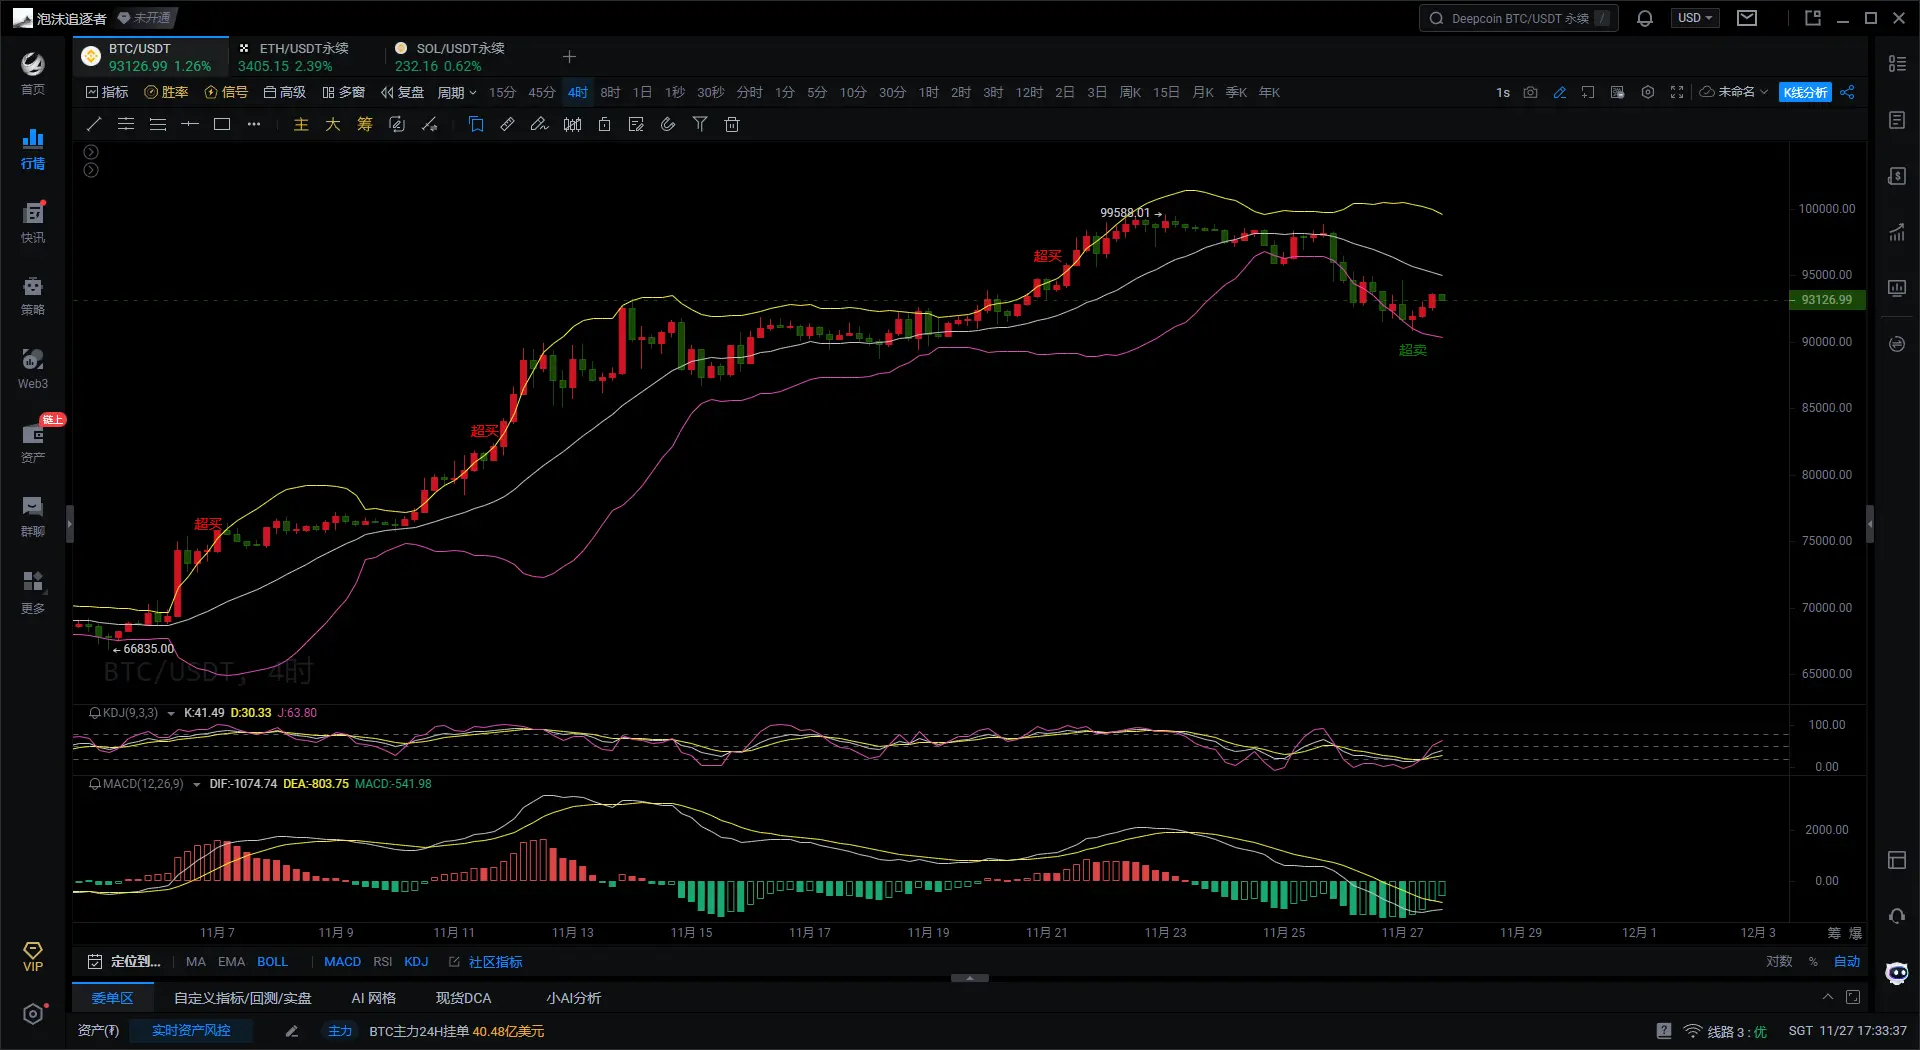
Firstly, according to the Bollinger Bands indicator on the 4H Bitcoin chart, the price has rebounded near the lower band and is gradually approaching the middle band, indicating that the market is gradually recovering from an oversold state. If the price can effectively stabilize above the middle band, it may continue an upward trend, with a target likely near the upper band. However, if the price fails to stabilize above the middle band, it may continue to fluctuate between the lower and middle bands.
Secondly, based on the KDJ indicator on the 4H Bitcoin chart, the K line and D line have rebounded from low levels and are moving upwards, currently not in the overbought area, but the J line is quickly approaching, showing strong short-term rebound momentum. If the K line and D line break above the 50 area, it will further strengthen the upward trend. However, it is also necessary to be cautious of the risk of a pullback at high levels.
Finally, according to the MACD indicator on the 4H Bitcoin chart, the DIF line and DEA line are still below the 0 axis but are gradually converging, and the MACD green histogram is gradually shortening, indicating that bearish strength is weakening. If the DIF line breaks upwards through the DEA line to form a golden cross, it may further confirm the rebound trend.
Bitcoin 1-Hour Chart
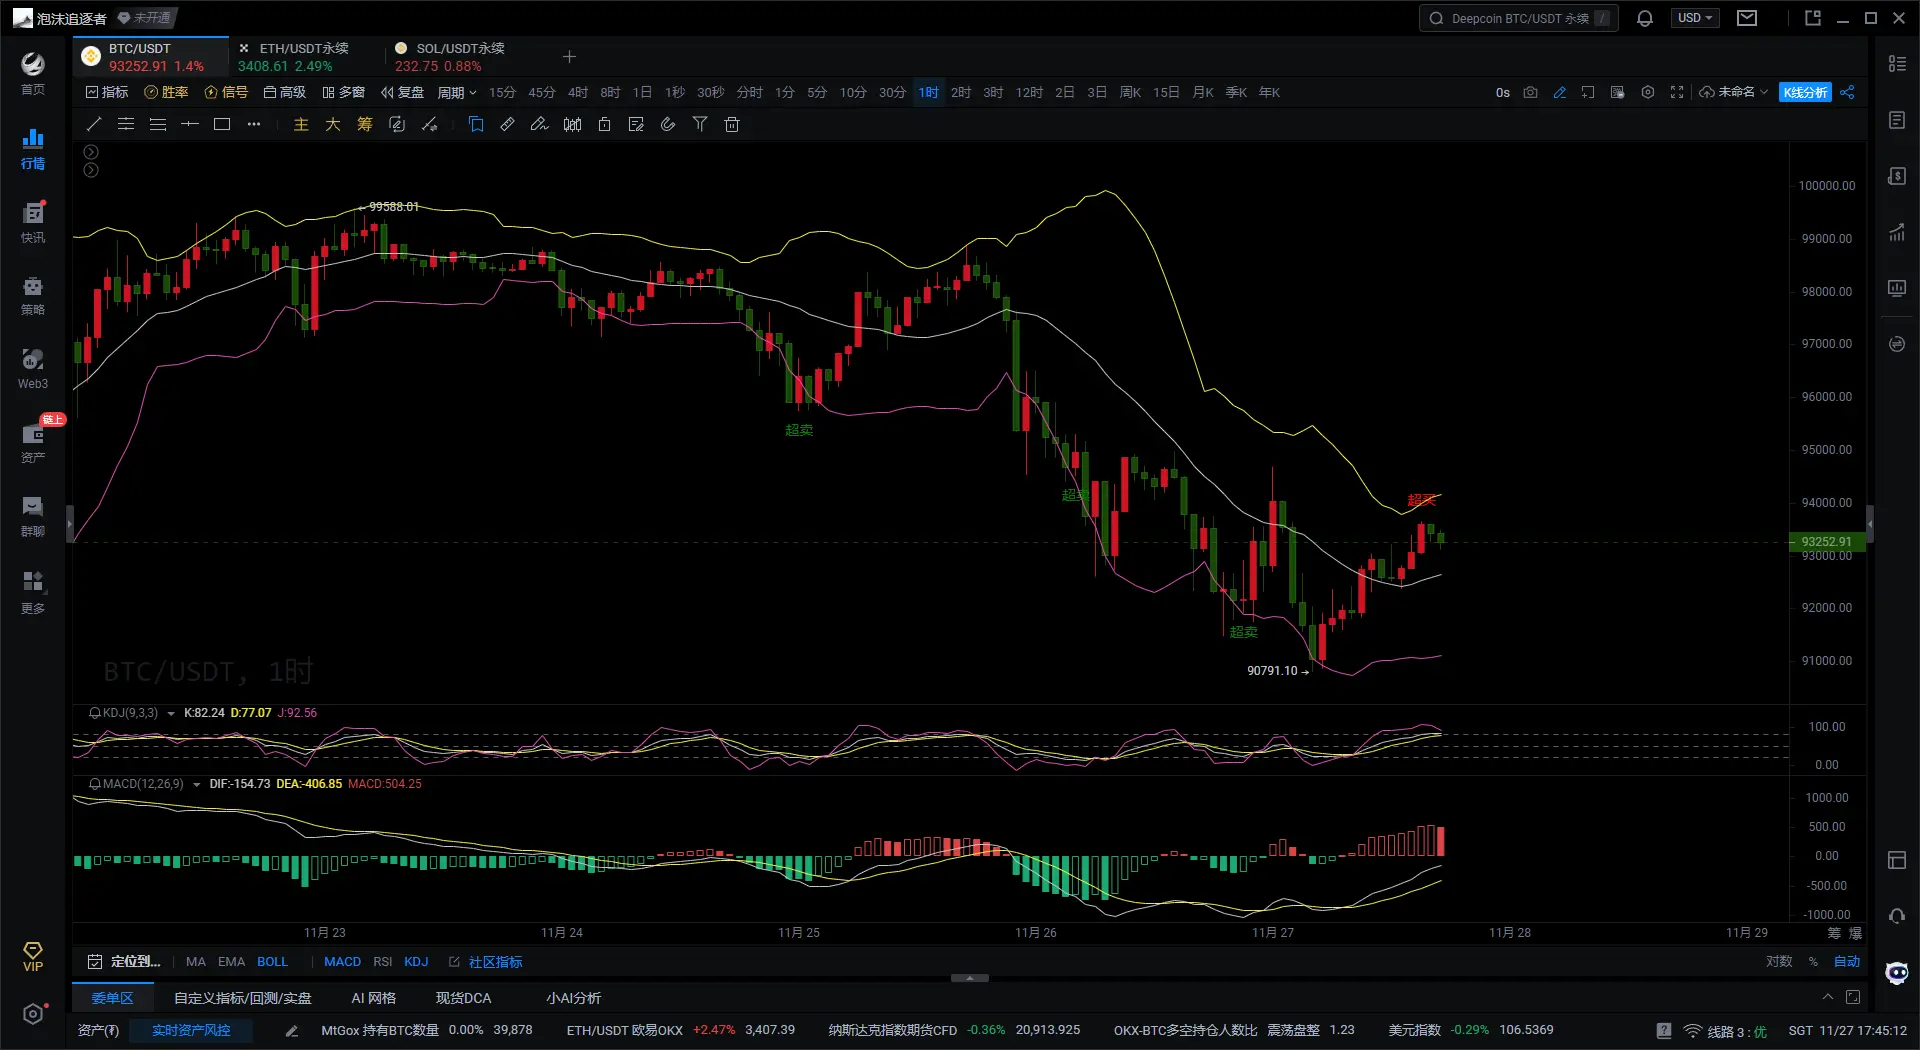
Firstly, according to the Bollinger Bands indicator on the 1H Bitcoin chart, the price has started to rebound from the lower band and is currently operating near the middle band, but has not effectively broken through the middle band, indicating a short-term fluctuating adjustment trend. If the price can effectively stabilize above the middle band, it may continue to test the upper band resistance (94,500-95,000). If the price fails to stabilize above the middle band and falls back, it may seek support again near the lower band (91,000).
Secondly, based on the KDJ indicator on the 1H Bitcoin chart, the K line and D line are in the overbought area, and the J line has started to turn downwards, indicating that there may be short-term pullback pressure. If the K line and D line move downwards and break below 50, it can confirm that the short-term is entering a downward trend, and only when it returns to the oversold area may there be another chance for a rebound.
Finally, according to the MACD indicator on the 1H Bitcoin chart, the DIF line and DEA line are close to the 0 axis below and have not formed obvious golden cross or death cross signals. The MACD red histogram is gradually shortening, indicating that bullish strength is declining. If the DIF line crosses down through the DEA line to form a death cross, the price will further decline; if the DIF line and DEA line break above the 0 axis and increase in volume, it may further push upwards.
In summary, the current Bitcoin price shows signs of rebound, with the MACD and KDJ indicators on the 4H level supporting the demand for a short-term rebound, with key resistance at the Bollinger Bands middle band around 95,000. On the 1H level, Bitcoin is currently fluctuating near the middle band, and the short-term direction is still unclear. If KDJ and MACD form bearish signals, it may drop back to test support near 91,000.
Based on the above, the following suggestions are provided for reference:
Buy Bitcoin on a pullback to around 92,600, targeting 94,000-94,500, with a stop loss at 92,000.
Time of writing: (2024-11-27, 17:30)
(Written by - Daxian Talks Coins)