The Great Master said: 11.01 Reversal before the US election! Bitcoin misses the previous high?

 U.S. Vice President and Democratic presidential candidate Harris leads former U.S. President and Republican presidential candidate Trump by a narrow margin of only 1%.
The latest opinion poll results show that U.S. Vice President and Democratic presidential candidate Harris is leading former U.S. President and Republican presidential candidate Trump by a slim margin of just 1%. However, 10% of voters may change their minds before the election.
** Harris currently leads Trump with a support rate of 49% to 48%, but there is still room for change in the support rate with only a few days left before the election, as about 10% of potential voters and 16% of registered voters indicate they are still weighing their options. Additionally, in seven key swing states that could determine the final election winner, Harris leads Trump with a support rate of 49% to 48%, whereas a week ago, Trump led Harris with a support rate of 50% to 46%.**
** Meanwhile, Mt. Gox, which had been inactive for two months, transferred 500 bitcoins in two transactions around 8:45 AM this morning, but it is unclear whether this is for compensation. Currently, there are approximately 44,900 bitcoins worth about $3.11 billion in the Mt. Gox wallet awaiting compensation to creditors.**
** In the cryptocurrency sector, Bitcoin experienced a significant drop this morning, briefly falling below the $70,000 mark. As the U.S. election approaches, market uncertainty has increased, leading many investors to reduce their positions. This not only greatly reduces the chances of Bitcoin hitting a new high before the election but may also trigger market volatility that could negatively impact the price. As of the time of writing, the price is $69,628, with a decline of over 4% in the past 24 hours.**
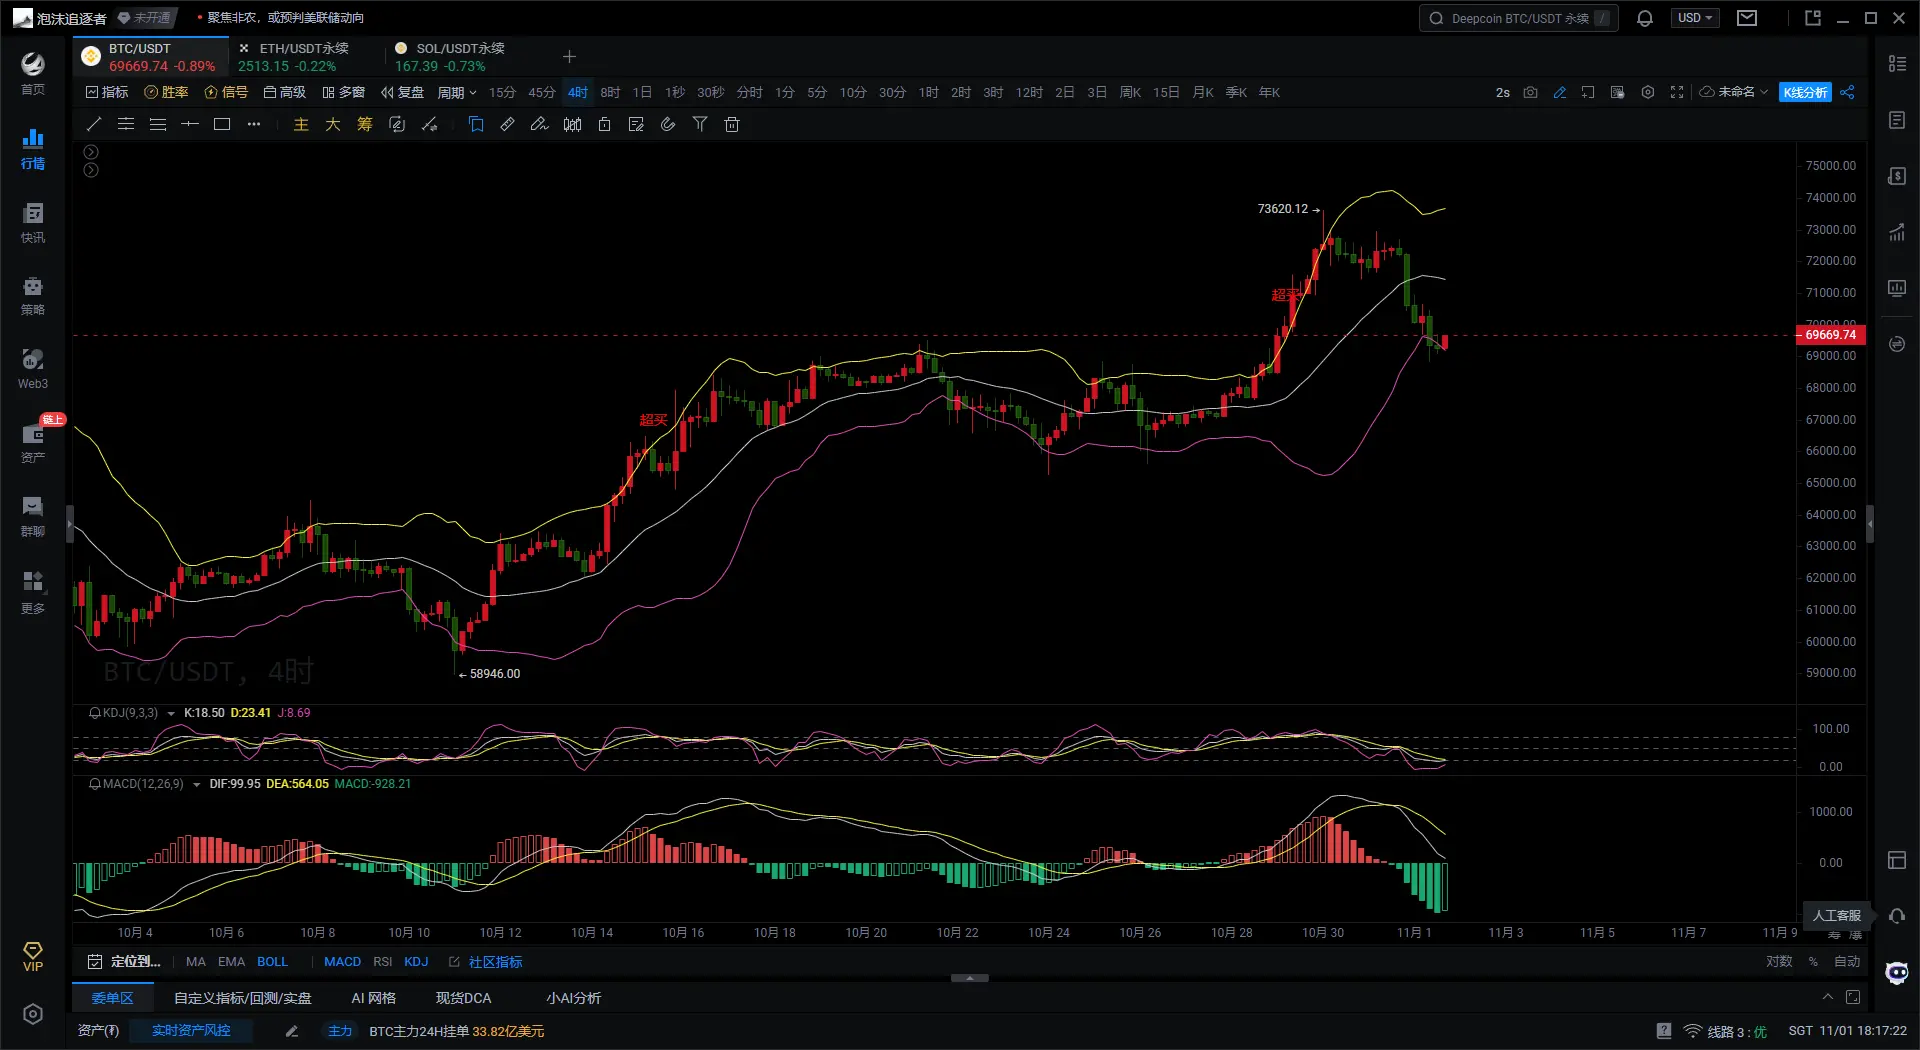
** Bitcoin 4-Hour Chart**
**  **
**
** First, according to the Bollinger Bands indicator on the 4H Bitcoin chart, the current price is near the lower band, having significantly retraced from the upper band. The expansion between the upper and lower bands indicates high market volatility. If the price finds support near the lower band, it may retest the middle band area. If it breaks below the lower band support, it may further decline.**
** Second, based on the KDJ indicator on the 4H Bitcoin chart, all three KDJ line values are currently at a low position and are turning upward, showing clear signs of a rebound. If the three line values form a golden cross at a low position, the price of Bitcoin will rebound.**
** Finally, according to the MACD indicator on the 4H Bitcoin chart, the DIF line and DEA line are showing a death cross pattern at a high position, indicating that the bearish forces are currently dominant. At the same time, the MACD histogram is also green, which confirms the strong bearish sentiment. If the MACD green histogram shows a trend of gradually increasing, the price may continue to decline in the short term.**
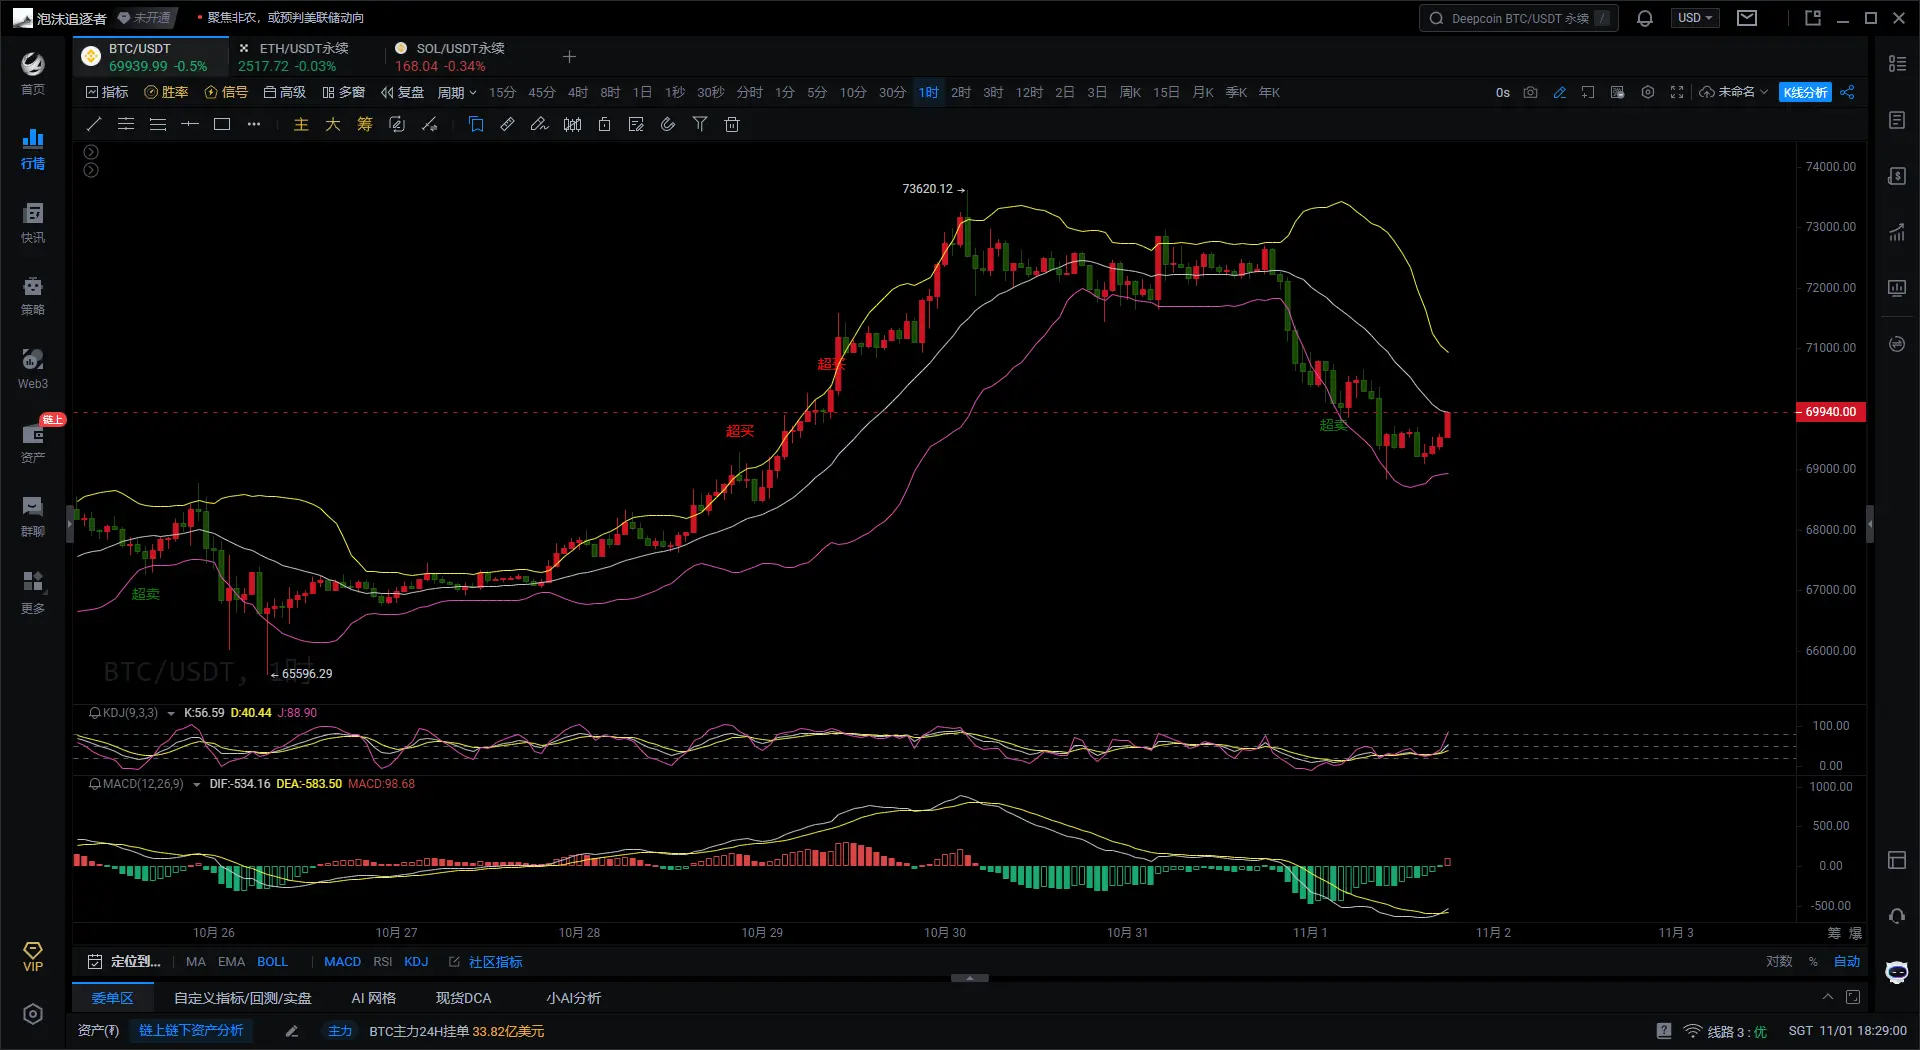
** Bitcoin 1-Hour Chart**
**  **
**
** First, according to the Bollinger Bands indicator on the 1H Bitcoin chart, the price has just rebounded from the lower band to near the middle band but has not yet broken through the middle band. The opening of the Bollinger Bands shows a downward trend, indicating that the downward pressure still exists. If the price stabilizes effectively at the middle band, it may further test the upper band resistance; conversely, if it cannot stabilize effectively at the middle band, it may continue to run along the lower band.**
** Second, based on the KDJ indicator on the 1H Bitcoin chart, the K line and D line values have formed a golden cross at a low position, and the J line value is moving upward, indicating that there is momentum for a rebound in the short term.**
** Finally, according to the MACD indicator on the 1H Bitcoin chart, the DIF line and DEA line are gradually converging at a low position, showing signs of forming a golden cross, which may lead to upward momentum in the short term. The MACD green histogram has shortened, indicating that bearish forces are weakening, and there is a demand for a rebound in the short term.**
** In summary, from the 4H perspective, Bitcoin has some support near the middle band of the Bollinger Bands, but both MACD and KDJ indicate that bearish forces are dominant, suggesting there may be a risk of continued decline in the short term. If the middle band is lost, the price may test the support of the lower band. From the 1H perspective, Bitcoin shows signs of a short-term rebound after the decline. The low-position golden cross of KDJ and the shortening of the MACD histogram indicate a demand for a rebound, but it is still necessary to monitor whether the price can effectively break through the middle band of the Bollinger Bands. If it can break through and stabilize at the middle band, it may initiate a rebound trend.**
** In conclusion, the following suggestions are provided for reference**
** The non-farm payroll data for September will be released at 8:30 PM. Due to the uncertainty caused by the strong hurricane and the Boeing strike, it is expected that the non-farm payroll number for October will drop from 254,000 in September to about 100,000. The unemployment rate is expected to remain unchanged at 4.1%.**
** Long Bitcoin around 69,300, targeting 70,900, with a stop loss at 68,850.**
** Time of writing: (2024-11-01, 18:17)**
** (Article by - Daxian Says Coin)**