Altcoins enter "IQ50" mode, is a new high for BTC imminent?

 Are altcoins like APE and DYDX surging, is the logic simple, and has the crazy bull market finally arrived?
Author: CMed, BlockBeats
On the evening of October 21, Eastern Eight Time, BTC broke upward, officially surpassing the 69,000 mark, reaching a high of 69,500 USD. Throughout the weekend, BTC remained mostly in a sideways trend with low liquidity. Why did a sudden surge occur during Sunday’s U.S. trading hours? Was this surge driven by futures or caused by spot purchases?
Recently, there have been many positive developments for altcoins, starting from APE, to DYDX and SUSHI. After the positive news, many altcoins saw increases of over 20%. The bottom altcoins are gradually showing signs of life. Can the oracle sector, which was the engine of last October's bull market, lead altcoins out of another bull market this time? Is the bull really back? Let's take a look at traders' perspectives from various angles.

Technical Analysis Group
@leon_li2

From the candlestick chart, BTC seems to have broken through a downward trend line that has lasted for over half a year, appearing to set new highs daily, but the trading volume at these new highs has significantly shrunk. In contrast, ETH has broken through its previous high but has only reached the real pressure zone around 2800. The increase in ETH yesterday brought about high market sentiment, and for the first time, the contract price exceeded the spot price, leading to the belief that the bullish trend is nearing its end, and the building could collapse at any moment.
Many people compare the current market to October 2023, noting that both show a weekly MACD golden cross and a weekly bullish candlestick breaking previous highs. However, I believe the current market sentiment is completely different from that time; back then, the consensus was bearish, while now it is bullish. I do not think the MACD golden cross here has any practical significance for trading, as a golden cross can quickly turn into a death cross. Who is right or wrong will depend on whether it replicates the bullish candlestick and sets new highs this week.
As for when I will stop being bearish, it will likely be after ETH effectively breaks through 2820 following a consolidation. Currently, I do not have any short positions and am looking for opportunities to short on the right side.
@CryptoPainterX
From the ASR-VC4 hourly channel perspective, the current price action is somewhat similar to the pattern at the end of September, continuously operating near the average pressure zone. It could either be a buildup or a sign of exhausted momentum. From the perspective of spot premiums, this resembles the market in early June, where a long-term negative premium indicated a bullish trend. The key price level for determining a full bullish trend in the channel is at 71,000. If it strongly breaks through the average pressure zone, the first target may be near the overbought line, currently around 77,500.

@Patrade_Buer
From a weekly perspective, the upward trend continues. Currently, BSL is waiting to be taken. This upward trend must set new highs, with my personal target looking at the 90,000 range. It still belongs to the range (the FVG gap in the oscillation range generally gets filled), so pay attention to whether there are opportunities for WFVG, around 64,500 USD.

From a daily perspective, it continues to oscillate upward, mainly waiting for BSL to be taken. If there is a chance for BTC to pull back, it will likely be around 645, and it is essential to buy. If BTC does not have many trading opportunities, look for trading opportunities in altcoins.

From an hourly perspective, it is oscillating upward, continuously creating new highs. If it retraces without breaking the OB, short-term longs can be taken during the day; if it breaks the OB, one can expect buying opportunities on the retrace.

@CryptosLaowai

First, I believe the downward trend line of this large cycle has been broken and successfully retested. A bearish rising wedge has formed on a smaller scale, indicating a short-term weakening, with a potential retracement to the large cycle's downward trend line and the 0.236 Fibonacci retracement level of this round of market warfare, roughly around 67,000 USD, forming a large-scale rising wedge. The first target of this upward movement remains around 72,000 USD.
Data Analysis Group
@Kbeast.eth

Based on the value area of BTC's wide fluctuations over the past six months, yesterday's upward breakout did not exceed the VAH of this half-year. Additionally, the thickest distribution area, which is the largest supply zone, is at 70,900. If it can continue to rise without showing upward auction rejection, the next target for the rise will be 70,900.

From the perspective of the annual VWAP, it has gone through a buildup breakout without a significant downward driving force but has retraced without breaking. Therefore, I believe it will continue to break upward in the short term. According to the buyer liquidity depth chart and liquidation heat map, a key position for a downward retracement is around 65,000 - 67,000 USD.
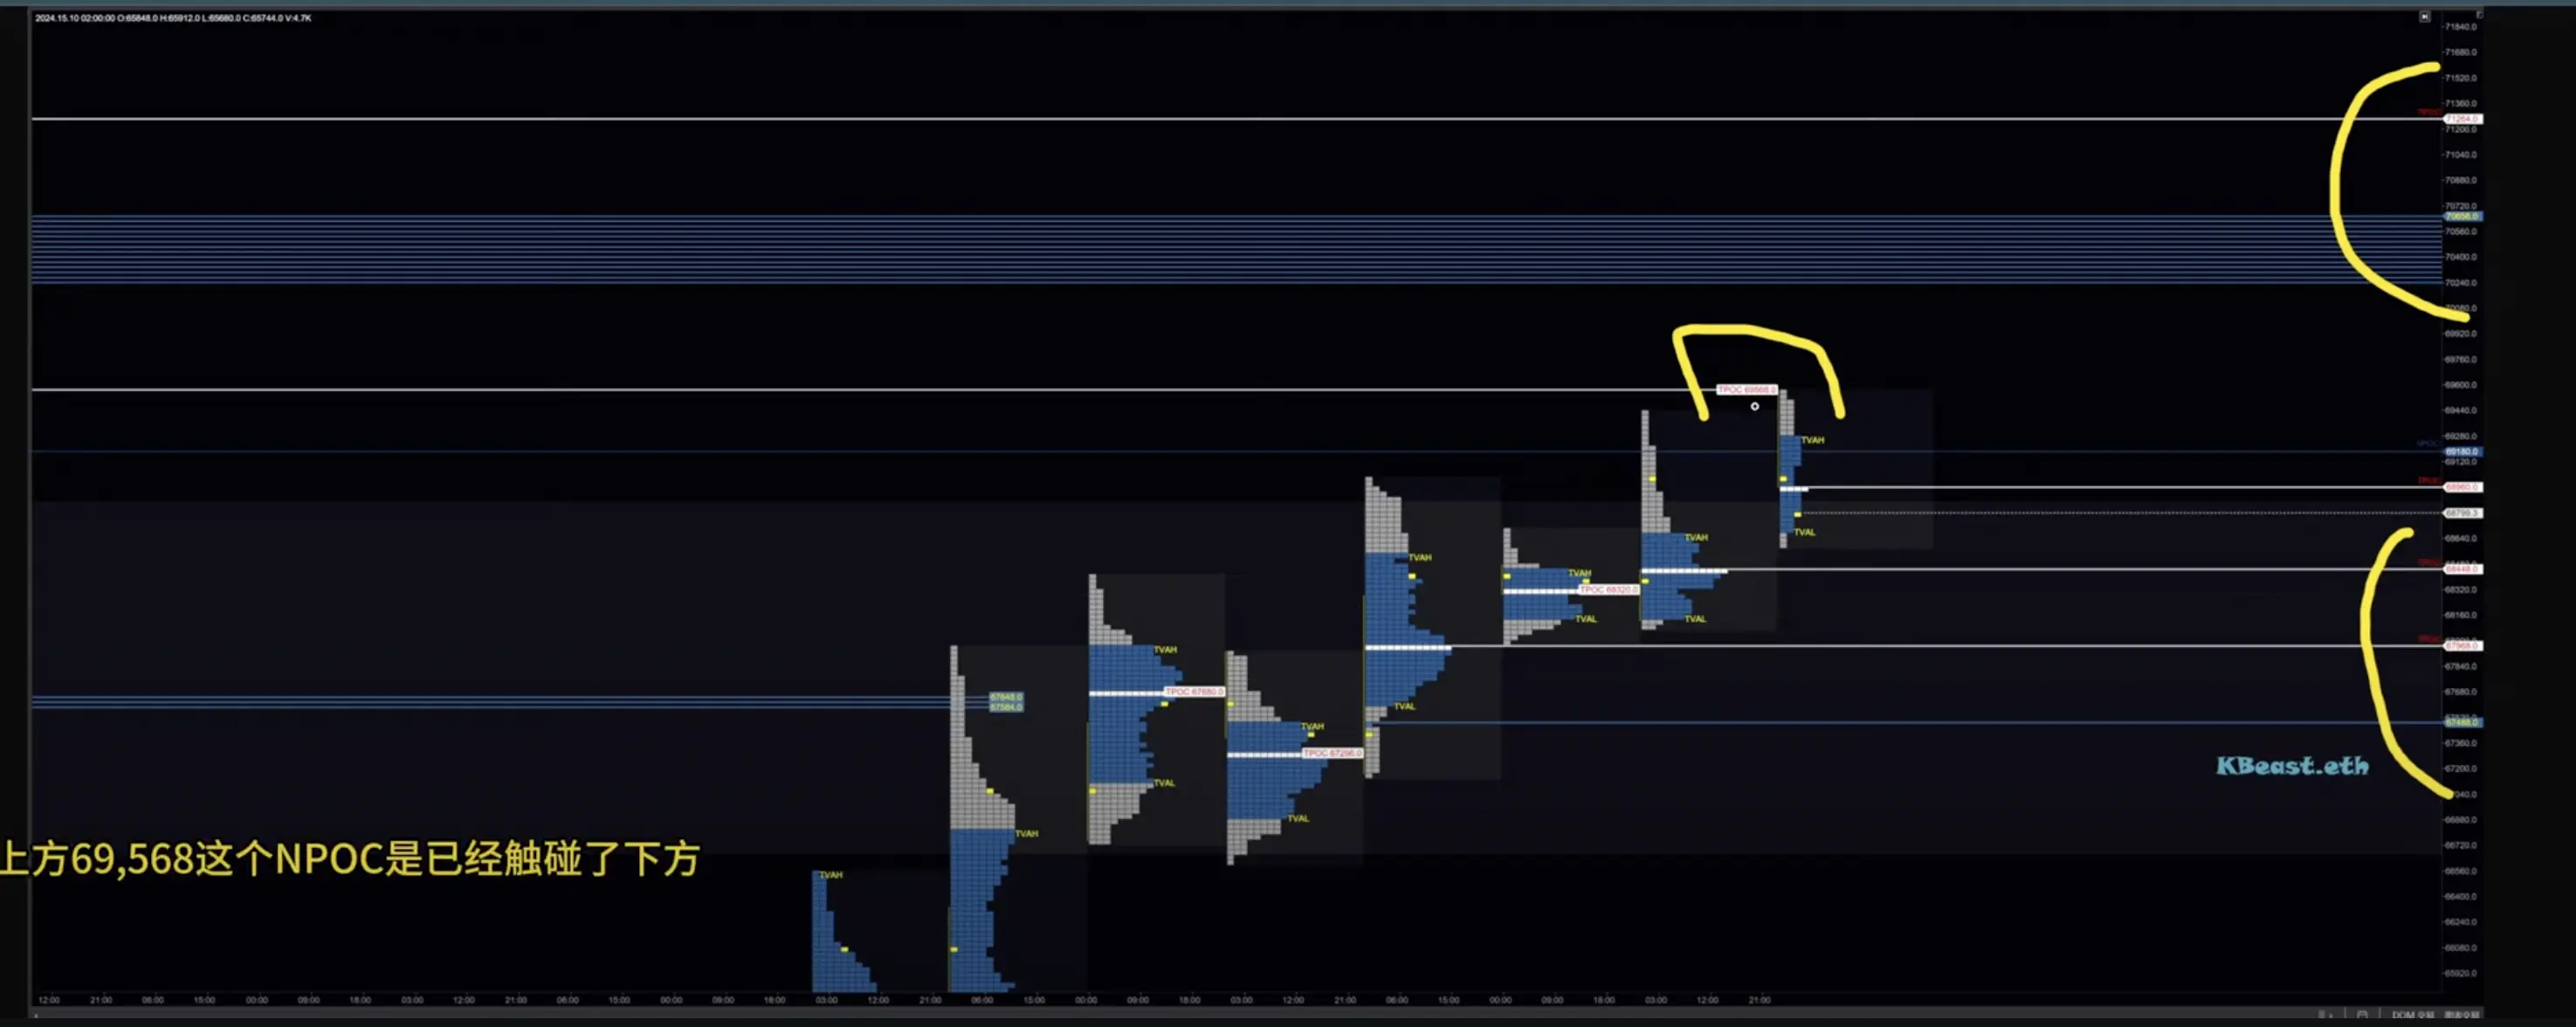
Observing the auction format during the day, there is a clear upward auction structure. This aligns with the view of continuing upward breaks, so one can remain bullish.
@LinChen91162689

@CryptoPainterX
From a data perspective, in the spot market: aggregated spot sales remained slightly negative on Sunday evening but began to increase significantly on Monday morning, with the surge occurring in two phases; in the futures market: aggregated futures saw continuous small sales from Sunday evening to Monday morning, maintaining long positions during the first surge in the spot market, but after the second surge fully broke through 69,000, it turned entirely bullish. It appears that the bears initially entered based on the possibility of a false breakout at 69,000 and were subsequently forced to stop-loss as strong buying in the spot market pushed prices up. Notably, Coinbase changed its previous continuous selling state starting Sunday and began to accumulate small amounts, which is a significant change. However, Binance Futures only showed clear buying during three significant surges, while the rest of the time was spent on small long/short positions. In summary, spot buying has begun to appear! Although the volume is not large, if it can absorb the selling pressure from futures profit-taking, the price can stabilize at 69,000.

From the perspective of USDT market share, the weekly USDT market share has slightly broken below the upward trend line of the past six months. If this truly confirms a breakdown, it represents the entry of idle funds, and a likely outcome is that BTC's dominance may temporarily peak, while altcoins and small-cap projects will gain comprehensive liquidity in the next 2-3 weeks.

From the perspective of total futures open interest, the total open interest for BTC futures across the network has remained above 40 billion USD for three consecutive days. While maintaining high open interest, the price has increased by 1,500 USD, indicating that spot funds have entered in small amounts. However, compared to BTC's previous fluctuations between 68,000 and 69,000, the current total open interest has increased by 2.5 billion USD. For spot bulls, although sentiment is strong, there has not been significant selling pressure. Therefore, for the current market, spot will not become a source of potential risk. Instead, the additional 2.5 billion in open interest may be the source of the next "long squeeze," leading to the liquidation of many high-position bulls. In a true bull market, each liquidation of a large number of leveraged bulls is a necessary condition for the next rise. In a market with high futures weight, the bears are the source of upward funds, while the bulls become a burden.
Macro Analysis Group
@Phyrex_Ni
Last Friday, the data for BTC spot ETFs still performed well. Although there is a trend of decreasing purchasing power similar to ETH, a significant amount of funds are still concentrated in BTC. On Friday, the net inflow of the spot ETF was 4,099 BTC, which, although the lowest data of the week, is still strong compared to the past.
BlackRock has continuously increased its holdings for five consecutive working days during the week, adding a total of 16,975 BTC. Such weekly increase data has not been seen since March. Fidelity added 4,807 BTC, ranking second, followed by ARK with 4,538 BTC and Bitwise with 2,244 BTC in fourth place.
It is worth mentioning that Grayscale's GBTC has seen a net increase of 963 BTC over the past week, not counting the amount added by the Mini ETF, which forms a stark contrast with ETH. Even during times of very tight liquidity, investors' limited funds are still concentrated primarily in BTC.
In the past week, the net purchasing power of twelve U.S. ETFs was 31,119.43 BTC, an increase of 685.34% compared to the previous week. This data also far exceeds that of ETH. Grayscale's net selling has transformed from 1,103.36 BTC two weeks ago to a net inflow of 1,232.71 BTC, indicating that Grayscale is no longer synonymous with BTC selling.

Other Cryptocurrencies
@MaoShu_CN
Altcoins did show some improvement over the weekend. Meme coins experienced a pullback, but caution is still warranted under the optimism. The oracle sector is rising, with API3 and DIA indicating increased on-chain activity, which can be seen as a positive signal for altcoins. APE surged after a pump announcement on October 20, reaching a high of over 100%, leading a joint rise in the metaverse and NFT sectors. Overall, the current market narrative seems to lack hotspots related to the metaverse and NFTs, so these hotspots should be approached with caution, as they may be altcoins taking the opportunity to become active before selling off. After all, in this cycle, the metaverse and NFT sectors have the lowest heat. However, I remain optimistic about the activity in the oracle sector, as last year's altcoin rally also began with the oracle sector, hoping it can once again activate market activity.
@0XENAS
He believes the market operates in mysterious ways, and we all have the opportunity to find some currencies that may bring excess returns, or to see a currency go to zero after being promoted by other KOLs. For him, he would choose $GOAT and $GNON, and he has already bottomed out on GOAT. He believes GOAT and GNON will become key positions for long-term trends in the future. If he is wrong, he will become the exit liquidity for others.