In-depth Research on Cross-Chain Bridges: From On-Chain Capital "Routers" to New Economic Engines for Value Capture

 The income earned by the cross-chain bridge per user and per locked dollar seems to be higher than that of many other protocols.
Author: Joel John
Compiled by: Deep Tide TechFlow
The killer application of cryptocurrency has emerged in the form of stablecoins. In 2023, Visa's transaction volume approached $15 trillion, while the total transaction volume of stablecoins was approximately $20.8 trillion. Since 2019, the transaction volume of stablecoins between wallets has reached 221 trillion.
In recent years, capital equivalent to global GDP has flowed through blockchains. Over time, this capital has gradually accumulated across different networks. Users switch between different protocols in search of better financial opportunities or lower transfer costs. With the emergence of chain abstraction, users may not even realize they are using cross-chain bridges.
Cross-chain bridges can be seen as routers for capital. When you access any website on the internet, there is a complex network in the background that ensures the bits and bytes displayed are accurate. A key component of this network is the physical router in your home, which determines how data packets are routed to help you obtain the desired data in the shortest time possible.
Cross-chain bridges play a similar role in today's on-chain capital. When users want to move from one chain to another, cross-chain bridges determine how funds are routed so that users receive maximum value or speed.
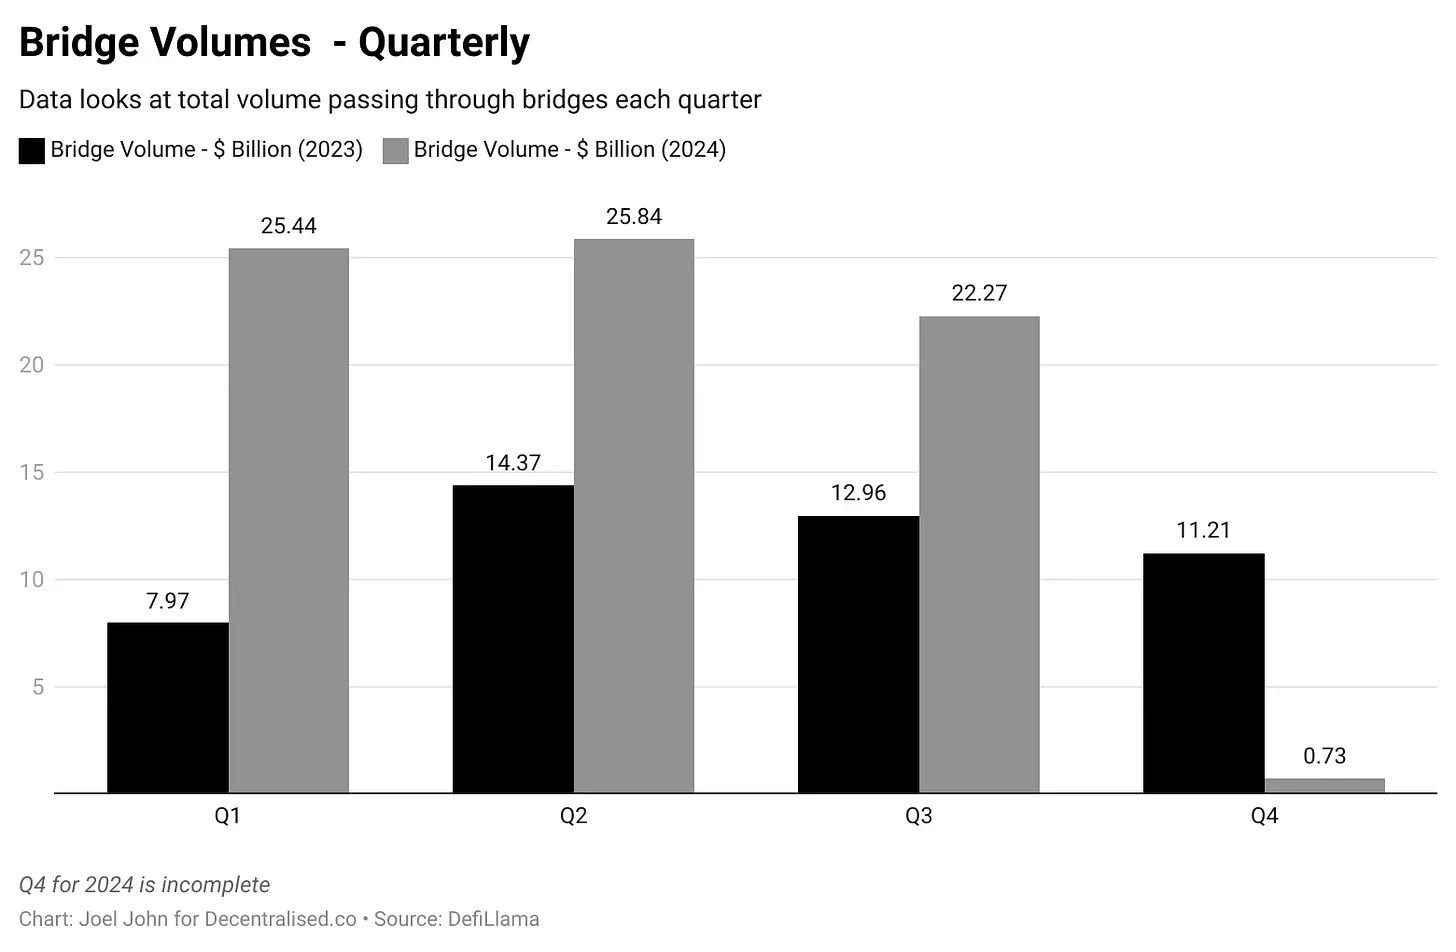
Since 2022, cross-chain bridges have processed nearly $22.27 billion in transactions. This is far less than the amount of funds flowing on-chain in the form of stablecoins. However, the revenue earned by cross-chain bridges per user and per locked dollar seems to be higher than many other protocols.
Today's discussion revolves around the business models behind cross-chain bridges and the collaborative exploration of revenue generated through cross-chain bridge transactions.
Revenue Showcase
Since mid-2020, blockchain cross-chain bridges have generated nearly $104 million in fees. This figure has a certain seasonality, as users flock to cross-chain bridges to use new applications or pursue economic opportunities. If there are no revenues, meme tokens, or financial instruments available, cross-chain bridges are affected, as users tend to stick to the protocols they are most familiar with.
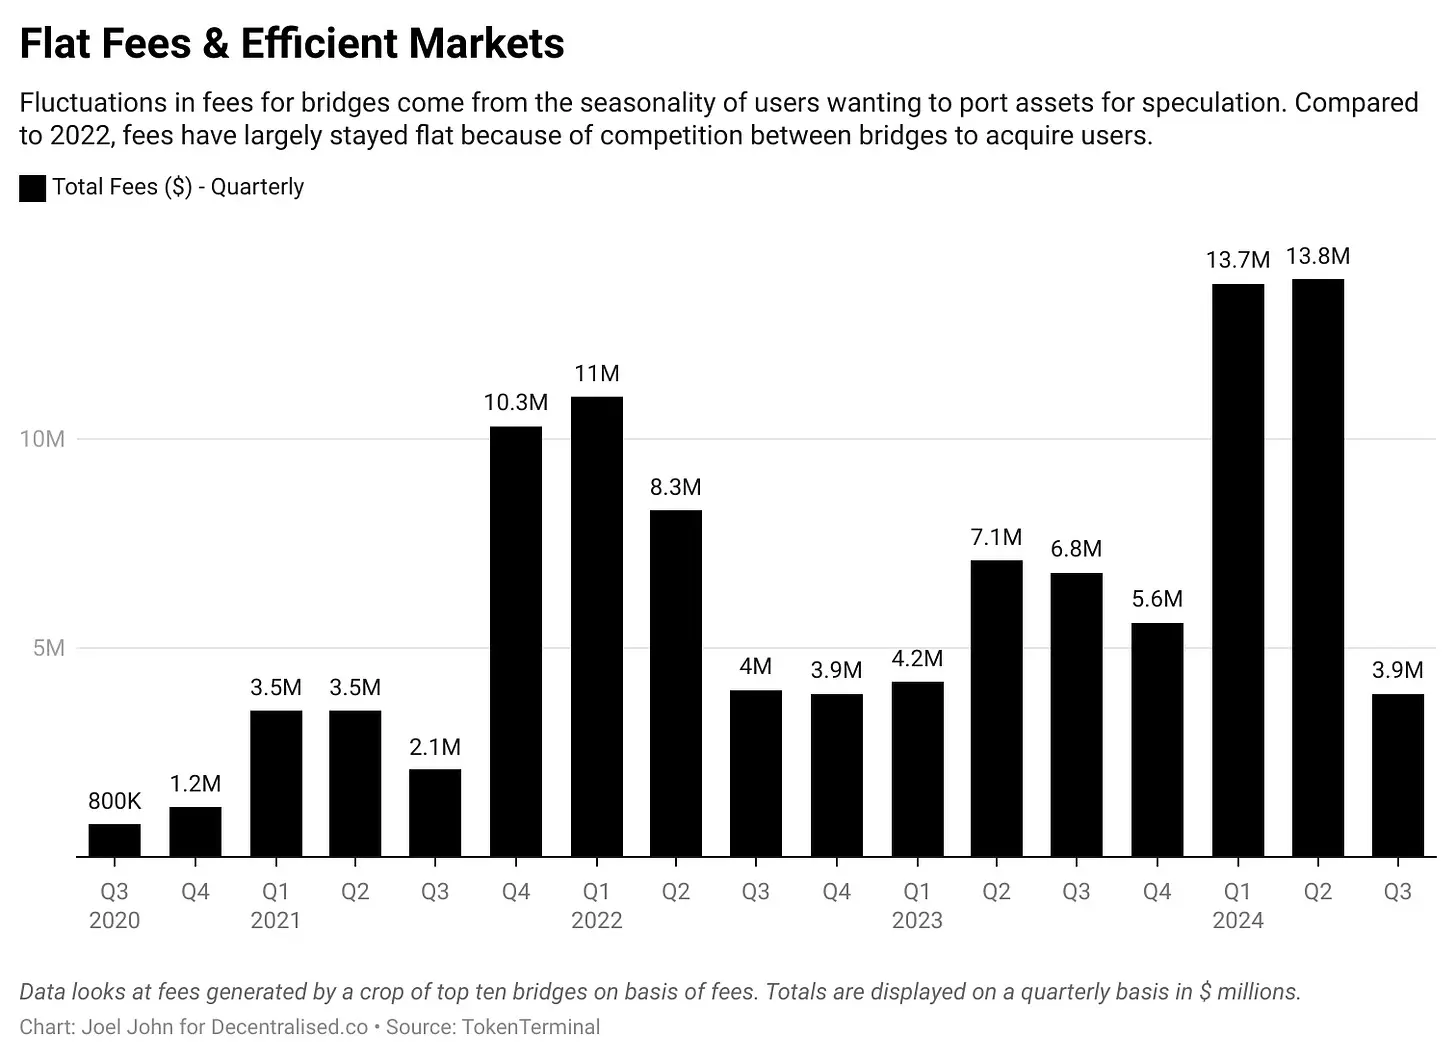
A rather sad (but interesting) comparison is to contrast cross-chain bridge revenue with that of meme-coin platforms like PumpFun. Their fee revenue is $70 million, while the fees generated by cross-chain bridges amount to $13.8 million.
Even with rising transaction volumes, the reason fees remain stable is the ongoing price war between chains. To understand how they achieve this efficiency, it is helpful to understand how most cross-chain bridges operate. One way to understand cross-chain bridges is to compare them to the Hawala network from a century ago.
Blockchain cross-chain bridges are similar to Hawala, connecting physically separated entities through cryptographic signatures.
While Hawala is now commonly associated with money laundering, a century ago, it was an efficient means of transferring funds. For example, in the 1940s, if you wanted to transfer $1,000 from Dubai to Bangalore—when the UAE was still using the Indian Rupee—you had several options.
You could choose to go through a bank, which might take several days and require a lot of paperwork, or you could go to the gold market and find a merchant. The merchant would take your $1,000 and instruct a trader in India to pay the equivalent amount to someone you trust in Bangalore. The funds would flow between India and Dubai without crossing borders.
So how does this work? Hawala is a trust-based system because the merchants in the gold market and the traders in India usually have long-standing trade relationships. They do not transfer funds directly but may settle balances later through goods (like gold). Because these transactions rely on mutual trust between participants, there is a significant need for confidence in the integrity and cooperation of both merchants.
What does this have to do with cross-chain bridges? The operational model of cross-chain bridges is similar in many ways. For instance, you might want to transfer funds from Ethereum to Solana in pursuit of yield, rather than moving from Bangalore to Dubai. Cross-chain bridges like LayerZero allow users to lend tokens on one chain and borrow on another by passing user information.
Imagine instead of locking assets or giving gold bars, these two traders give you a code that can be redeemed for capital at either location. This code acts as a means of information transfer. Cross-chain bridges like LayerZero use technology called endpoints. These endpoints are smart contracts that exist on different chains. A smart contract on Solana may not directly understand a transaction on Ethereum, which is where oracles come into play. LayerZero uses Google Cloud as a validator for cross-chain transactions. Even at the forefront of Web3, we still rely on Web2 giants to help us build a better economic system.
Imagine if the participating traders do not trust their ability to interpret the code. After all, not everyone can use Google Cloud to validate transactions. Another way is to lock and mint assets. In such a model, if you use Wormhole, you would lock your assets in a smart contract on Ethereum to receive a wrapped asset on Solana. This is akin to a Hawala merchant giving you gold bars in India while you deposit dollars in the UAE. The asset is minted in India and handed to you. As long as you return the gold bars, you can speculate with them in India and retrieve your original capital in Dubai. Wrapped assets on different chains are similar to gold bars—only their value typically remains constant across both chains.
The following diagram shows the various iterations of Bitcoin wrapping we see today. Many of these were minted during the DeFi summer to create yield using Bitcoin on Ethereum.

Cross-chain bridges have several key revenue points:
Total Value Locked (TVL) ------ When users deposit capital, these funds can be used to generate yield. Currently, most cross-chain bridges do not lend out idle capital but charge a small transaction fee when users move capital from one chain to another.
Relayer Fees ------ These are small fees charged by third parties (like Google Cloud in LayerZero) for each transfer. These fees are paid for validating transactions across multiple chains.
Liquidity Provider Fees ------ This is the fee paid to individuals who deposit capital into cross-chain bridge smart contracts. Suppose you are operating a Hawala network, and someone is transferring $100 million from one chain to another. As an individual, you may not have enough capital. Liquidity providers are those who pool funds to help complete the transaction. In return, each liquidity provider receives a small portion of the generated fees.
Minting Costs ------ Cross-chain bridges can charge small fees when minting assets. For example, WBTC charges 10 basis points for each Bitcoin. Among these fees, the main expenses for cross-chain bridges are maintaining relayers and paying liquidity providers. It creates value on TVL through transaction fees and minting assets at both ends of the transaction. Some cross-chain bridges also adopt incentive-based staking models. Suppose you need to transfer $100 million in Hawala funds to someone across the ocean; you might need some form of economic guarantee to ensure the other party has sufficient funds.
He might gather his friends in Dubai to co-invest to prove he can complete the transfer. In exchange, he might even return part of the fees. This operation is structurally similar to staking. However, instead of using dollars, users pool together to provide the network's native tokens in exchange for more tokens.
So, how much revenue can all this generate? What is the value of one dollar or one user in these products?
Economics
The following data may not be entirely accurate, as not all fees are captured by the protocol. Sometimes, fees depend on the protocol used and the assets involved. If cross-chain bridges are primarily used for low liquidity long-tail assets, it may lead to users experiencing slippage in transactions. Therefore, when looking at unit economics, I want to clarify that the following does not reflect which cross-chain bridge is superior. What we care about is how much value is created across the entire supply chain during cross-chain bridge events.
A good starting point is to look at the transaction volume and fees generated by each protocol over 90 days. This data covers metrics as of August 2024, so the numbers reflect the situation from the previous 90 days. We assume that Across has higher transaction volume due to its lower fees.

This provides a rough idea of how much capital flows through cross-chain bridges in any given quarter and the fees they generate during the same period. We can use this data to calculate the fees generated by cross-chain bridges for every dollar that passes through their systems.
For readability, I calculated the fee data generated by transferring $10,000 through these cross-chain bridges.

Before we begin, I want to clarify that this does not mean that Hop's fees are ten times those of Axelar. It means that in a $10,000 transfer, a cross-chain bridge like Hop can create $29.2 of value across the entire value chain (e.g., liquidity providers, relayers, etc.). These metrics will vary as they support different types and natures of transfers.
Interestingly, when we compare the value captured on the protocol with the value captured by cross-chain bridges.
To benchmark, we examined the transfer costs on Ethereum. As of the time of writing, during low gas fee periods, the fees on ETH are approximately $0.0009179, while the fees on Solana are $0.0000193. Comparing cross-chain bridges with L1s is somewhat akin to comparing routers with computers. The cost of storing files on a computer is much lower. But the question we need to address is whether cross-chain bridges capture more value than L1s from an investment target perspective.
From this perspective, combining the metrics above, one way to compare the two is to look at the dollar fees captured per transaction by individual cross-chain bridges and compare them with Ethereum and Solana.

The reason several cross-chain bridges capture fees lower than Ethereum is due to the gas costs incurred during cross-chain bridge transactions on Ethereum.
One might argue that the value captured by the Hop protocol is up to 120 times that of Solana. But this misses the point, as the fee models of the two networks are quite different. What we are interested in is the difference between economic value capture and valuation, as we will see shortly.
Among the top seven cross-chain bridge protocols, five have fees lower than Ethereum L1. Axelar is the cheapest, at only 32% of the average fees on Ethereum over the past 90 days. Currently, the fees for Hop Protocol and Synapse are higher than Ethereum. Compared to Solana, we can see that L1 settlement fees on high-throughput chains are several orders of magnitude cheaper than current cross-chain bridge protocols.
One way to further enhance this data is to compare the costs of transactions on L2s within the EVM ecosystem. For context, Solana's fees are only 2% of the regular fees on Ethereum. In this comparison, we will choose Arbitrum and Base. Since L2s are designed for extremely low fees, we will use different metrics to measure economic value—average daily fees per active user.
In the 90 days we collected data for this article, Arbitrum had an average of 581,000 users per day, generating an average of $82,000 in fees daily. Similarly, Base had an average of 564,000 users per day, generating $120,000 in fees.
In contrast, cross-chain bridges have fewer users and fees. The highest is Across, with 4,400 users generating $12,000 in fees. Therefore, we estimate that Across generates an average of $2.4 in fees per user per day. This metric can then be compared with the fees generated per active user on Arbitrum or Base to assess the economic value per user.


On average, users on cross-chain bridges are more valuable than users on L2s. The average user of Connext generates value 90 times that of an Arbitrum user. This is somewhat like comparing apples and oranges, as cross-chain bridge transactions on Ethereum incur relatively high gas fees, but it highlights two clear factors.
Funding routers like today's cross-chain bridges may be one of the few product categories in cryptocurrency that can generate significant economic value.
As long as transaction fees remain prohibitively high, we may not see users turning to L1s like Ethereum or Bitcoin. Users may be directly introduced to L2s (like Base), while developers may choose to absorb gas fees. Alternatively, users may only switch between low-cost networks.
Another way to compare the economic value of cross-chain bridges is to contrast them with decentralized exchanges. Both serve similar functions, facilitating token conversions. Exchanges allow for conversions between assets, while cross-chain bridges facilitate token conversions across blockchains.

The above data pertains only to decentralized exchanges on Ethereum.
I avoid comparing fees or revenues here and instead focus on the velocity of capital flow. Capital flow velocity can be defined as the number of times capital circulates between the smart contracts of cross-chain bridges or decentralized exchanges. To do this, I divide the transfer volume of cross-chain bridges and decentralized exchanges on any given day by their TVL.
As expected, the velocity of currency flow in decentralized exchanges is much higher, as users frequently swap assets multiple times in a day.
However, it is interesting to note that when excluding large L2-oriented cross-chain bridges (like the native cross-chain bridges of Arbitrum or Optimism), the currency flow velocity is not significantly different from that of decentralized exchanges.
Perhaps in the future, we will see cross-chain bridges limit the amount of capital they receive, focusing instead on maximizing revenue through increased capital flow velocity. That is, if a cross-chain bridge can circulate capital multiple times in a day and pass fees to a small portion of parked capital users, it will be able to generate higher revenue than other sources currently in cryptocurrency.
Such cross-chain bridges may have more stable TVL than traditional cross-chain bridges, as expanding the amount of parked capital may lead to reduced revenue.
Are Cross-Chain Bridges Routers?

Source: Wall Street Journal
If you think the influx of venture capital into "infrastructure" is a new phenomenon, consider revisiting history with me. In the 2000s, when I was a child, Silicon Valley was enthusiastic about Cisco. Logically, if internet traffic increased, routers would capture significant value. Like today's NVIDIA, Cisco was a high-priced stock because they built the physical infrastructure that supports the internet.
The stock peaked at $80 on March 24, 2000, and as of the time of writing, it trades at $52. Unlike many internet bubble stocks, Cisco's stock price never recovered. Writing this article in the context of the meme-coin frenzy makes me ponder to what extent cross-chain bridges can capture value. They have network effects, but it may be a winner-takes-all market. This market is increasingly trending towards intent and solver-based models, with centralized market makers filling orders in the background.
Ultimately, most users do not care about the level of decentralization of the cross-chain bridge they use; they only care about cost and speed.
In such a world, the cross-chain bridges that emerged in the early 2020s may resemble physical routers, closer to being replaced by intent or solver-based networks, akin to the 3G of the internet.
Cross-chain bridges have reached a mature stage, and we are seeing various approaches to solving the age-old problem of cross-chain asset transfers. One of the main drivers of this transformation is chain abstraction, a mechanism for transferring assets across chains that allows users to complete asset transfers without even realizing it. Shlok recently experienced this through Particle Network's universal account.
Another way to drive transaction volume is through innovation in distribution or positioning in products. Last night, while researching meme coins, I noticed how IntentX leverages intent to integrate Binance's perpetual market into decentralized exchange products. We also see cross-chain bridges for specific chains evolving to make their products more competitive.
Regardless of the approach taken—it's evident that cross-chain bridges, like decentralized exchanges, are hubs for large capital flows. As an infrastructure, they will continue to exist and evolve. We believe that cross-chain bridges for specific domains (like IntentX) or user-specific cross-chain bridges (enabled by chain abstraction) will be the main drivers of growth in this field.
Shlok added a point while discussing this article, noting that past routers never captured economic value based on the amount of data transmitted. Whether you download a TB or a GB, Cisco makes about the same amount of money. In contrast, cross-chain bridges earn based on the number of transactions they facilitate. Thus, in many respects, they may have different fates.
Currently, it is safe to say that the phenomena we see on cross-chain bridges resemble the development of the physical infrastructure for internet data routing.