The Great Immortal said: The inflation indicator will be announced on August 13. Will the interest rate cut arrive as scheduled?

 The market is closely watching these inflation indicators to confirm that inflation is moving further in the right direction.
Tonight at 20:30, the United States will announce the Producer Price Index (PPI), and tomorrow the Consumer Price Index (CPI) will be released. The market is closely watching these inflation indicators to confirm that inflation is developing in the right direction, especially with the general expectation that the Federal Reserve will cut interest rates in the second half of the year. If the PPI and CPI continue to rise, it indicates increasing inflation pressure, and the Federal Reserve may maintain or raise interest rates to curb inflation. Conversely, if the PPI and CPI decline, it suggests easing inflation pressure, and the Federal Reserve may cut rates to stimulate economic growth.
Bitcoin experienced significant volatility around 10 PM last night, quickly dropping below $58,000 and then rapidly breaking through the $60,000 mark within an hour. Unfortunately, it could not hold that level, and selling pressure emerged, causing Bitcoin's price to drop back below $59,000. As of the time of writing, the price is $58,984, up 2.1% in the last 24 hours.
Bitcoin 4-hour chart

First, according to the Bollinger Bands indicator on the 4H chart of Bitcoin, the current price is operating between the middle and lower bands, indicating that it is in a consolidation phase with no clear signs of upward or downward breakout. The distance between the upper and lower bands is relatively small, and the Bollinger Bands are gradually narrowing, suggesting that there may be significant volatility in the future.
Second, based on the KDJ indicator on the 4H chart of Bitcoin, the K and D values are intertwined below 50, while the J value is relatively stable, indicating that the current market is weak with no clear trend direction. However, the indicators are currently at a low level, showing signs of being oversold, although there are no clear rebound signals.
Finally, according to the MACD indicator on the 4H chart of Bitcoin, the DIF and DEA lines are operating below the zero axis, and the DIF line is approaching the DEA line, showing signs of forming a golden cross, but it has not fully formed yet. The histogram in the MACD does not show significant decreases or increases.
Bitcoin 1-hour chart
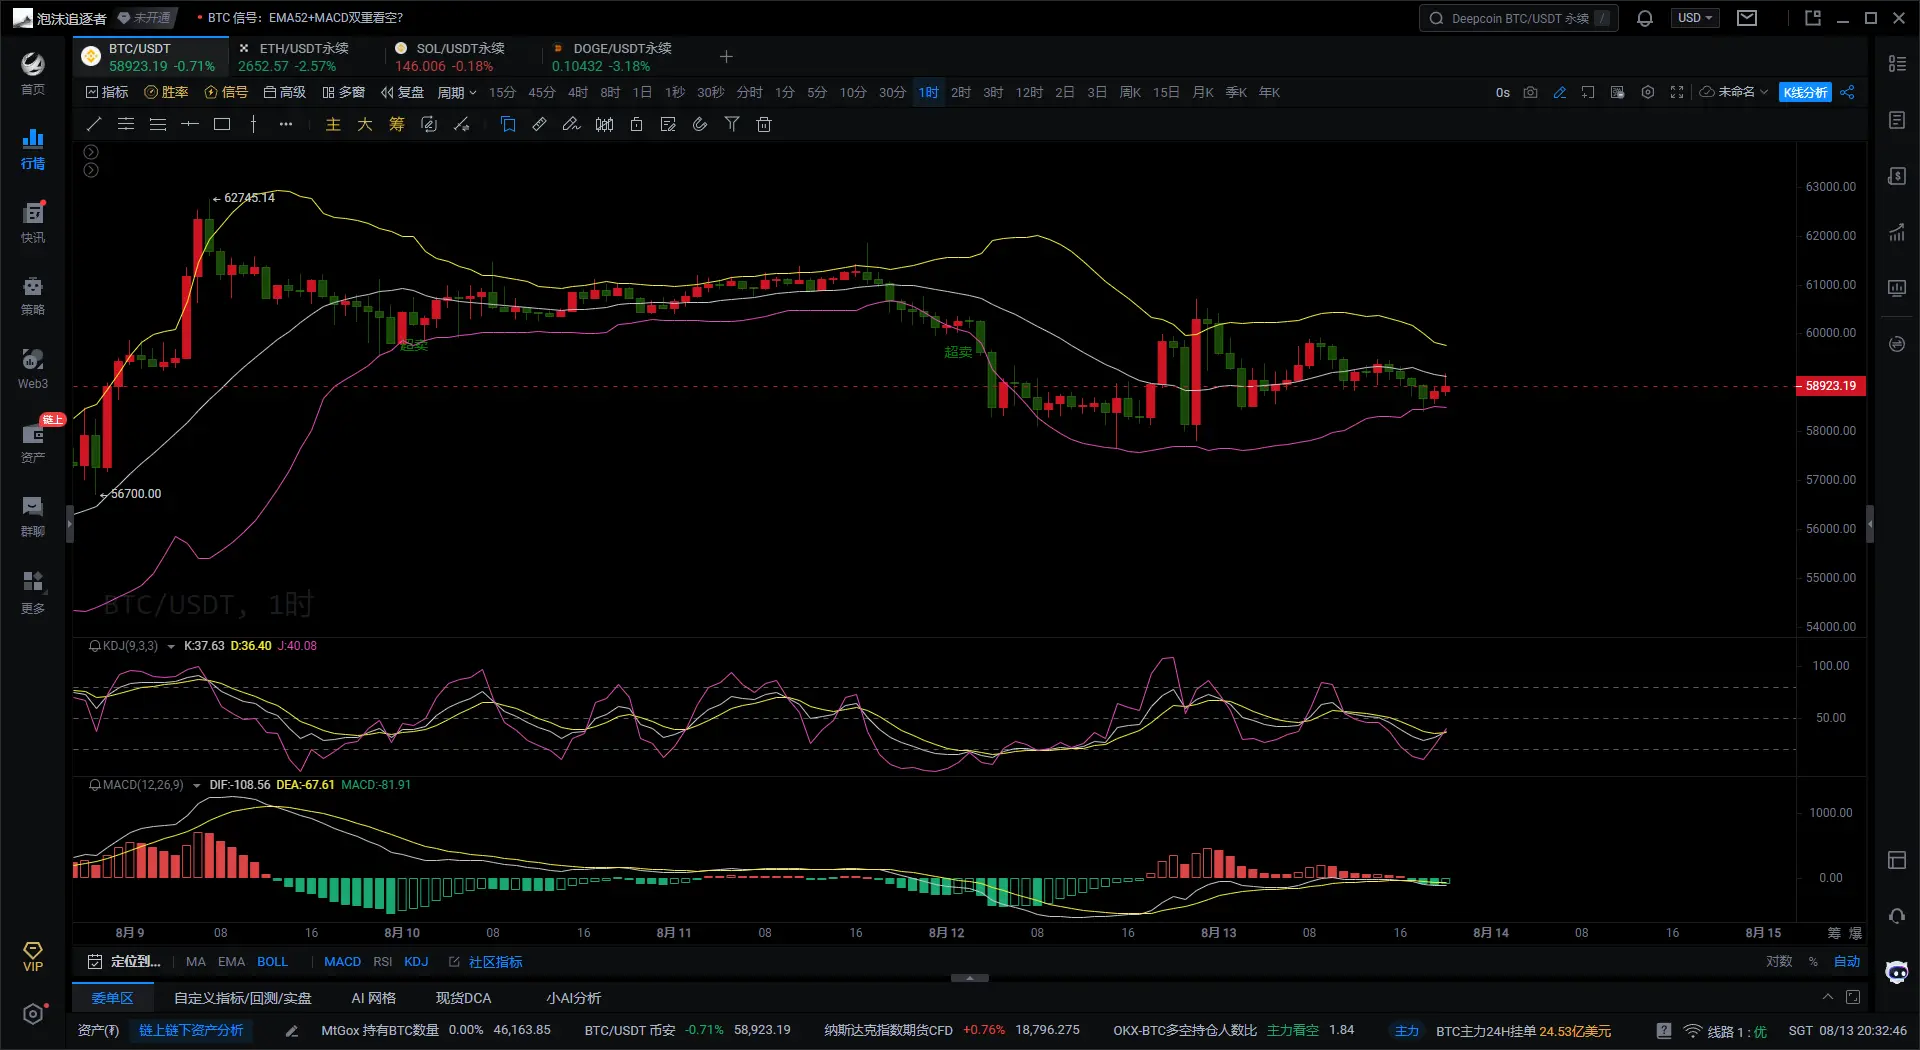
First, according to the Bollinger Bands indicator on the 1H chart of Bitcoin, the current price is operating between the middle and lower bands, indicating that Bitcoin's price is in a consolidation state in the short term. The distance between the upper and lower bands is relatively narrow, suggesting that market volatility is low, but significant price fluctuations may be on the horizon.
Second, based on the KDJ indicator on the 1H chart of Bitcoin, the K and D values are operating below 50, but the J value shows signs of rising, indicating that there are signs of an oversold rebound in the current price. Although there are some rebound signs, there is no clear breakout, and more signals are needed to confirm the future trend.
Finally, according to the MACD indicator on the 1H chart of Bitcoin, the DIF line is operating below the DEA line and is crossing downwards, showing a trend towards forming a golden cross. The MACD histogram is mainly green, indicating that it is still in a bearish trend, with no clear reversal signals at present.
In summary, the comprehensive analysis shows that Bitcoin is currently in a consolidation phase on the 4H level and may be in an oversold area. However, the narrowing of the Bollinger Bands suggests that significant price fluctuations may soon occur. The MACD indicator shows weakening downward momentum, while the KDJ indicates market weakness. In the short term, Bitcoin may continue to consolidate. The 1H level also shows that it is in a consolidation phase. The Bollinger Bands indicate low volatility, but the MACD and KDJ indicators suggest potential for a short-term rebound. If the Bollinger Bands break out or the MACD forms a golden cross, a short-term upward trend may occur.
Based on the above, the following suggestions are provided for reference:
Short Bitcoin at 59,500-59,800, with a stop loss at 60,300 and a target of 58,000. (Valid before the CPI data is released on Wednesday night)
Time of writing: (2024-08-13, 20:00)