
The Great Immortal said: On July 10, the inflow of Bitcoin spot ETFs was extremely high, and the price climbed upward

 The market needs to absorb the selling pressure from the German government's liquidation and the repayments from Mt. Gox to creditors, and this situation is expected to last until interest rate cuts begin.
Recently, under the backdrop of the German government continuously selling Bitcoin and the Mt. Gox exchange starting to repay creditors, Bitcoin has repeatedly dipped. However, yesterday Bitcoin climbed amidst fluctuations, breaking through to $59,400 around noon today, with intense battles between bulls and bears. As of the time of writing, the Bitcoin price is $58,400, up 2.45% in the last 24 hours.
** The main reason for Bitcoin's rebound in the past two days is that the German sale of $200 million worth of Bitcoin has not truly entered the market; additionally, on July 8, Bitcoin spot ETFs achieved a net inflow of $295 million, the highest level in 21 days, providing good support for Bitcoin's price.**
** Although Bitcoin may slowly rise and reach the $60,000 mark, the expert believes this wave of increase may be temporary, with certain downward risks still present in the medium-term trend. From a technical perspective, a short-term bottom has formed around $55,000-$56,000. Considering the decline in investor panic towards the market, a rebound in Bitcoin's price is inevitable. However, the market needs to absorb the selling pressure from the German government's sales and the repayments from Mt. Gox to creditors, which is expected to continue until interest rate cuts begin.**
** Bitcoin 4-hour chart **
**
** Firstly, according to the Bollinger Bands indicator on the 4H level chart of Bitcoin, the current price is operating between the upper and middle bands and is sliding down from the upper band, indicating that there is certain retracement pressure. The widening of the Bollinger Bands suggests that subsequent market fluctuations will be significant.**
** Secondly, based on the KDJ indicator on the 4H level chart of Bitcoin, the current KDJ three-line values are forming a death cross signal in the overbought zone, which is a clear sell signal, indicating that the price will undergo a correction.**
** Finally, according to the MACD indicator on the 4H level chart of Bitcoin, the DIF line and DEA line are operating just above the 0 axis but show signs of turning down. If a death cross forms as it turns down, the price will further decline. The MACD red histogram is starting to shrink, indicating that bullish momentum is slowing down, and caution is needed regarding the possibility of a correction.**
** Bitcoin 1-hour chart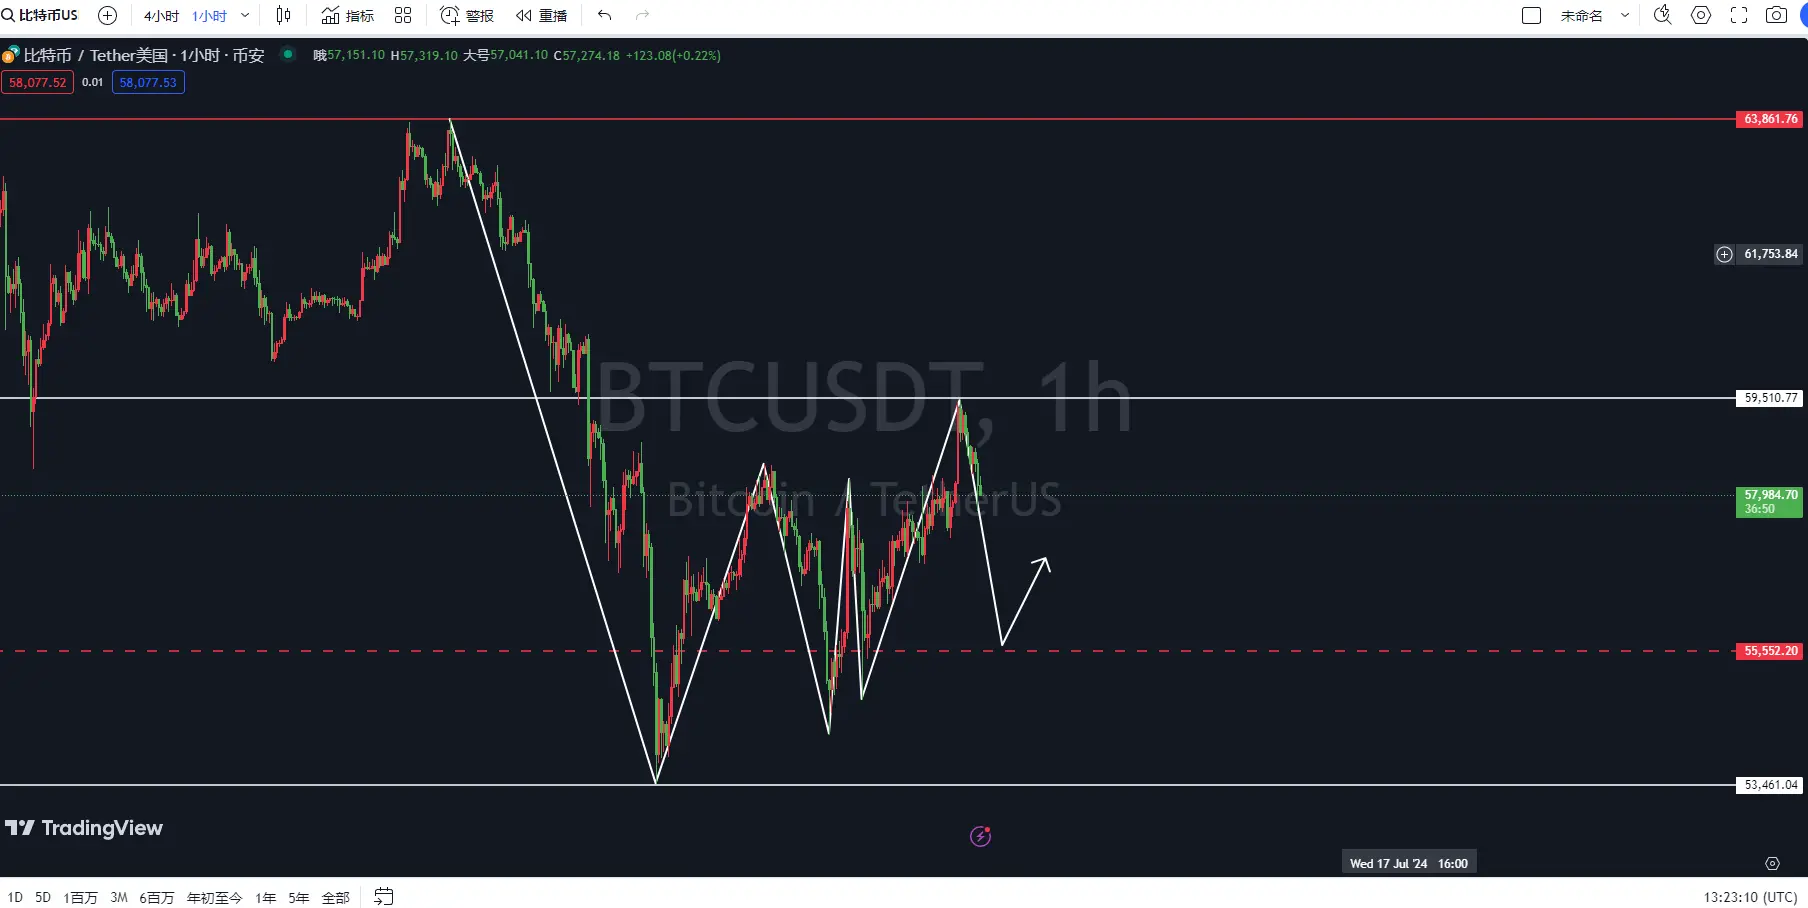 **
**
** Firstly, according to the Bollinger Bands indicator on the 1H level chart of Bitcoin, the current price is above the middle band but approaching the lower band, which may test the support of the lower band in the short term. The wide opening of the Bollinger Bands indicates significant market fluctuations, and caution is needed regarding risks from these fluctuations.**
** Secondly, based on the KDJ indicator on the 1H level chart of Bitcoin, the K line value and D line value are forming a death cross signal at the midpoint, and the J line value has fallen below 50, indicating further weakness in the short term.**
** Finally, according to the MACD indicator on the 1H level chart of Bitcoin, the DIF line and DEA line are forming a death cross phenomenon downward above the 0 axis, and the MACD green histogram is gradually increasing, indicating that the price will further decline.**
** Comprehensive analysis: Bitcoin shows signs of a potential correction in the short term on both the 4-hour and 1-hour level charts. Both the MACD and KDJ indicators indicate a weakening of upward momentum, and the Bollinger Bands also show potential resistance and support levels that the price may face.**
** In summary, the expert provides the following suggestions for reference**
** Short Bitcoin around $58,300, targeting $57,300, with a break looking at $56,700, and a stop-loss at $59,000.**
** Time of writing: (2024-07-10, 20:40)**
** (Article by - Expert on Cryptocurrency)**


