
The Great Immortal said: The listing of the 6.30 Ethereum spot ETF has been postponed again, and the price has fallen accordingly

 The SEC has returned the S-1 form to the Ethereum spot ETF issuers, requesting them to address the issues and resubmit the documents with updated filings by July 8.
Recently, all news in the Ethereum market points to the approval progress of the Ethereum spot ETF. Although the market believes that the approval process has entered its final stage, it was revealed yesterday by relevant sources that the estimated listing date has been postponed from the originally planned July 2nd to after July 8th.
According to insiders, the SEC has returned the S-1 form to the issuer of the Ethereum spot ETF with a few minor comments, requesting them to address the issues and resubmit the documents. The issuer has been asked to respond to these comments and submit the updated documents before July 8th, which will need to undergo at least one more round of review before approval can take effect. Only then can the Ethereum spot ETF begin trading. Following this news, Ethereum's price fell again, dropping from an intraday high of $3487 to around $3365, and as of the time of writing, the price is quoted at $3391, down 1.3% in the last 24 hours.
Ethereum 4-hour chart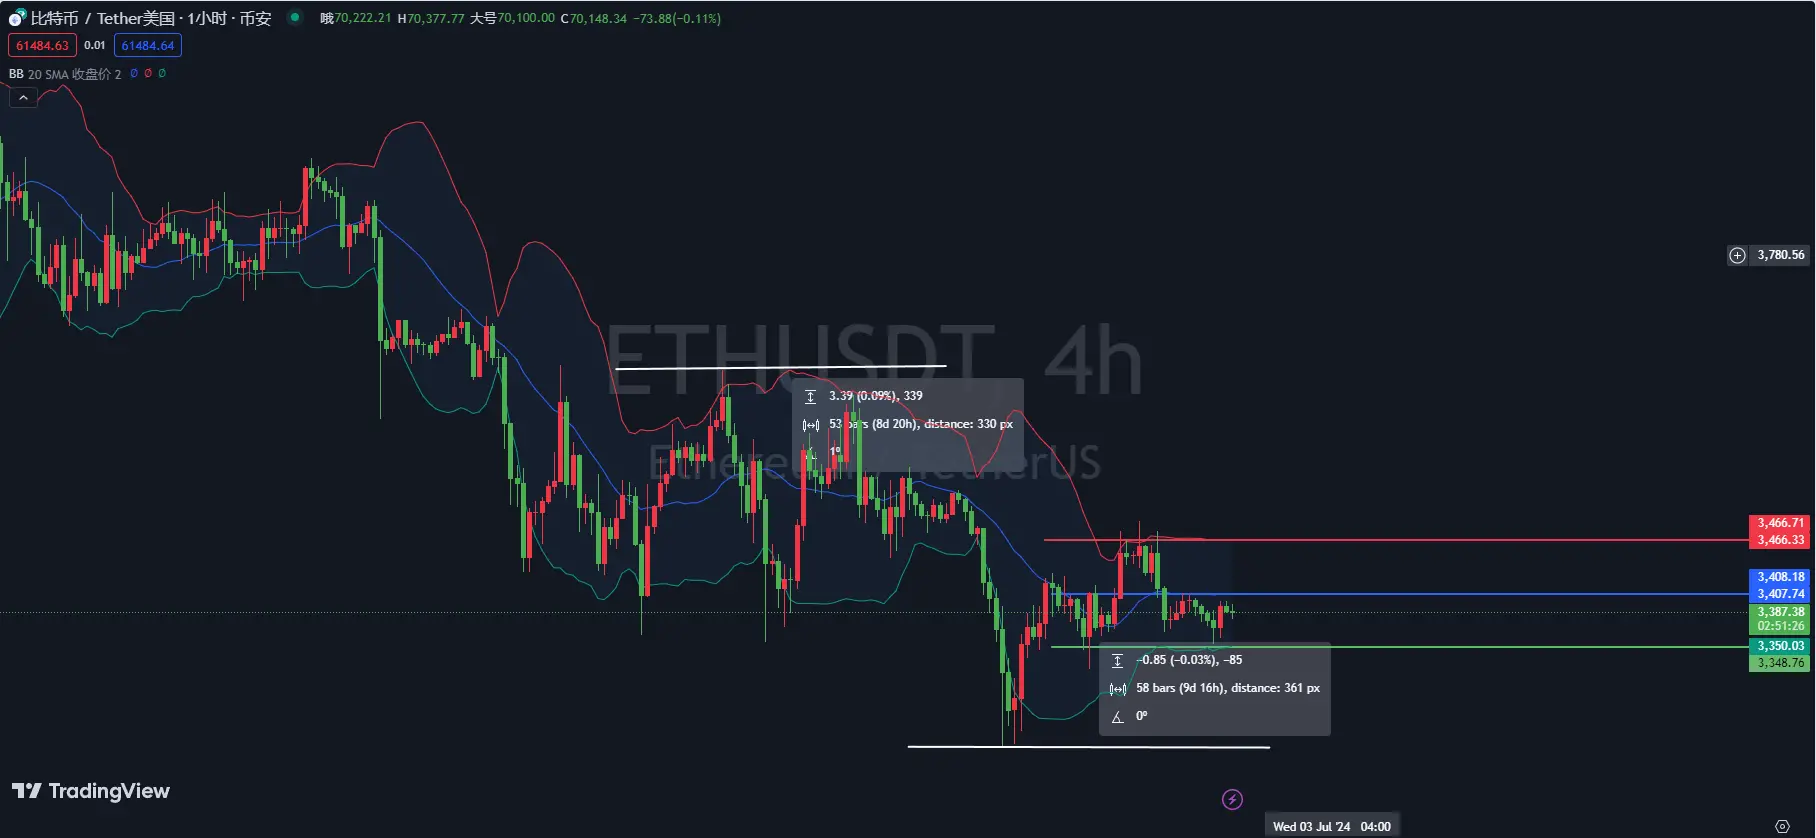
First, according to the Bollinger Bands indicator on the Ethereum 4H chart, the current price is fluctuating between the middle and lower bands, consolidating near the middle band. If the price can effectively break through the middle band and hold above it, it may move upward. If it cannot break through the middle band or moves towards the lower band, the market will continue to decline.
Second, based on the KDJ indicator on the Ethereum 4H chart, the K and D lines are forming a golden cross upwards, and the J line is rapidly rising close to the overbought zone, indicating that there is still some upward space in the short term. However, it is necessary to pay attention to whether the J line's turning point can continue above.
Finally, according to the MACD indicator on the Ethereum 4H chart, the DIF line and DEA line are operating below the zero axis, and there is a trend of convergence between the two lines. If the DIF line breaks upwards to form a golden cross with the DEA line, there will be an upward trend in the short term. However, if it continues to stay below the DEA line, the bearish market will persist.
Ethereum 1-hour chart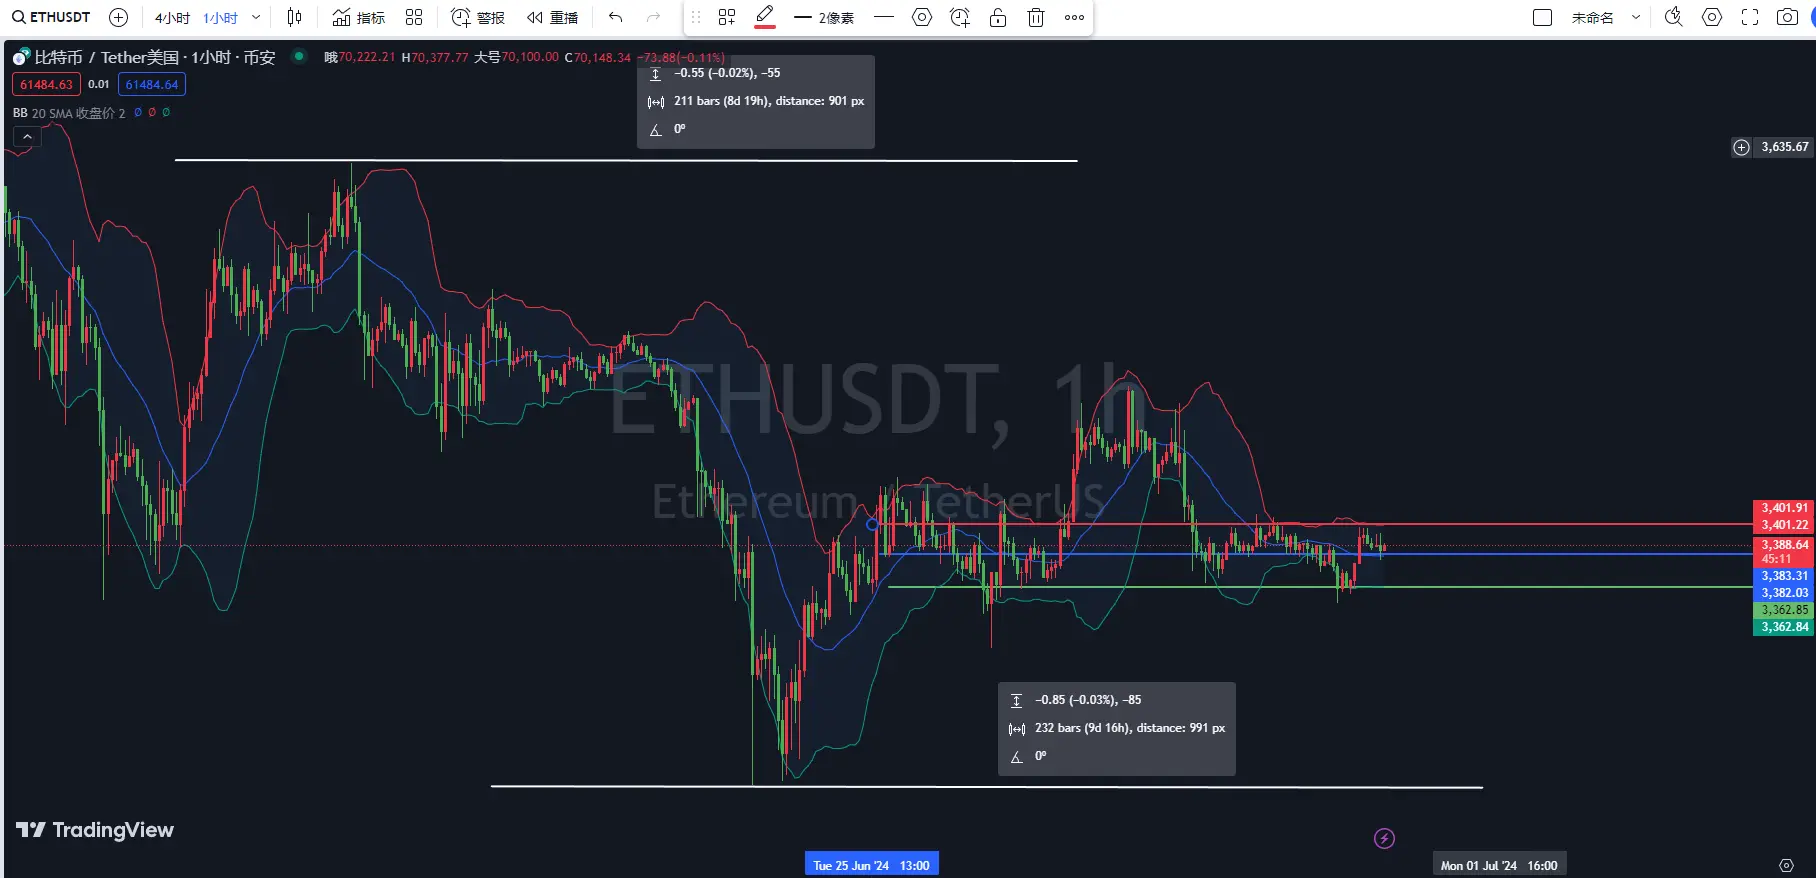
First, according to the Bollinger Bands indicator on the Ethereum 1H chart, the current price is operating between the middle and upper bands, indicating that there is some upward space. However, the upper band presents strong resistance, and it has not effectively broken through the upper band. If the price can find support at the middle band, it will continue to test the upper band. If it fails to find effective support at the middle band, it will reverse and trend downwards.
Second, based on the KDJ indicator on the Ethereum 1H chart, the three KDJ lines are currently operating around 80, in the overbought area, and the K and D lines show a trend of turning downwards, indicating a possibility of a pullback in the short term.
Finally, according to the MACD indicator on the Ethereum 1H chart, both the DIF line and DEA line are operating near the zero axis, and the MACD red histogram is starting to shorten, indicating that the bulls are losing strength and a bearish reversal signal is about to appear.
Comprehensive analysis: From the Bollinger Bands perspective, the current price is between the middle and upper bands, showing some upward space, but it is supported by the middle band, so attention should be paid to the strength of the middle band's support. The KDJ indicator shows that it is in the overbought area, with a risk of a pullback, and there may be some adjustments in the short term. The MACD indicator shows that the bullish strength is weakening, and there may be a risk of a bearish reversal.
In summary, the following suggestions are provided for reference:
Short Ethereum on a rebound to the 3395-3400 range, targeting 3360-3345, with a stop loss at 3420.
Time of writing: (2024-06-30, 20:00)


