Where is the value of memes? Exploring the financial and social attributes of memes

 Every market cycle is accompanied by the emergence of Meme tokens. A group of people gathers around a certain Meme, temporarily driving up the price of an asset (ranging from a day to several months). In the cryptocurrency space, this has become a popular market strategy, covering everything from the blockchain layer to the application layer, as it not only boosts prices but also attracts attention to the ecosystem. Some projects, like Avalanche, have even established dedicated Meme token funds.
Original Title: “A Social and Financial Study of Memecoins”
Author: Andrew Hong
Compiled by: Chris, Techub News
Every market cycle is accompanied by the emergence of meme tokens. A group of people gathers around a certain meme, temporarily driving up the price of an asset (ranging from a day to several months). In the cryptocurrency space, this has become a popular market strategy, covering everything from the blockchain layer to the application layer, as it not only boosts prices but also attracts attention to the ecosystem. Some projects, like Avalanche, have even established dedicated meme token funds.
The boundary between meme tokens and other types of cryptocurrencies may not be very clear, but typically, the value of meme tokens is primarily supported by the meme culture associated with them, rather than actual economic activity or technical support. For example, DOGE is mainly supported by the image of the Shiba Inu and related concepts. In contrast, tokens like ETH, UNI, or MKR are supported by more complex technical and economic mechanisms, such as the Ethereum network, Uniswap protocol, or collateralized stablecoin services.
Farcaster's meme tokens (like DEGEN) are the latest style of tokens, with the main advantage being that social media information and community discussions are completely open. Therefore, I would like to analyze social media information, community discussion levels, and financial data using some basic data.
1. Measuring Meme
I first assume that we can compare the financial and social conditions of all memes through a chart:
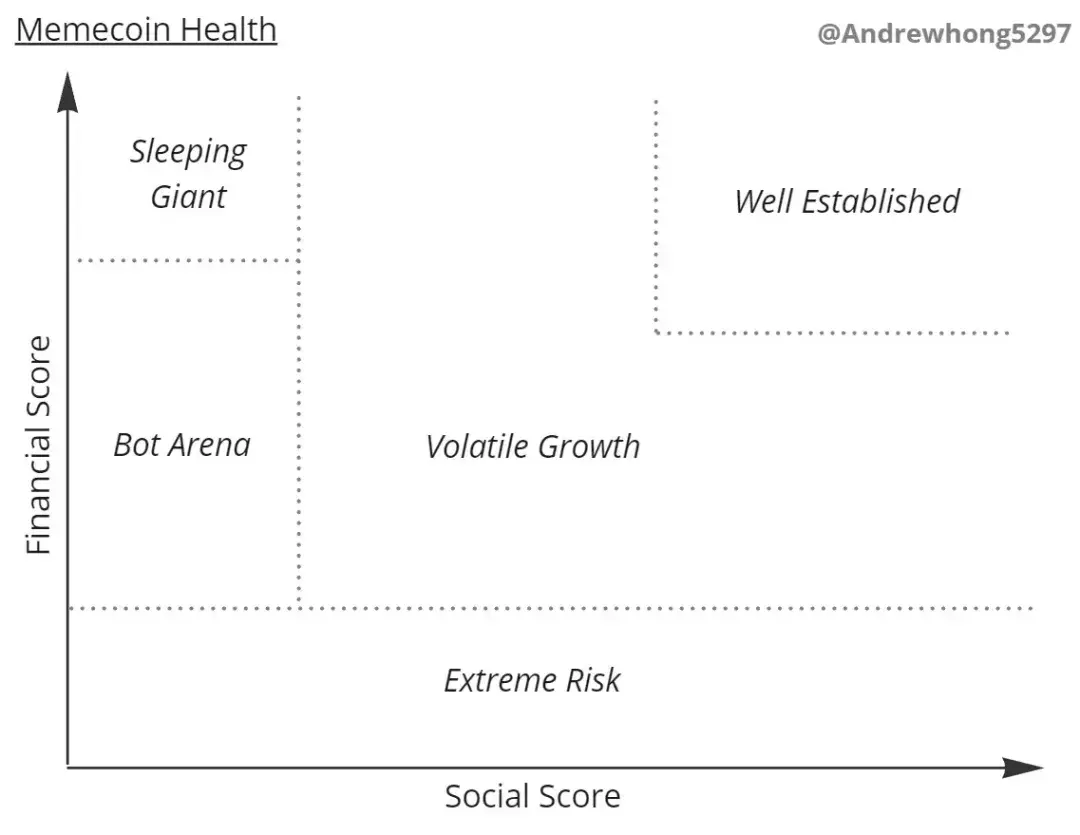
In this chart, I categorized five main areas:
- Extreme Risk: Meme tokens with low liquidity and trading volume are very dangerous and prone to sell-offs (as there may only be a few providing liquidity);
- Bot Arena: Most meme tokens will never escape this stage, where thousands of coins (many with the same token name/variant) compete for community and funding attention;
- Volatile Growth: Those meme tokens that break out of their initial circles must now maintain their momentum and growth. You may see prices fluctuate by 100-500% within a day, in different directions, while a bunch of KOLs begin to pay attention to this meme.
- Well Established: Leaders will remain at the top of social media platforms and funding for a long time, clearly distinguishing themselves from other meme tokens. Weekly numbers may not fluctuate much, and attention is sustained as inflows and outflows reach a balance.
- Sleeping Giant: Those meme tokens that grow rapidly in community and funding but have not suffered sell-offs may remain dormant in this corner for a while. A DAO may have formed, and they start to manage community chaos. Meanwhile, they hope to regain the spotlight.
Most meme tokens should be stuck in the "Bot Arena," with some attractive meme tokens located in the "Volatile Growth" segment, and possibly one or two reaching the "Well Established" meme tokens. In this process, some may lose social power and become "Sleeping Giants," while others may lose financial support (liquidity) and become "Extreme Risk."
I believe a successful meme token typically goes through the following stages:
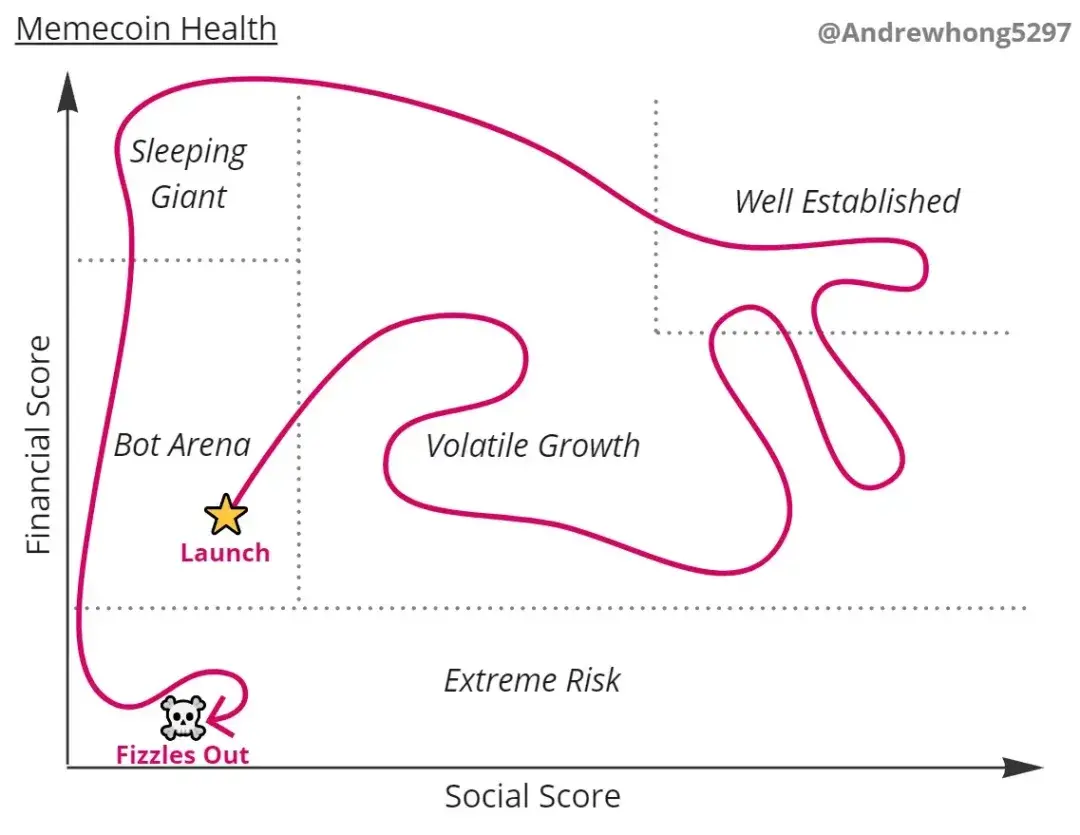
You may see many meme tokens driven by bots/KOLs, gaining high social scores but having low funding scores (liquidity), leading to sell-offs.
After extensive data collection and organization, I created this chart about Farcaster meme tokens on Dune:

In fact, it aligns very well with my expectations; you can see DEGEN far in the upper right corner, along with some others like ENJOY, HIGHER, TN 10 0X, and EVERY in the middle. Everyone else is stuck on the left, competing for attention and liquidity.
It is worth noting that I did not filter out bots here, so some meme tokens' social scores may be skewed. This is a direction for future improvement!
Now, let's reverse-engineer how these two scores were created from the final chart. I will also propose further research questions and detail my query sources for those who wish to dig deeper.
The Dune dashboard can be found here, along with some charts that I did not cover in this article.
2. Social Score
Each score consists of a "Base" component and a "Growth" component. For the social score, we first measured the casts (posts) mentioning the token and the engagement. Therefore, in this approach, "$DEGEN" would be counted, but "DEGEN" would not.
The above provides us with five main columns:
- Throwers: The number of people thrown to a fixed category
- Receivers: The percentage of throwers who have previously received the token
- Throw Count: The number of times thrown to a fixed category
- Channels: The number of channels that have thrown to a fixed category
- Activity Level: Engagement (likes + replies) plus the cube root of throw count multiplied by the number of channels.
- Activity Level: Engagement (likes + replies) plus the cube root of throw count multiplied by the cube root of throwers multiplied by the cube root of channels.
The overall social score is based on the "Activity Level" as the "Base," and the "Growth" multiplier is based on the changes in the throw amounts of throwers and receivers over a week. The idea here is that if you see a significant increase in the number of people thrown to a fixed category and those people buying/getting the token, that is an extremely healthy sign.
Overall, it looks like this in the table:

3. Financial Score
Here are the main financial metrics:
- FDV: Total supply multiplied by price
- Price: Latest price based on DEX trading
- Daily Growth, Weekly Growth, Monthly Growth Price Changes: Percentage changes in price on a daily, weekly, and monthly basis
- Liquidity: This is non-token liquidity, meaning for the DEGEN-WETH pool, we only calculate the WETH portion. This gives us a more stable indication of how much good liquidity a given token has.
- Trades: Number of DEX trades in the past 30 days
- Transfers: Number of ERC-20 token transfers in the past 30 days
- Total Trading Volume: Dollar trading volume of DEX trades in the past 7 days
The "Base" of the financial score is its non-token liquidity and DEX trading volume, while the "Growth" part is based on changes in liquidity.
Overall, it looks like this in the table: