Analysis Report on 2 Million Airdrop Addresses: Only 25% of Tokens Increased After Airdrop, Widespread Airdrops Led to a 2x Increase in Sellers

 The scale of airdrops has no significant impact on price performance or volatility, and "low circulation" may not be the main driver of price fluctuations.
Original Title: 《Airdrops: An Analysis of Over 2,000,000 Events》
Author: MUSTAFA & IMAGECARL
Compiled by: Deep Tide TechFlow
Airdrops have become quite common as part of Token Generation Events (TGE), but research on them is relatively scarce. The mechanism is simple—distributing newly minted tokens to suitable wallets to help establish initial circulation, enable on-chain governance, drive transactions, reward early contributors, and potentially attract new users.
We believe that such a ubiquitous token design element warrants quantitative research to determine best practices. We collected data on over 2 million airdrop events across 40 protocols and analyzed the two most important choices faced by token designers:
How much supply of tokens should be airdropped?
Who should be eligible to participate in my airdrop?
We employed various methods to answer these questions, including price performance, volatility, and wallet activity. Our analysis and dataset will be made public (forthcoming), and we encourage contributors to help expand the dataset and analysis.
Dataset
Our final dataset includes 40 airdrop events across 40 protocols and the activities of 2,098,698 unique wallets. It is important to note that we only used airdrops from 2023 and earlier.
We analyzed events for the following 40 tokens:

For each of these protocols, our analysis focused on the aforementioned metrics: eligibility type and airdrop size.
Eligibility Type
"Eligibility type" is divided into "broad users" and "core users." In the former, the protocol airdrops tokens to general ecosystem users; for example, a new DePIN protocol airdrops tokens to wallets that participated in other DePIN protocols within a fixed timeframe, or to specific on-chain communities (like NFTs). In the latter case, the protocol only rewards users who directly participated in the protocol prior to the token launch. Fundamentally, these approaches distinguish between two choices: should airdrops primarily serve as marketing and growth tools, or should they focus on rewarding those users who were most active during the protocol's launch?

Airdrop Size
Another key factor is "airdrop size," which refers to the percentage of total supply allocated to the airdrop. The motivation here is straightforward: is there a certain "optimal" range for airdrop size? The allocation sizes in our dataset are as follows:
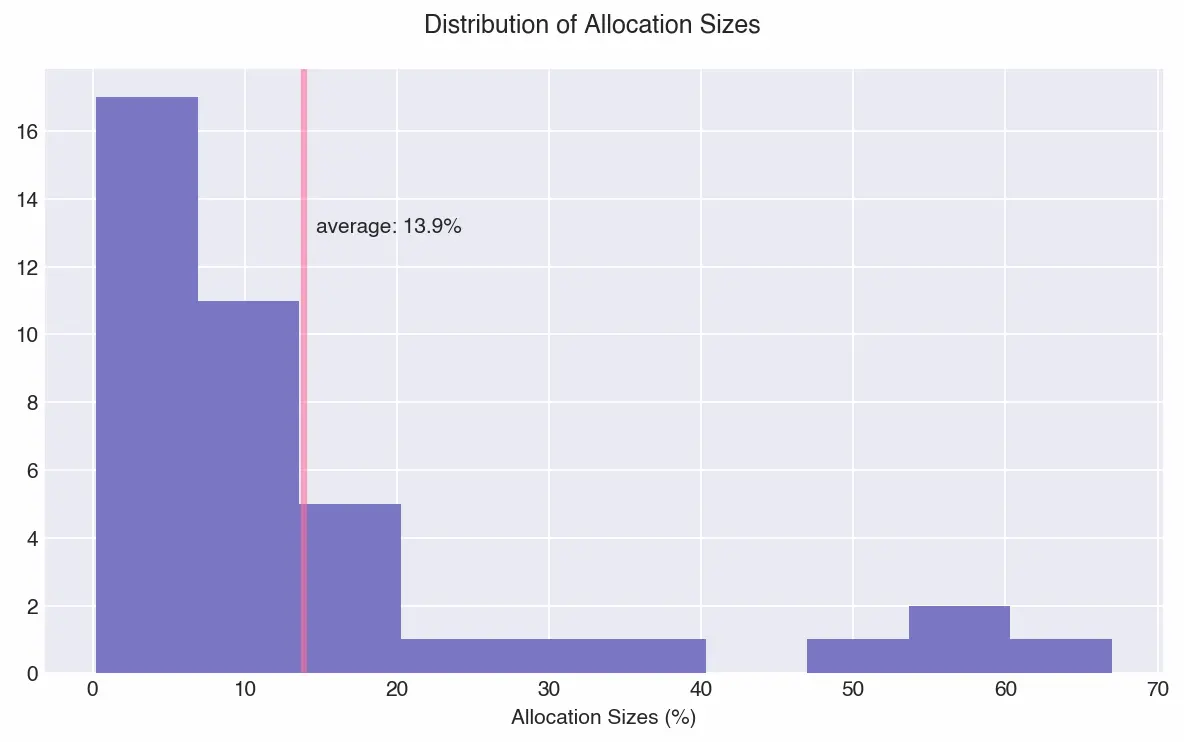
The median allocation size is about 10%, which gives us a relatively even distribution of 19 small airdrops and 21 large airdrops.
Classification
The goal of classifying events is to compare overall design choices. To this end, we organized the events into four different combinations:

Analysis and Insights
It is important to clarify that our analysis aims to balance rigor and insight—using only price data or wallet data makes it difficult to prove causality, especially in a multi-factor environment like the token market. We can observe that certain design combinations perform better than others, but we do not claim to strictly prove that these design combinations perform better as a result of these design choices. We believe that some combinations of factors, particularly airdrops, may lead to differences in average price performance across categories.
Price and Volatility Effects
An important metric for measuring airdrop effectiveness is price impact. We aim to measure price effects within the time window that airdrops may influence. Since most airdrops occur at TGE, there are some confounding factors when analyzing price data. We collected price data for two months post-airdrop, standardized by crypto index (see appendix), and calculated the percentage change in price. Note that our starting price is based on the 24 hours post-airdrop, allowing for some initial price discovery (i.e., immediate sellers).

Price Changes Post-Airdrop
Among the 40 airdrops, only 10 saw price increases two months after the airdrop. While we observe a wide range of performance, when we measure the four categories (as shown below), they all tend to decline by 10-40% in price after 60 days. This aligns with the significant cliff distributions we observed in our token unlocking article. Large anticipated token distribution events (over 1% of token supply) typically create selling pressure and stabilize at lower levels over time. This effect is most likely to be amplified in the accumulation of airdrop events.


We can draw some interesting insights:
Large + broad user groups perform the worst in terms of price performance and volatility.
Overall, core user groups outperform broad user groups in terms of price performance and volatility.
Airdrop size has no decisive impact on price performance or volatility.
Additionally, four protocols airdropped a majority of their supply. They are DYDX (50%), GAS (55%), VELO (60%), and AMPL (67%). We expected a correlation between airdrop size and price but did not observe one, either in this group or across all tokens (not shown). However, the lack of correlation suggests that teams can airdrop a majority of their tokens and still see positive price changes two months later (VELO +105%).
Wallet Behavior
Another valuable insight for measuring airdrop success is understanding how users handle the tokens they receive. For each protocol, we analyzed the wallets of recipients within 60 days post-airdrop. Note that, for complexity reasons, we did not consider cases where users transferred tokens to other wallets or exchanged them outside of DEXs (e.g., sent to centralized exchanges). Tracking deposits to centralized exchanges at scale became unfeasible, so we propose using only DEX data as a useful proxy for comparative analysis, likely serving as a minimum standard for sellers.
Generally, we categorize users into three types: sellers, holders, and buyers. To perform this classification, we calculated the net change over 60 days—users with no change are holders, users with increased holdings are buyers, and users with decreased holdings are sellers.
60-Day Wallet Behavior Airdrop Analysis


We can draw two insights:
Broad airdrops lead to a twofold increase in the number of sellers. Average data shows that recipients of broad airdrops are more likely to sell their tokens than core users. This is intuitive. If users receive tokens for something they have never used before, or have only heard of, they are more likely to exchange them for assets they care about. More compellingly, among the top 10 protocols with the highest seller ratios, 8 conducted "broad" distributions.
Small airdrops to core users lead to a 4-8 times increase in the number of buyers. Data shows that when airdrop sizes are smaller (<10%) and targeted at core users, the proportion of buyers is highest. This is also intuitive, as they are the most active users and most likely to purchase tokens to participate in governance or liquidity voting.
Recommendations
Our analysis reveals four main insights:
Airdrops to core users exhibit higher prices within two months post-airdrop.
Airdrop size has no significant impact on price performance or volatility, suggesting that "low supply" may not influence price volatility as much as other factors.
The number of sellers in the broad airdrop group is twice that of the core group.
The number of buyers in the small airdrop + core user group increased by 4-8 times (increased holdings).
We derive some general biases in airdrop design from the data, but it is essential to note that the specific context and goals of the protocol must always be considered.
Recommendation #1: Favor airdrops to core users rather than a broad audience
Given the opportunity cost of airdropping to users who are more likely to sell, our first overall view is that airdrops should primarily target core users who help guide liquidity and/or drive usage, rather than a broader audience. Our intuition is that rewarding core users will lead to higher holder retention rates, which is validated by the data. The likelihood of converting non-users into users through airdrops is low; it is generally better to focus attention and resources on incentivizing the core community. Airdropping to core users may also foster buying momentum and relatively higher prices.
Recommendation #2: Favor smaller airdrops
Given that airdrop size has no significant impact on price and volatility, we lean towards maintaining smaller airdrops rather than larger ones. Tokens help guide usage and liquidity, especially if the team plans to continue iterating on its product (rather than planning to solidify it), keeping more reserves helps fund incentives for attracting users and liquidity in the future. It is important to note that airdrops should still be large enough to meaningfully reward early risk capital and serve as a moment of community incentive.
In some cases, larger airdrops may be preferred. For example, larger airdrops can prevent voting centralization and make it harder for malicious actors to influence the network. However, allowing teams and investors to vote on their locked tokens may reduce this risk factor.
Observation: "Low supply" may not be the primary driver of price volatility
Finally, as an observation rather than a recommendation, the data does not support the theory that "low supply" is the primary reason for significant price fluctuations. Logically, low supply limits availability, which should drive prices up. However, we did not observe a significant relationship between large and small airdrop groups, with all groups seeing lower prices 60 days post-issuance. Additionally, analyzing relative volatility did not reveal significant differences in airdrop size, although we expected low supply to lead to higher volatility. In fact, the large + broad user group had the highest volatility by far!
If we had unlimited resources and knowledge, we would expand our research to include assessing the protocol's TVL before/after TGE to evaluate whether airdrop size affects TVL stickiness, and analyze the ratio between TGE price and the last round of significant investment.
Appendix
Crypto Index Correction
To balance the analysis across different macro conditions, we used beta normalization to eliminate macro price changes in token price variations. This was accomplished using a multiple regression with BTC and ETH, where we removed the beta coefficients of each asset relative to the macro and rebuilt prices after adjustment.