Are you still watching FDV for trading coins after missing out on WLD?

 If not focusing on FDV, what should we focus on?
Original Author: Kaori, BlockBeats
Original Editor: Jack, BlockBeats
WLD surged from $2 to a peak of $9 in just one week, creating a buzz both within and outside the AI sector, but the crypto market is divided over WLD's FDV.
FDV (Fully Diluted Valuation) refers to the fully diluted value of a token, corresponding to the market cap obtained by multiplying the current token price by the current circulating supply. FDV is an indicator calculated by multiplying the current token price by the total token supply.
This is a familiar term for Degen, but if you are hearing it for the first time, don't worry. This article will use WLD as an example to explain the significance of FDV, whether we should still use FDV as a reference indicator for trading in the new cycle, and what new perspectives FDV reflects in understanding the market.
Is WLD's FDV Worth Considering?
WLD currently has a circulating supply of about 130 million, with a market cap of $1.1 billion at the time of writing, ranking 76th; its total supply is 10 billion, giving it an FDV of $85.6 billion, surpassing first-tier public chains like SOL and BNB, and even the market cap of world leader in AI concepts, OpenAI.
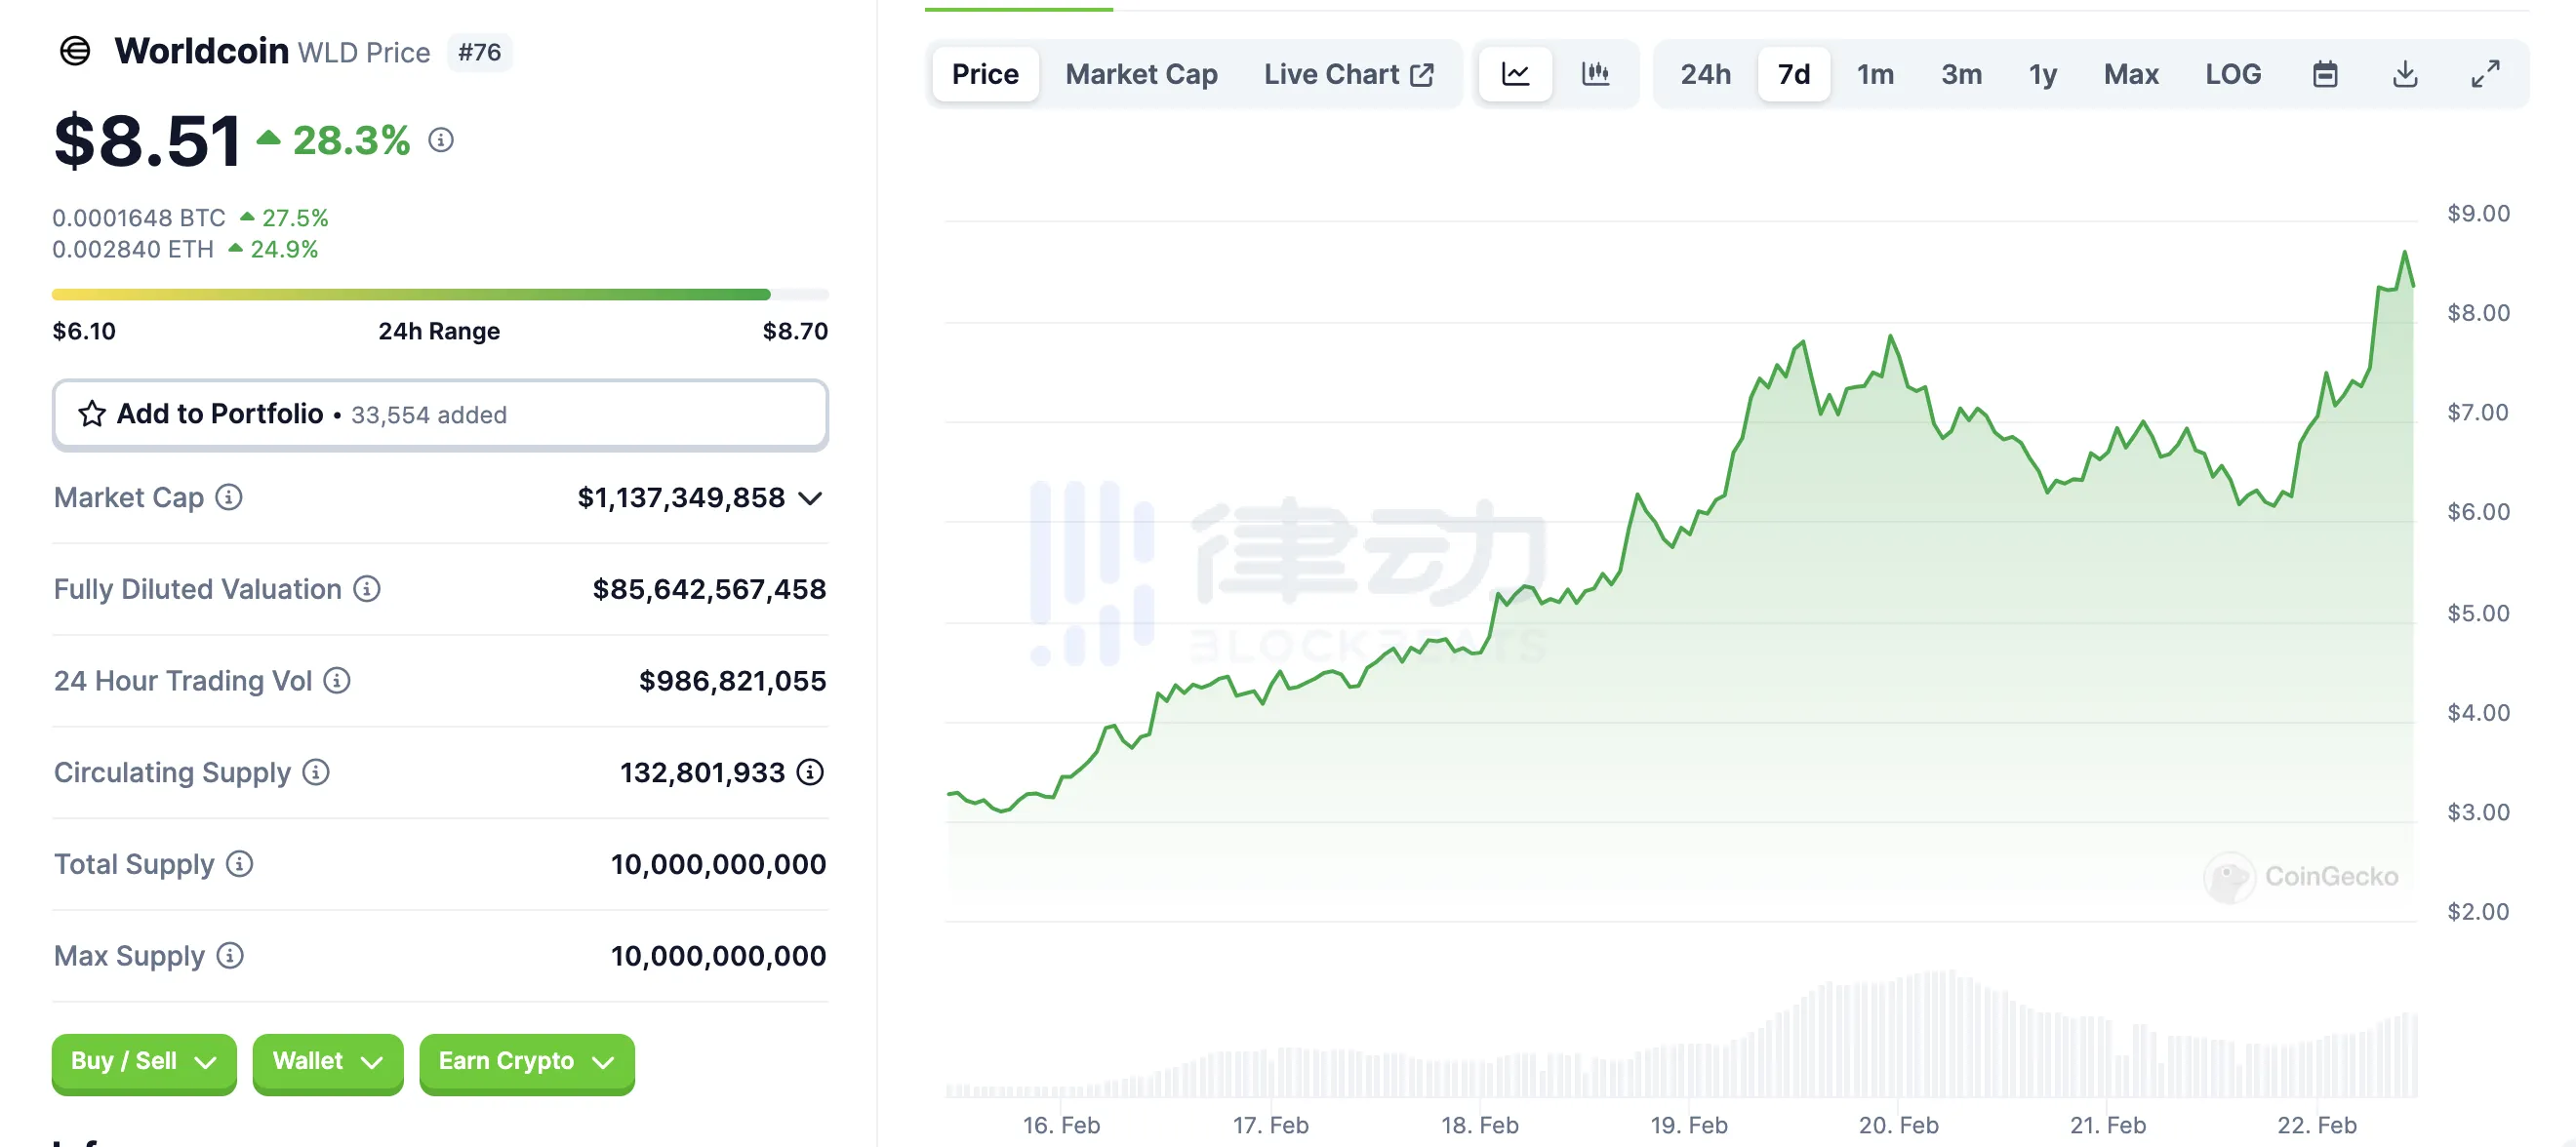
The market division arises here, with some believing that WLD's FDV has reached an outrageous level, making this price completely unsustainable and merely a bubble riding on AI hype; while others argue that WLD's circulating supply is absurdly low, depending on where market makers are willing to push it, and that FDV is just a misleading facade.
The Worldcoin white paper indicates that the maximum circulating supply of WLD at launch was 143 million, of which 100 million WLD were loaned to market makers outside the U.S., and 43 million WLD were allocated to users verified through Orb during the testing phase. Since the official launch of World App, a single user can claim a total of 77 WLD subsidies. However, in places like France and Hong Kong, WorldCoin faces significant regulatory pressure, and the offline iris scanning devices and sites have faced certain restrictions, leaving a large portion of tokens in users' hands unable to be withdrawn.
On the other hand, five WLD market makers returned 25 million WLD at the end of October last year, with the remaining 75 million WLD returned to the Worldcoin project on December 15. Subsequently, Worldcoin announced a new loan agreement with these five market makers, effective December 16, 2023, with a total loan amount of 10 million WLD for a duration of six months.
Therefore, the current circulating tokens of WLD in the market consist of two parts: one is the portion of tokens in the hands of users who receive daily subsidies through the app and have already withdrawn, and the other is the 10 million held by market makers, which only accounts for 1.33% of WLD's total supply. Additionally, WLD's unlocking period is after 150 days, so in the short term, WLD's FDV is not a reference point, and the claim of surpassing OpenAI's market cap seems more like an AI meme.
What Should We Focus on Instead of FDV?
Who Should Look at FDV When Trading Tokens?
For those who need to hold a certain token for the long term, such as institutions or conservative investors, they need to use FDV for post-investment management or position management. At this point, FDV combined with market cap becomes an effective indicator for monitoring the prospects of a token, allowing investors to better assess whether a project's value is extremely deviating from the standard. However, for ordinary retail investors, when trading in the short term, the primary considerations should be the supply and demand relationship of the token, as well as narrative and sentiment. If one is to focus on FDV, it should also be combined with the token's issuance schedule.
The diminishing importance of FDV actually reflects some changes in the crypto industry, and it is these changes that require us to pay attention to things beyond FDV.
Supply and Demand Relationship
First, the number of people in the entire crypto industry is increasing. Previously, there were only ICOs and retail investors, but now there are more buyers and stakeholders. A large project goes through several rounds of financing to sell tokens, airdrop a large amount, engage market makers, and CEX, all of which affect the supply and demand relationship of the token. In this context of industry development, the FDV reflected by the total token supply does not have reference value for a certain period.
As demand increases, the total amount of tokens grows larger, and the linear unlocking time period becomes longer. Optimistically, projects hope that new entrants can still buy their tokens, which reflects a form of long-termism. If they want to reduce the impact of FDV on token prices, project parties need to continue to delve into the timing of unlocking and creating demand.
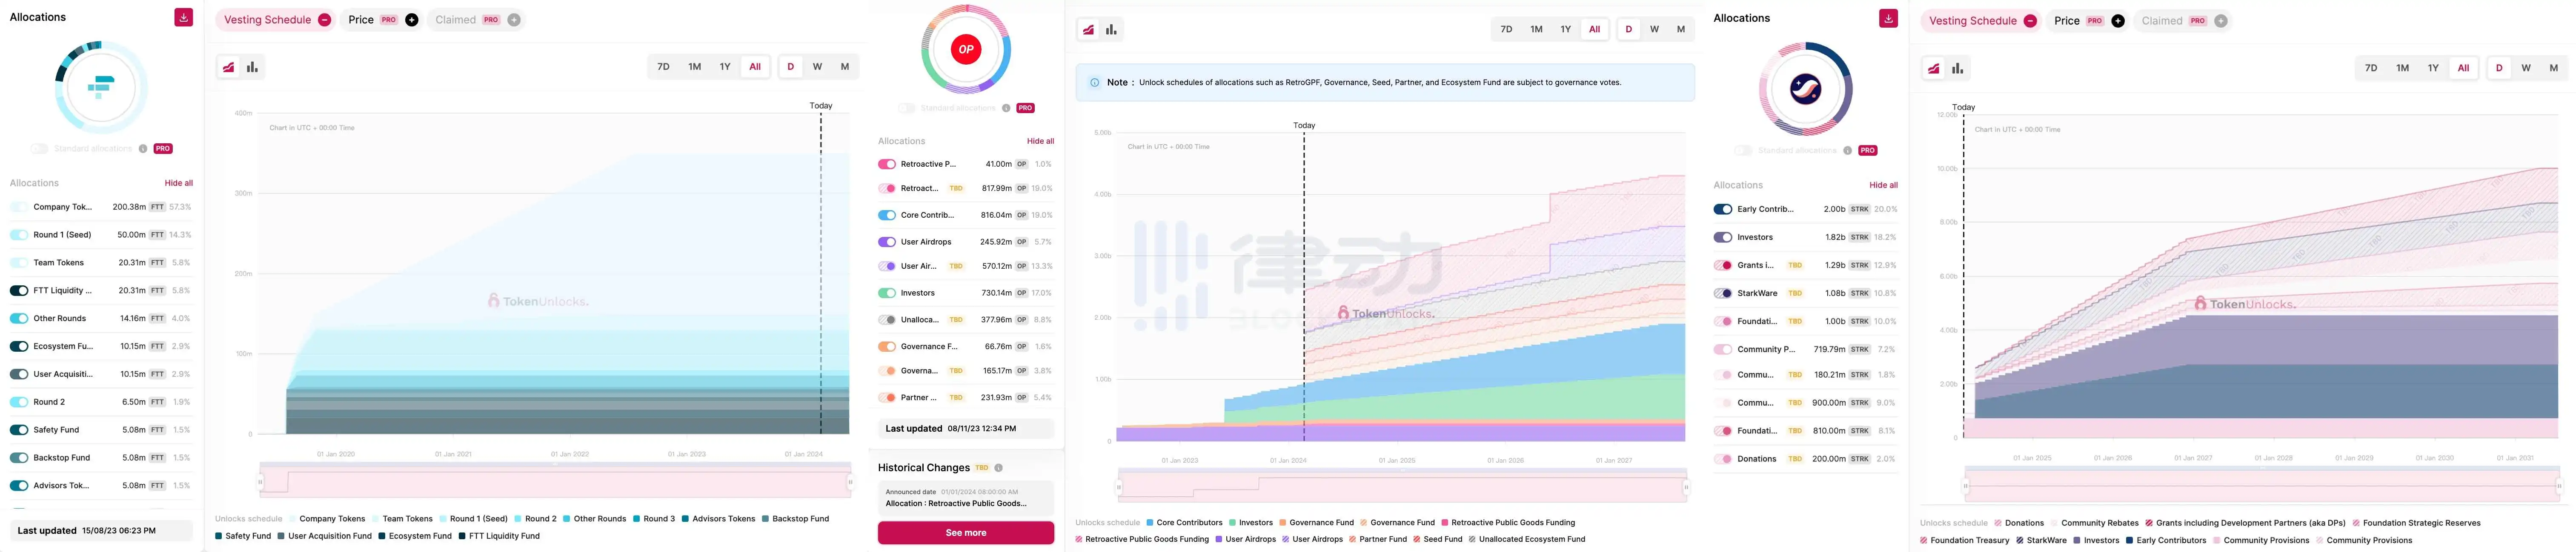
Left: FTT Unlock Timeline; Middle: OP Unlock Timeline; Right: STRK Unlock Timeline (not updated to the latest version)
The impact of the unlocking timeline on token prices can be exemplified by the recently completed airdrop of the prominent project Starknet. StarkWare announced adjustments to the STRK token unlocking plan for its early contributors and investors, shifting from a one-time release of 1.3 billion tokens on April 15 to unlocking only 64 million tokens and then releasing them linearly in a more gradual manner. Following this announcement, the STRK price broke through $2, rising by 14% from before. At this time, STRK's FDV was still quite large, but the market's reaction clearly absorbed this positive news.
STRK 24-Hour Price Chart
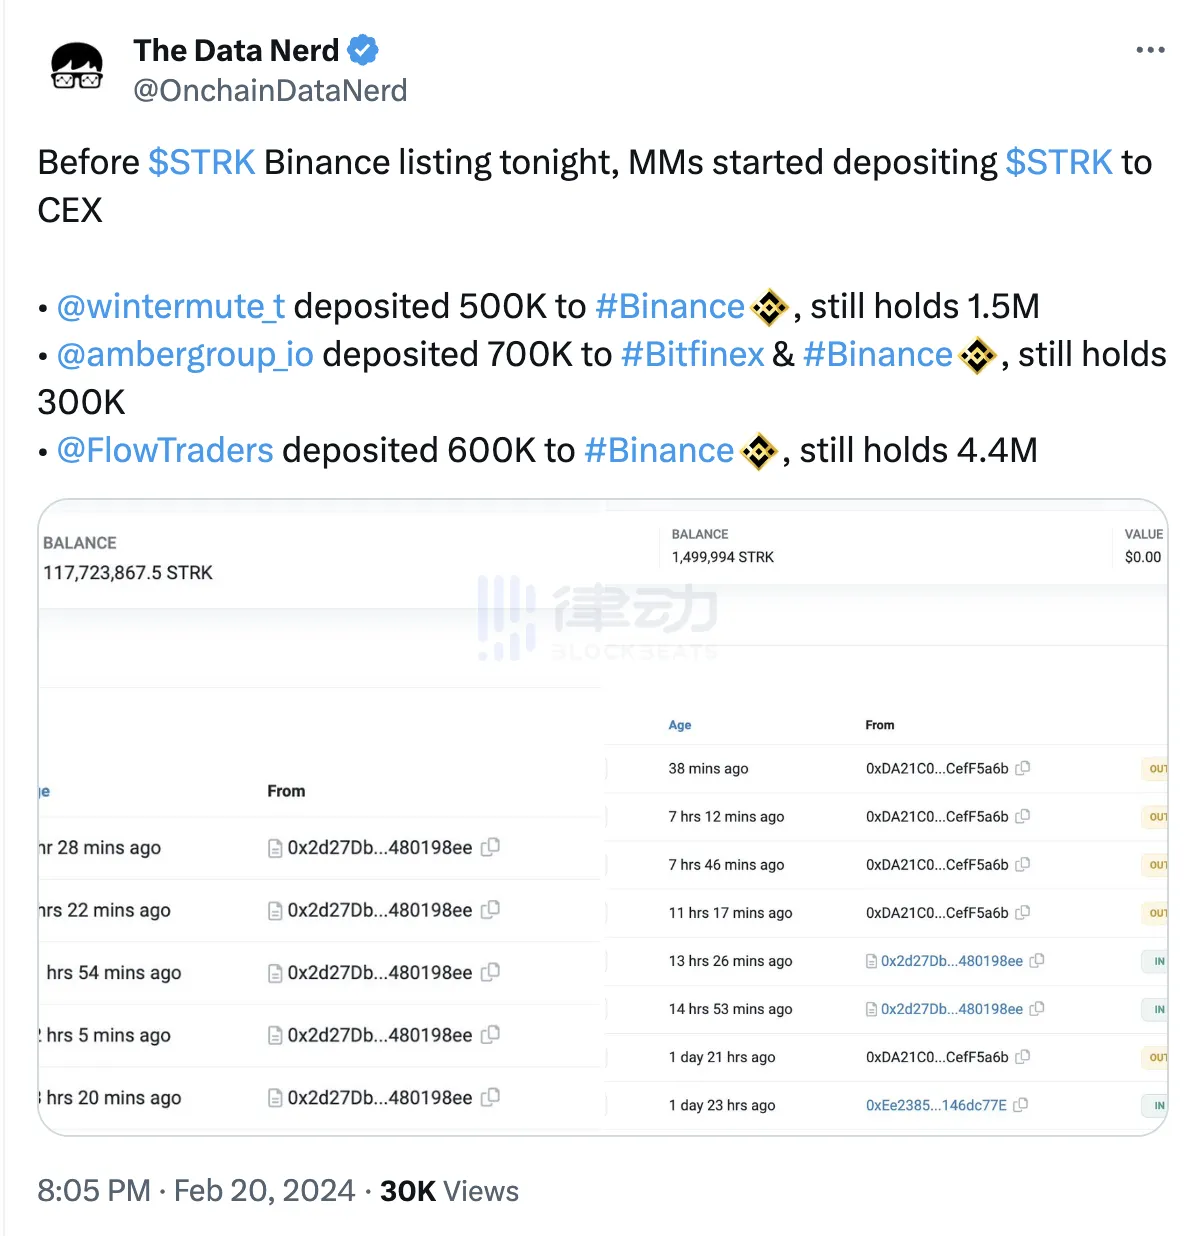
The launch of STRK provides insight into the short-term price impact of supply and demand on a large project’s token. Why did Starknet's launch on Binance spike to $7 and become a single-coin phenomenon? Because at that time, the on-chain airdrop collection was stuck, large holders could not dump, and several major market makers were filling tokens into CEX, leading to relatively high short-term demand and supply being less than demand. As for the long-term supply and demand relationship, it requires project parties to balance the interests of all parties, but FDV is no longer a necessary factor for large projects with longer unlocking times.
Taking WLD as an example again, we roughly calculated earlier that the current circulating supply in the market only accounts for 1.3% of the total amount, and among them, market makers hold 1%. From the perspective of driving the price up, WLD's FDV is of no reference value at this time. This is because the Orb that determines WLD's release is very limited, and very few people can actually withdraw tokens from the app.
Short-Term Operations, Emotion is Key
In addition to the supply and demand relationship, the logic behind WLD's rise also needs to consider the power of narrative. A week ago, OpenAI launched the text-to-video model Sora, and WorldCoin, which has been associated with Sam Altman since its inception, benefited from this wave of AI sector sentiment. After a slight decline yesterday, thanks to Nvidia's revenue increase reported, WLD's price still maintained in the $8 range.
Arthur Hayes once said, "I would rather invest in a token with a perceived success probability of 0.01% and a narrative in a viral growth phase than in a token with a perceived success probability of 50% but a narrative that has reached the common sense stage. If the probability of success rises from 0.01% to 1% because this narrative quickly infects many people, my money would increase by 100 times."
With strong market control meeting the booming AI sector, the logic behind WLD's recent surge is quite understandable. Conversely, those who still talk about FDV remind one of the somewhat humorous saying, "When there's FUD, talk about FDV; when calling for a buy, talk about MC."
Real Money
A good market is due to ample liquidity, and the February market for BTC can be verified through the inflow and outflow of ETF funds. On February 14, CoinShares' research director James Butterfill stated that since the launch of the Bitcoin spot ETF, the total net inflow has exceeded $4 billion. A week later, the cumulative net inflow for the Bitcoin spot ETF exceeded $5 billion, reaching $5.052 billion.
Yesterday, according to BitMEX Research data, on February 21, all U.S. spot Bitcoin ETFs saw a net outflow of $35.7 million, marking the first net outflow since January 25 (over 17 trading days).
Due to the popularity of re-staking, a large portion of ETH has been invested in popular projects in this sector. From the start of Blast's locked staking to Pendle's price surge driving LRT's rise, and the continuous attraction of leading projects like EigenLayer, the circulating supply of ETH has decreased during this period, which is also reflected in the price.
We cannot accurately predict the price performance of the token market, but we can pay attention to money, which provides a more timely feedback on market conditions than looking at the ratio of market cap to FDV.
Does FDV Still Have Value?
The market is becoming increasingly professional, and the price discovery capability is becoming stronger. So, does FDV have any value? At least for some large leading projects, we can still see the impact of FDV on pricing.
For example, the two leading Layer 2 projects, OP Mainnet and Arbitrum, OP's price has basically remained at twice that of ARB. The price difference between the two is because OP's FDV was half that of ARB, even though OP's circulating supply is only about 300 million less than ARB.
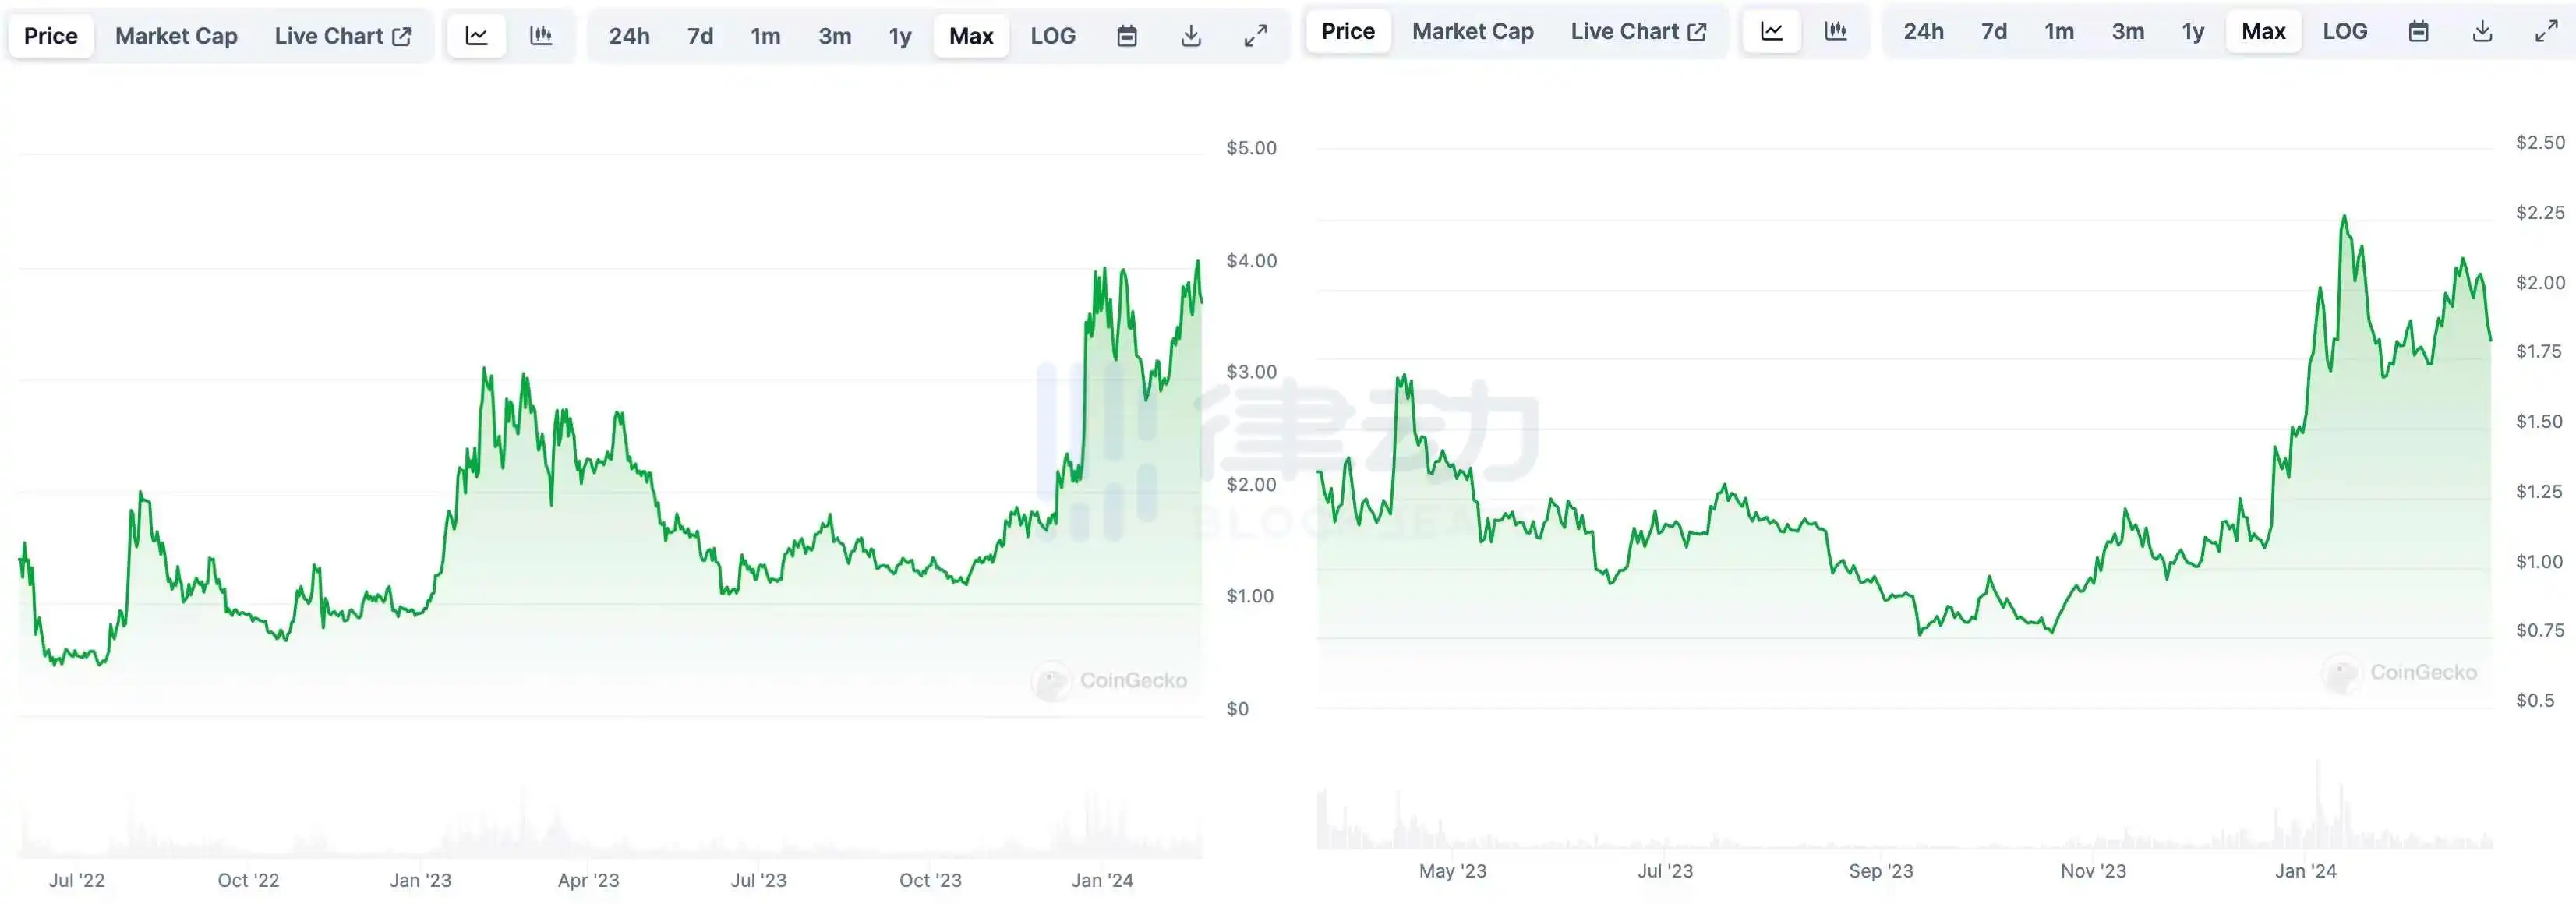
Left chart shows OP price trend, right chart shows ARB
The widespread adoption of OP Stack has laid a certain foundation for OP's demand, but as Arbitrum Orbit continues to enhance its tech stack and decentralized governance, this marathon competition in Layer 2 is far from over. With increasing competition, if future trading demand for ARB exceeds that of OP, even if ARB's FDV remains higher than OP's, ARB will also surpass OP in price.
Thus, it can be seen that market logic and standards are also changing. The substantial difference between ARB and OP can be seen as a barometer of the success or failure of FDV theory. If in the future ARB's market cap gradually exceeds that of OP, investors who adhere to the FDV supremacy theory may need to rethink market logic. But in any case, focusing on a single indicator in the crypto market will not lead to progress.