Reading Bitcoin Ordinals: Contributing 23% to transaction fees, popular BRC20 averages over 400% increase

 What is the current development status of inscriptions based on the Ordinals protocol and BRC-20 tokens? How is the market trading situation? What impact do on-chain activities have on the ecosystem, including mining and application layers?
Author: Carol, PANews
At the end of 2023, Bitcoin Ordinals are once again booming in the market. According to data from CRYPTOSLAM, the trading volume of Bitcoin Ordinals (inscriptions) in November was approximately $376 million, which is 8.05% higher than the trading volume of Ethereum NFTs during the same period, and this advantage has expanded to 18.75% in December (as of December 10). However, unlike at the beginning of the year, this boom in Ordinals is also related to the emergence of BRC-20 tokens. According to CoinGecko, the largest market cap token, ORDI, saw its price rise by 180.07% in just four days from December 2 to December 6. Other BRC-20 tokens also experienced significant increases.
The popularity of Ordinals has shown the market the potential for an explosive Bitcoin ecosystem. So, what is the current development status of inscriptions (based on the Ordinals protocol) and tokens (BRC-20)? How is the market trading situation? What impact do on-chain activities have on the ecosystem, including mining and application layers? After a comprehensive analysis of on-chain data and market data related to Ordinals by PANews' data news column PAData, it was found that:
- Since November, the cumulative number of transactions for Ordinals has been approximately 9.748 million, with cumulative transaction fees of about 1263.54 BTC. However, the number of on-chain transactions for BRC-20 has shown a downward trend, which may be related to trading shifting to centralized exchanges.
- The floor price of popular Bitcoin NFTs has increased by an average of 311.73% in the past month. However, the increase in floor prices varies significantly among different projects, with Flipped Frogs, Bitcoin Frogs, and Van Gogh's painting seeing increases of over 1500%.
- The Bitcoin NFT trading market is characterized by a high concentration of assets and low liquidity for most assets. The trading volume of Van Gogh's painting and Bitcoin Frogs accounted for 73.51% of the total trading volume in the past month. Among popular projects, less than 50% of inscriptions can generate three or more public trades, and the liquidity of individual inscriptions is somewhat affected by the overall market heat; when the overall market is favorable, more inscriptions have the opportunity to be traded.
- Since November, the average price increase of popular tokens has reached 446.74%. The highest increase was for BISO, which rose by 1690.76%, followed by PIZA and ORDI, which increased by 1168.14% and 913.10%, respectively.
- The BRC-20 market is characterized by a high concentration of trading assets and a strong reliance on a single trading market. An average of 97.45% of the trading volume comes from ORDI. Among the 20 popular tokens, 18 have more than 50% of their daily trading volume coming from the same exchange. UniSat and Gate.io are the main trading markets for several popular BRC-20 tokens.
- Since November, the average daily transaction fees accounted for about 12.49% of total revenue, with Ordinals transaction fees averaging 23.20% of total transaction fees. Although Ordinals has indeed increased miners' income, it has not yet had an absolutely dominant impact on miners' income.
01. Since November, Ordinals on-chain transactions have been active, with over 9.74 million transactions and transaction fees exceeding 1263 BTC
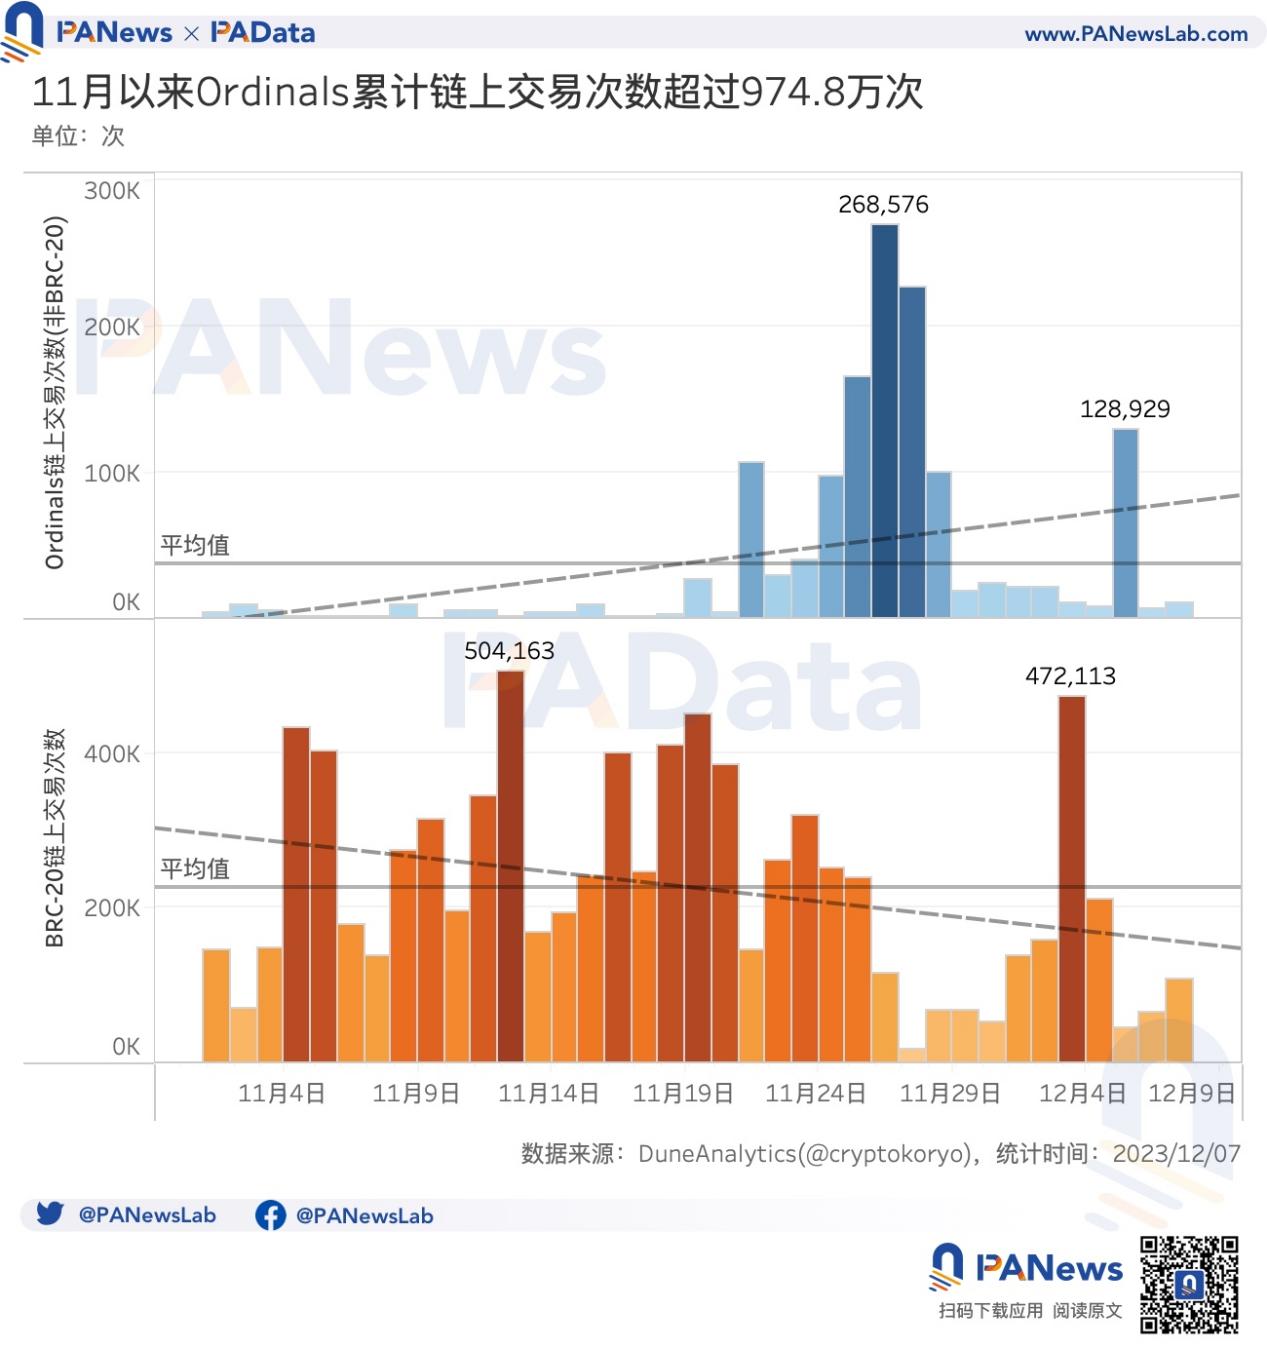
Since November, on-chain transactions for Ordinals have been very active. As of December 7, the cumulative number of transactions for Ordinals was approximately 9.748 million. Among them, the cumulative number of transactions for Ordinals (non-BRC-20) was 1.3783 million, averaging 37,300 transactions per day, and showing an overall growth trend. A trading peak occurred between November 24 and 28, with a maximum of 268,600 transactions in a single day.
During the same period, the cumulative number of transactions for BRC-20 was 8.3698 million, averaging 226,200 transactions per day, but showing an overall downward trend. A longer period of high activity occurred from November 4 to 25, with a peak of 504,200 transactions in a single day. The decline in on-chain transactions for BRC-20 suggests a possible shift of the current trading market towards centralized exchanges.
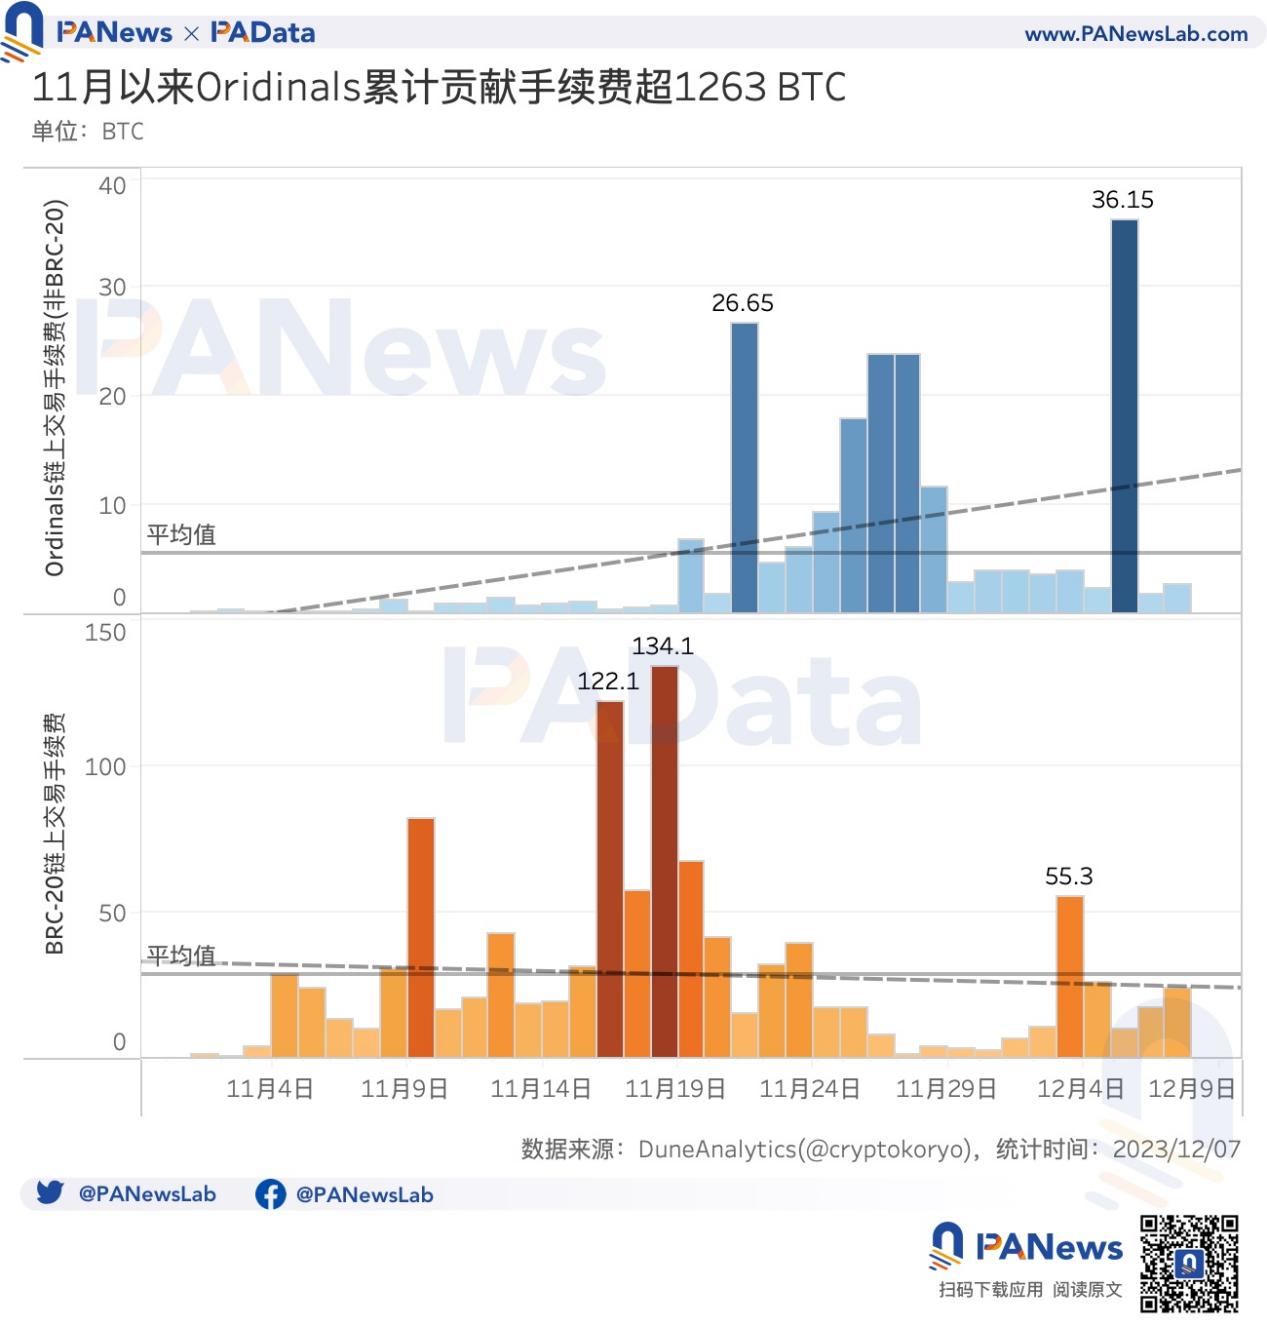
The growth in on-chain transaction numbers has created considerable transaction fees. Since November, the cumulative transaction fees for Ordinals have been approximately 1263.54 BTC. Among them, the cumulative transaction fees for Ordinals (non-BRC-20) were about 240.27 BTC, averaging 5.52 BTC per day, with an overall trend of significant growth similar to the number of transactions. The recent peak for daily fees occurred on December 5, at approximately 36.15 BTC.
During the same period, the cumulative transaction fees for BRC-20 were about 1059.26 BTC, averaging 28.6 BTC per day, with a generally stable trend and slight decline. Recent daily fees exceeded 100 BTC twice, with a peak of 134.1 BTC.
02. The floor price of popular Bitcoin NFTs has increased by an average of 311%, with less than 50% of projects publicly traded more than three times
Inscriptions are an important branch of Ordinals, first known in March due to the high auction prices of Twelvefold, and these image inscriptions are also referred to as Bitcoin NFTs. Research institution GalaxyDigital believes this will be a market with great potential. So, after nearly a year of development, what is the current state of the Bitcoin NFT trading market?
Using the top 30 popular inscriptions by trading volume in the past month as an analysis sample, it can be seen that the floor price of these inscriptions has increased by an average of 311.73% in the past month. However, the increase in floor prices varies significantly among different projects, with Flipped Frogs, Bitcoin Frogs, and Van Gogh's painting seeing increases of over 1500%; while Twelvefold, Mesh Beatles, OrdiBots, and Bitcoin Bear Cubs experienced negative growth, all exceeding -10%.
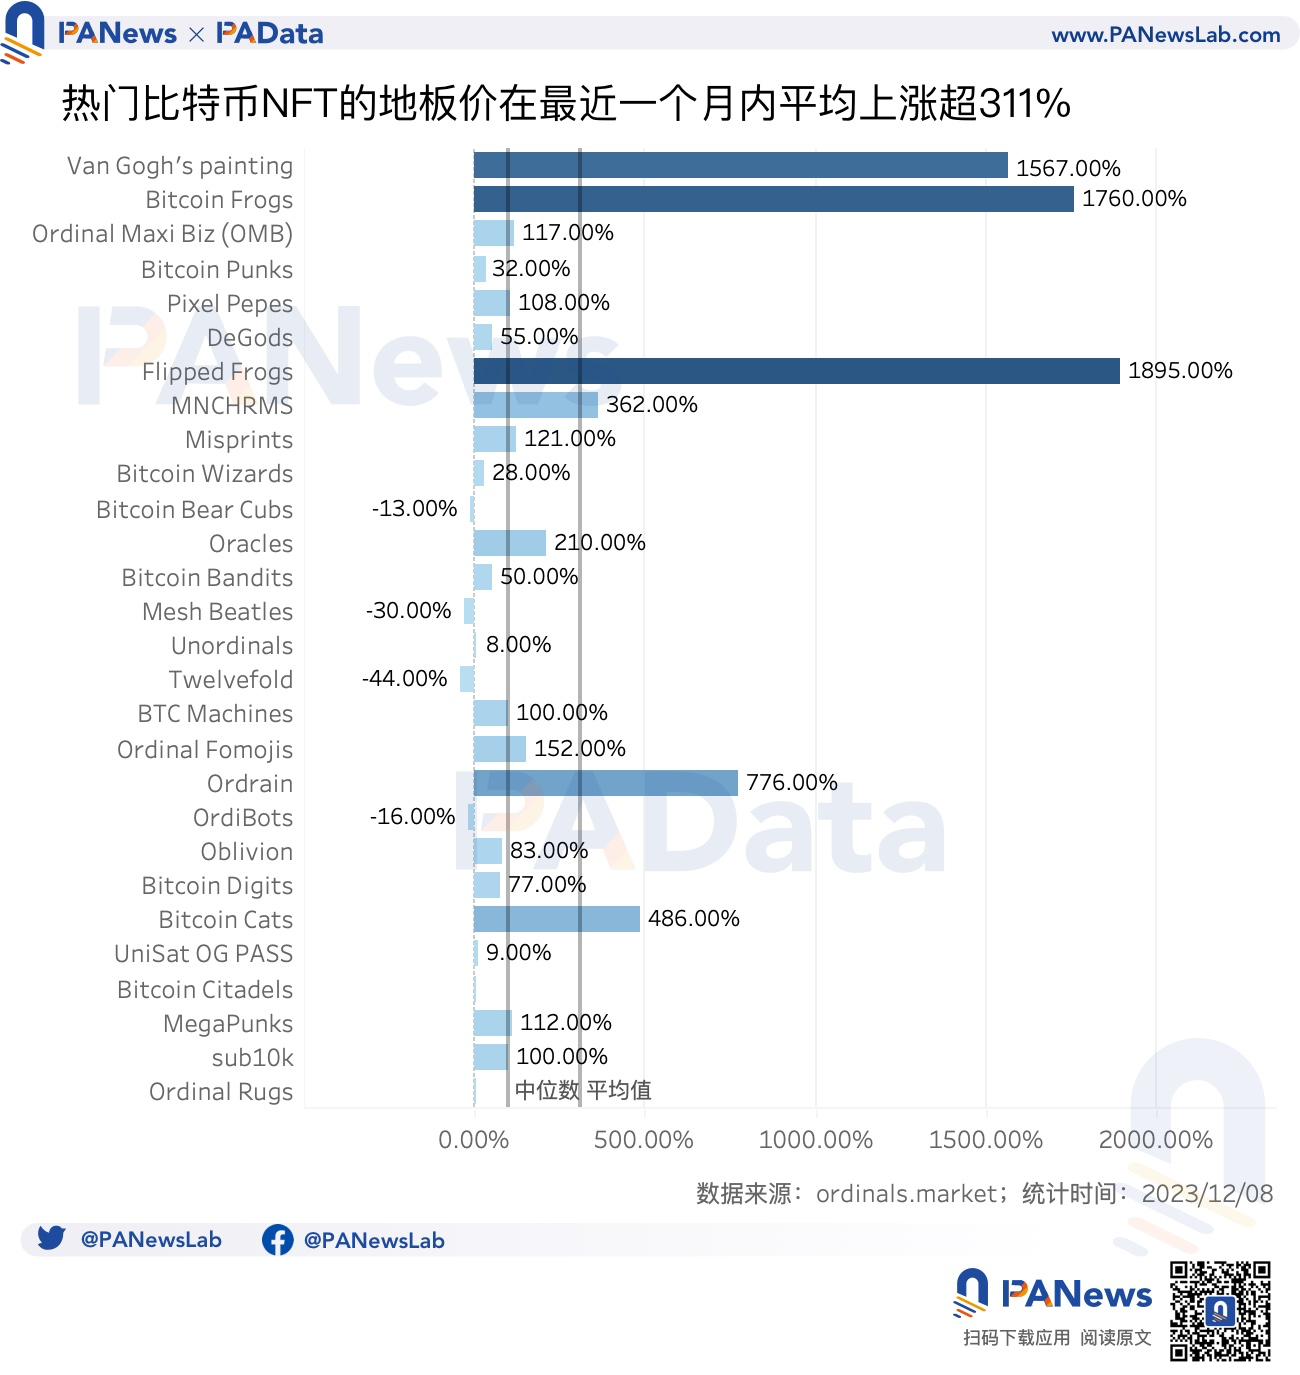
As of December 8, the total trading volume of the 30 popular inscriptions in the past month was approximately 1003.66 BTC. An important characteristic is that the trading assets of inscriptions are highly concentrated. The trading volumes of Van Gogh's painting and Bitcoin Frogs in the past month were 368.93 BTC and 368.85 BTC, respectively, accounting for a total of 73.51%. In addition, in the past month, the trading volume of Ordinal Maxi Biz (OMB) exceeded 100 BTC, Bitcoin Punks exceeded 40 BTC, and Pixel Pepes exceeded 15 BTC, with another six projects having trading volumes exceeding 5 BTC.
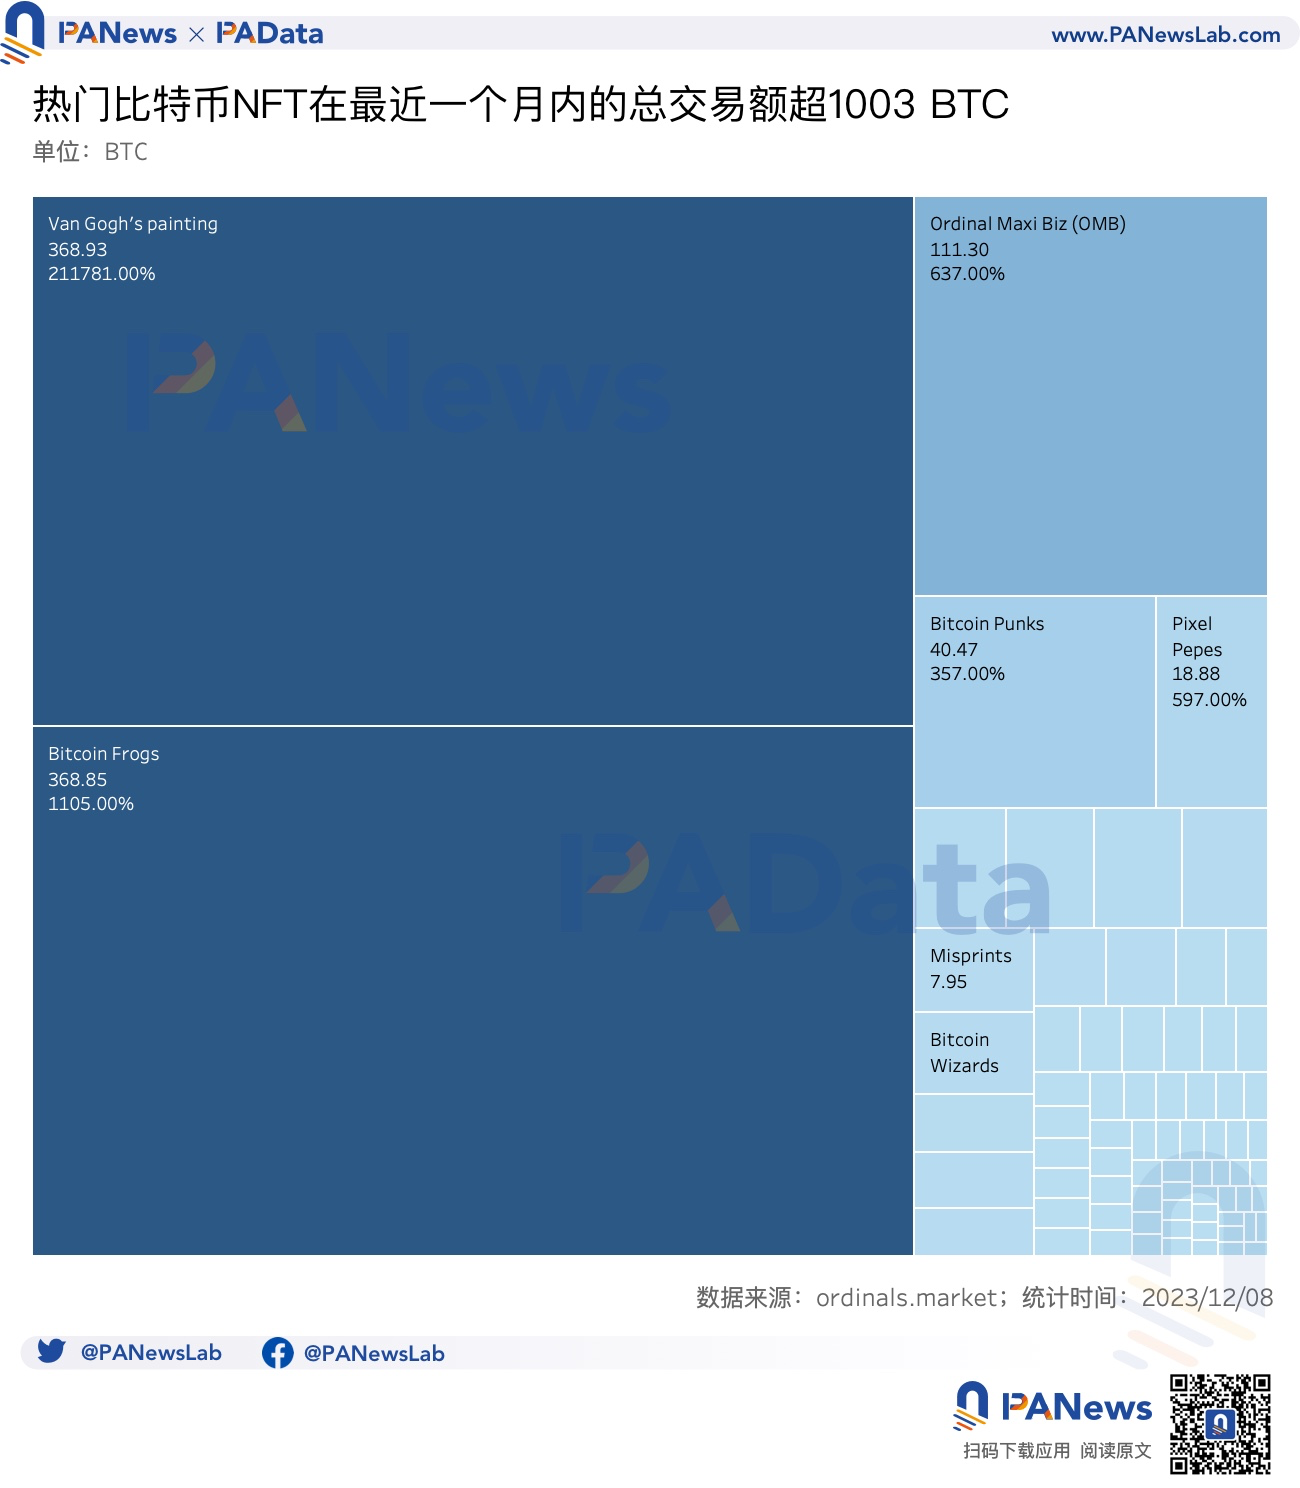
From the perspective of trading volume growth, the highest increase in the past month was for Van Gogh's painting, which rose by 211781%. The second highest was MNCHRMS, which increased by 25983%. Additionally, SATS, Bitcoin Pandas, Ordrain, Battle of BTC, and Honey Badgers all saw increases of over 5000%.
To further analyze the return on investment for inscriptions, PAData randomly selected 100 inscriptions from the top 10 projects by trading volume in the past month (10 inscriptions randomly selected from each project) to calculate the return on investment for each public trade of these inscriptions. Here, public trades refer only to trading in public markets such as OKX and Magic Eden (sales), excluding transfers. Moreover, to calculate the return on investment for continuous trades, the selected samples must include at least two public trades.
The statistical results show the second important characteristic of the inscription trading market, which is that most inscription assets have low liquidity. Among popular projects, less than 50% of inscriptions can generate three or more public trades, and the number of assets that can achieve five or more public trades is only 15.
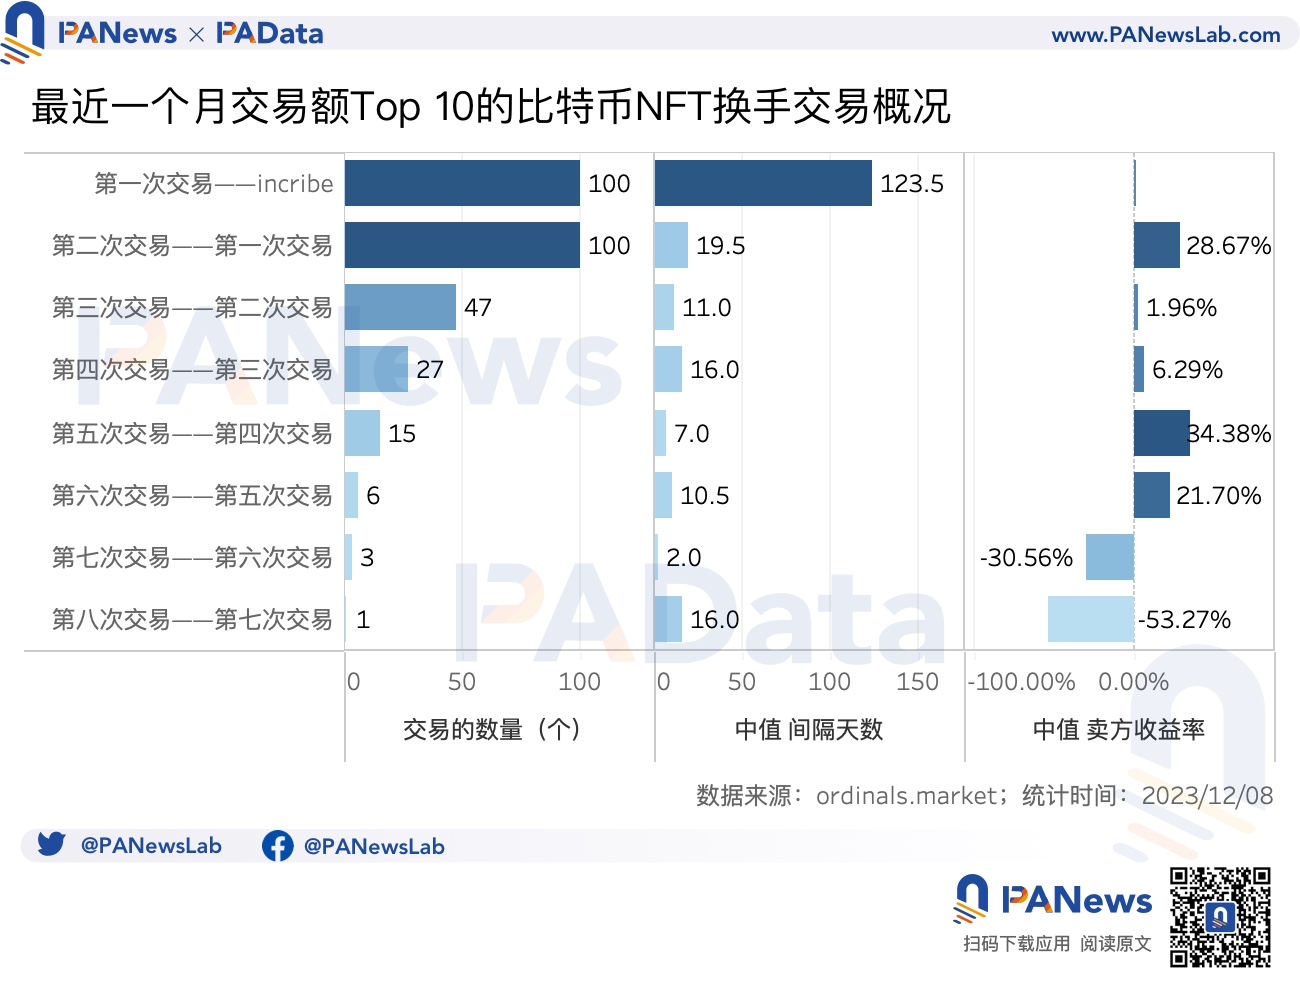
Due to the significant differences in the duration and return rates of different assets in trading, the median (50th percentile) will be used as the statistical standard to measure the overall average level. According to the statistics, the average time interval from the first public trade to the inscription is 123.5 days, far exceeding the interval for subsequent public trades. This is mainly because some projects inscribed in February of this year only had their first public trade in November, greatly extending the interval for the first public trade. This indirectly indicates that the liquidity of individual inscriptions is somewhat affected by the overall market heat; when the overall market is favorable, more inscriptions have the opportunity to be traded.
In addition, the average time intervals for the first four public trades are all over 10 days, while the average time intervals after the fifth public trade are generally below 10 days.
In terms of average return rates, the highest return rate is for the fifth public trade, averaging 34.38%. The second highest is for the second public trade and the sixth public trade, with average return rates of 28.67% and 21.70%, respectively. The average return rates for the seventh and eighth public trades are both negative.
In fact, the actual returns for inscriptions fluctuate dramatically; the same inscription can yield significant income in one trade and incur huge losses in the next. If the average return rate changes do not sufficiently illustrate this point, a specific example can be examined. For instance, in this random sample, Van Gogh's painting #132 (Inscription #394638) had a price of only 0.11 BTC in the first public trade, but after several trades, the price rose to 22 BTC in the fifth public trade. One day later, the price in the sixth public trade rose to 36 BTC, yielding a return of 63.64%, but 15 days later, the price in the seventh public trade dropped to 25 BTC, resulting in a return of -30.56%.
This example raises a new question: Does shortening the holding time and achieving trades as quickly as possible help improve the return rate?
Overall, if extreme high values exceeding 2000% are excluded, the observable phenomenon (not constituting statistical relevance) is that as the duration between trades increases, the return rate tends to decrease. When looking specifically at different trading rounds, the observable phenomenon (not constituting statistical relevance) is that in the second, third, and fourth public trades, as the time interval increases, the return rate rises; while in the fifth, sixth, and seventh public trades, as the time interval increases, the return rate declines. The samples for the sixth and seventh trades are relatively few, so this phenomenon still needs further observation.
03. Popular BRC-20 tokens have increased in price by an average of 446%, with 97% of trading volume coming from ORDI
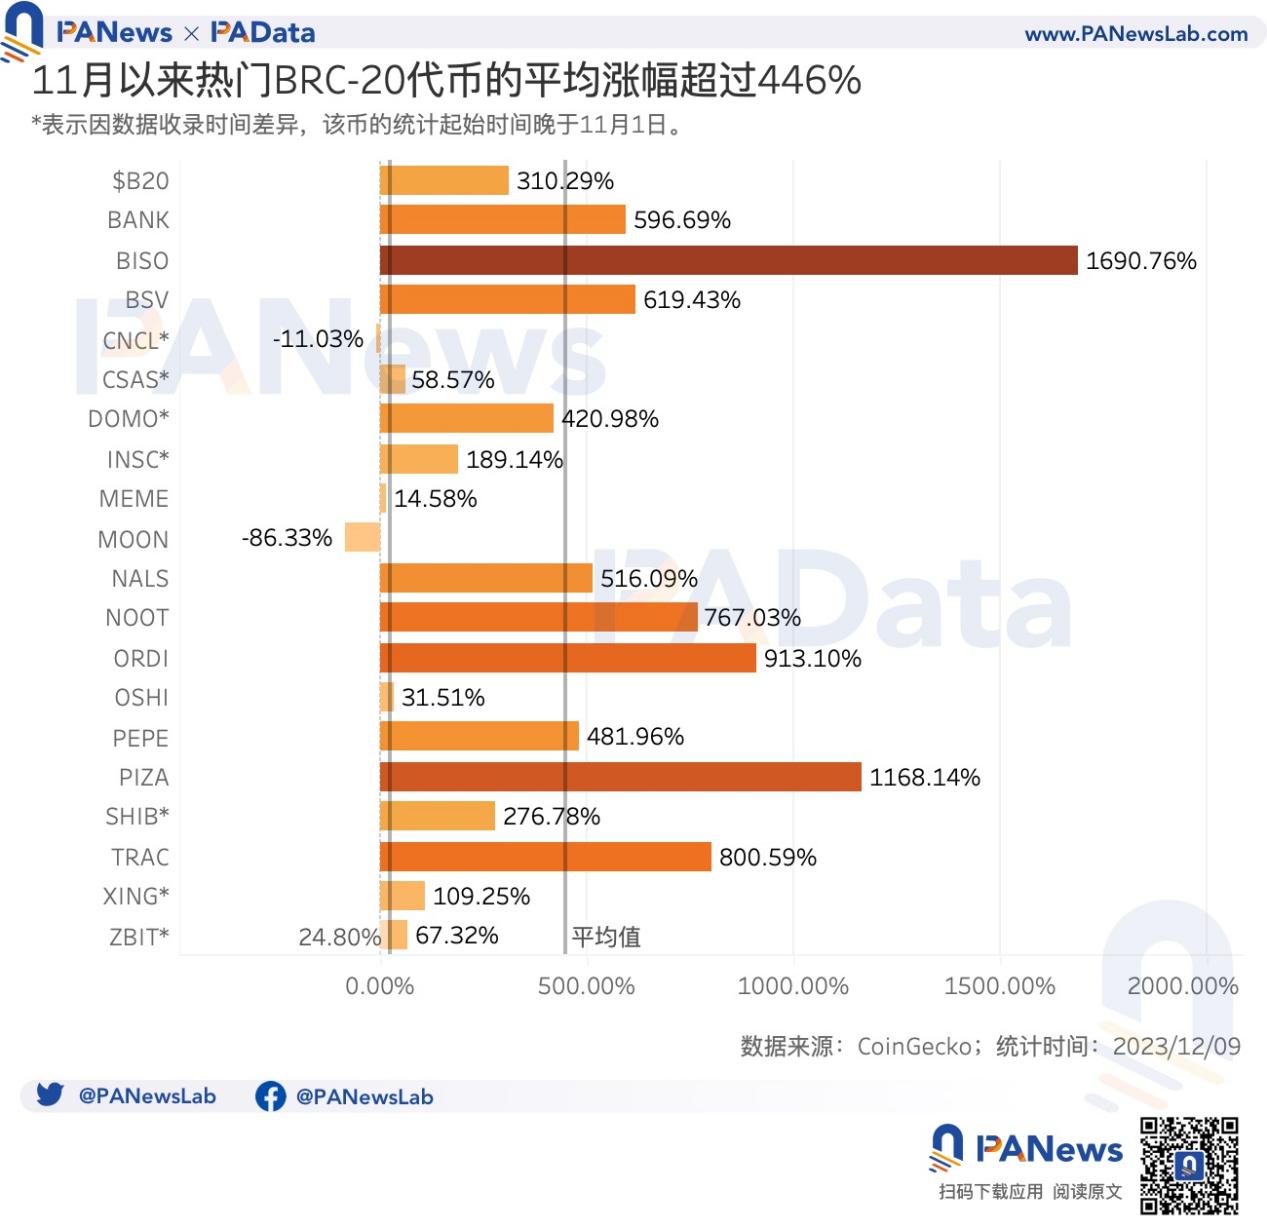
The boom in Ordinals is also attributed to the outstanding market performance of BRC-20. Using the top 20 BRC-20 tokens ranked by market cap on CoinGecko as an analysis sample, it can be found that since November, the average price increase of popular tokens has reached 446.74%. However, similar to inscriptions, the increases among different BRC-20 tokens vary significantly. The highest increase was for BISO, which rose by 1690.76%, followed by PIZA and ORDI, which increased by 1168.14% and 913.10%, respectively. Additionally, four other tokens saw increases exceeding 500%. In contrast, CNCL and MOON experienced negative growth.
During the same period, BTC's increase was 24.80%, with only three of the 20 popular tokens having increases below this level. Overall, the revenue performance of BRC-20 is far ahead of the overall market.
Since November, the composition of daily trading volume shows an important characteristic that, like the inscription market, the BRC-20 market has a high concentration of trading assets, with 97.45% of the trading volume coming from ORDI. The trading volumes of DOMO and TRAC account for 0.76% and 0.62%, respectively. Other tokens have trading volume shares of less than 0.5%, with 12 tokens having trading volume shares of less than 0.01%.
According to static data from December 9, UniSat and Gate.io are the main trading markets for several popular BRC-20 tokens (referring to the top three markets by trading volume for each token), each monopolizing four popular assets. Binance and OKX are the main trading markets for ORDI, accounting for 52.40% and 27.40% of the trading volume, respectively.
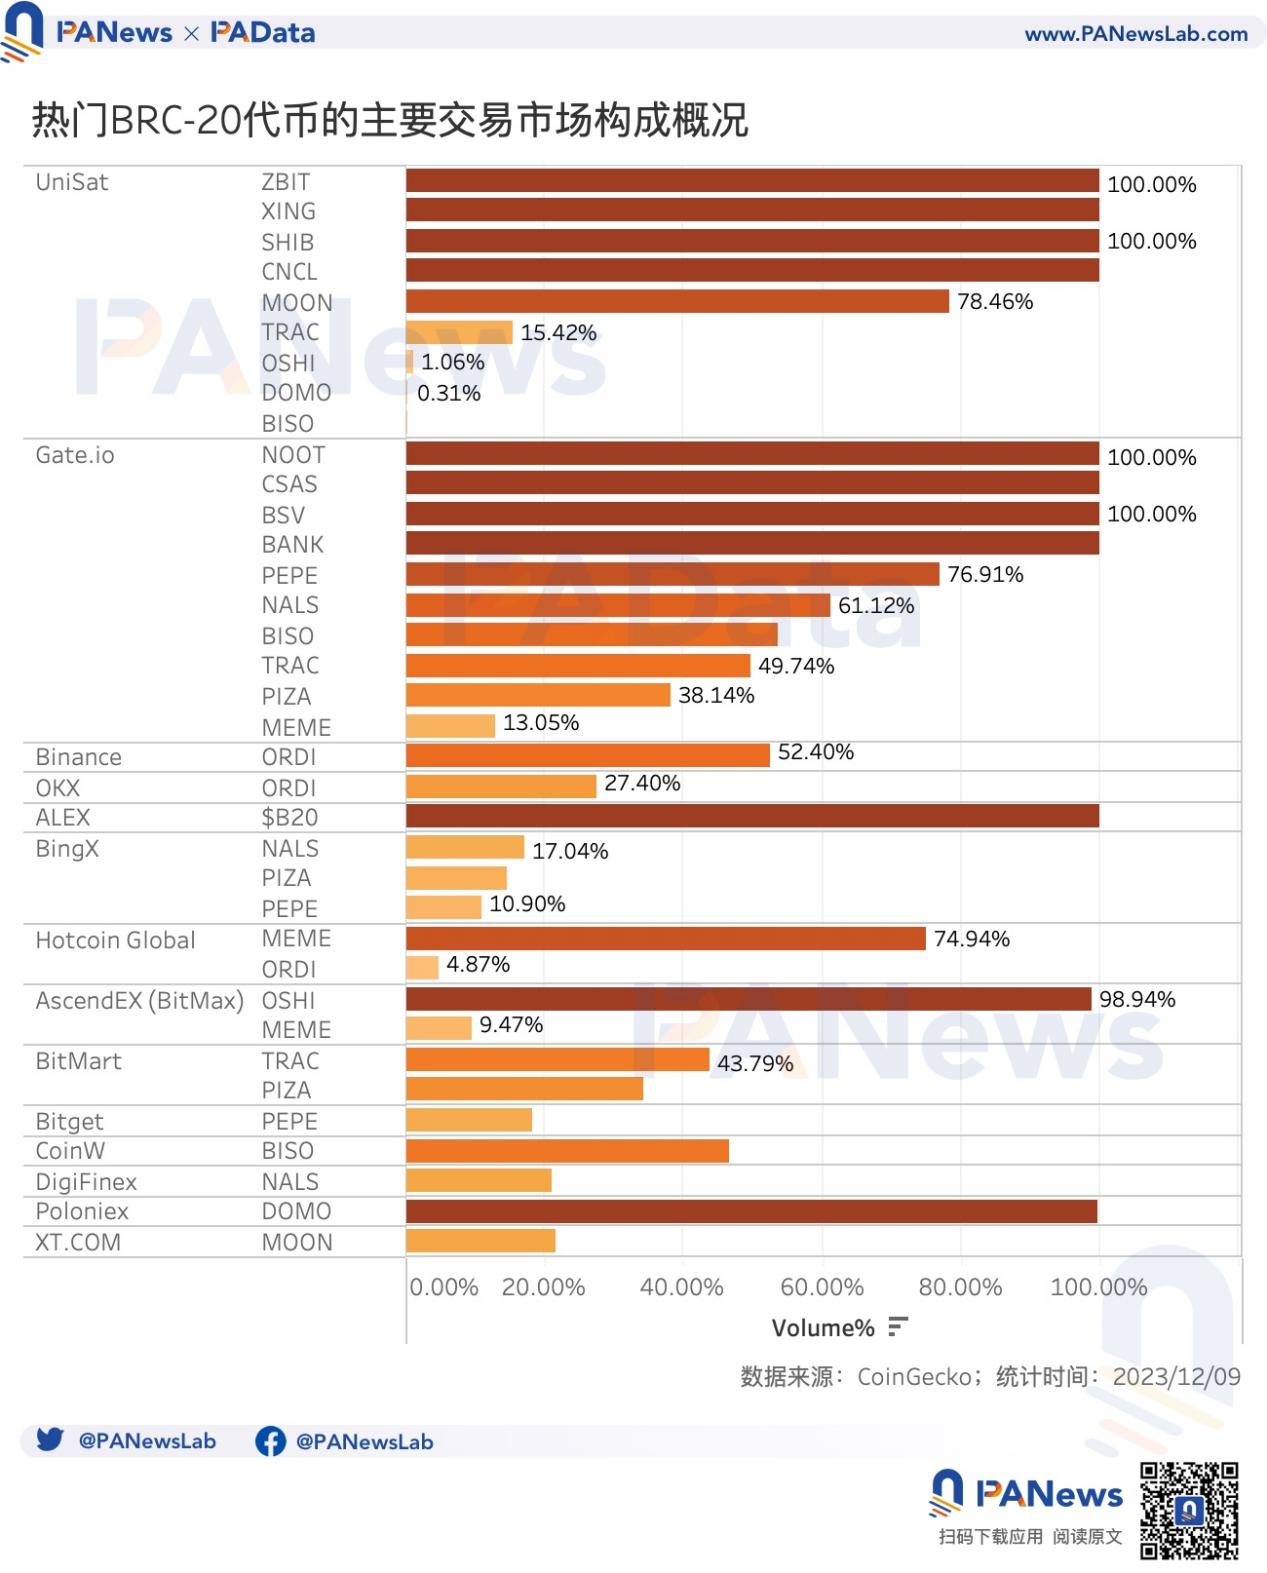
In other words, most BRC-20 tokens' trading is highly dependent on a single market. Among the 20 popular tokens, 18 have more than 50% of their trading volume coming from the same exchange.
04. 23% of daily transaction fees come from Ordinals, with Bitcoin's TVL growing nearly 37%
The boom of Ordinals has also sparked some controversy. On December 6, Bitcoin core developer Luke Dashjr posted on X platform that inscriptions are exploiting vulnerabilities in Bitcoin Core to send junk data to the blockchain, hoping future updates can fix this issue.
As previously analyzed by PAData, data from glassnode indicates that the UTXO redundancy phenomenon has indeed become increasingly apparent this year, especially after March, with a significant increase in the number of newly created UTXOs, while the total amount of these UTXOs has changed little. On the other hand, COINMETRICS data shows that the average block weight of Bitcoin has remained stable above 3.95 MB this year, almost reaching the 4 MB upper limit.
However, the rise of Ordinals has also brought some benefits. First, it is evident that miners' income has increased. According to statistics, since November, the total income of miners has reached 40,100 BTC, equivalent to about $1.512 billion. Among them, the total income from transaction fees reached 5191.30 BTC, equivalent to about $198 million.
From the perspective of the proportion of daily transaction fees to total revenue (in coin terms), there has been an overall upward trend since November. The average daily transaction fee accounts for 12.49%, with the highest single-day transaction fee proportion reaching 25.80%. However, Ordinals has not contributed the majority of transaction fees. According to statistics, since November, the average proportion of Ordinals transaction fees (in coin terms) has been 23.20%, with the highest single-day proportion reaching 42.55%.
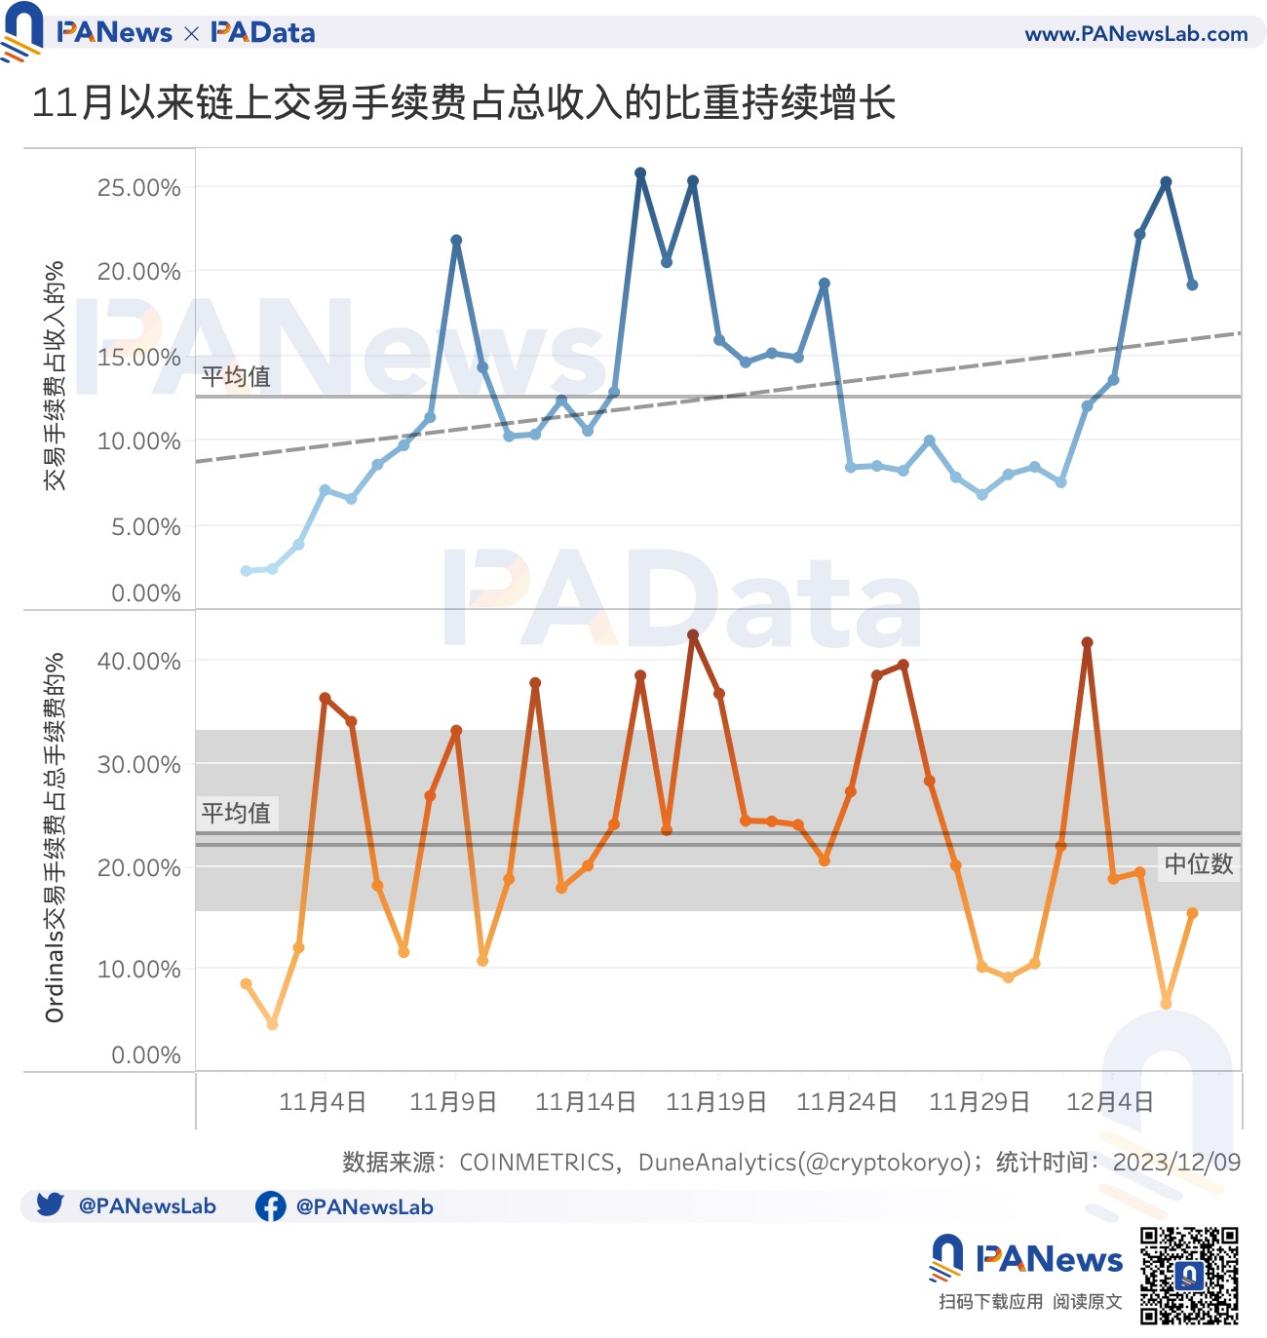
This means that although Ordinals is currently the most popular narrative and has indeed increased miners' income, with the trading market for BRC-20 shifting to centralized exchanges and the limited liquidity of inscription trading, Ordinals has not yet had an absolutely dominant impact on miners' income.
Secondly, the development of Ordinals is also believed to be beneficial for the development of the Bitcoin ecosystem, potentially providing a foundation for Bitcoin to replicate the development path of the Ethereum ecosystem. Some even argue that there is a relationship of mutual exclusion between the Bitcoin and Ethereum ecosystems, with the next round of focus likely to revolve around the Bitcoin ecosystem.
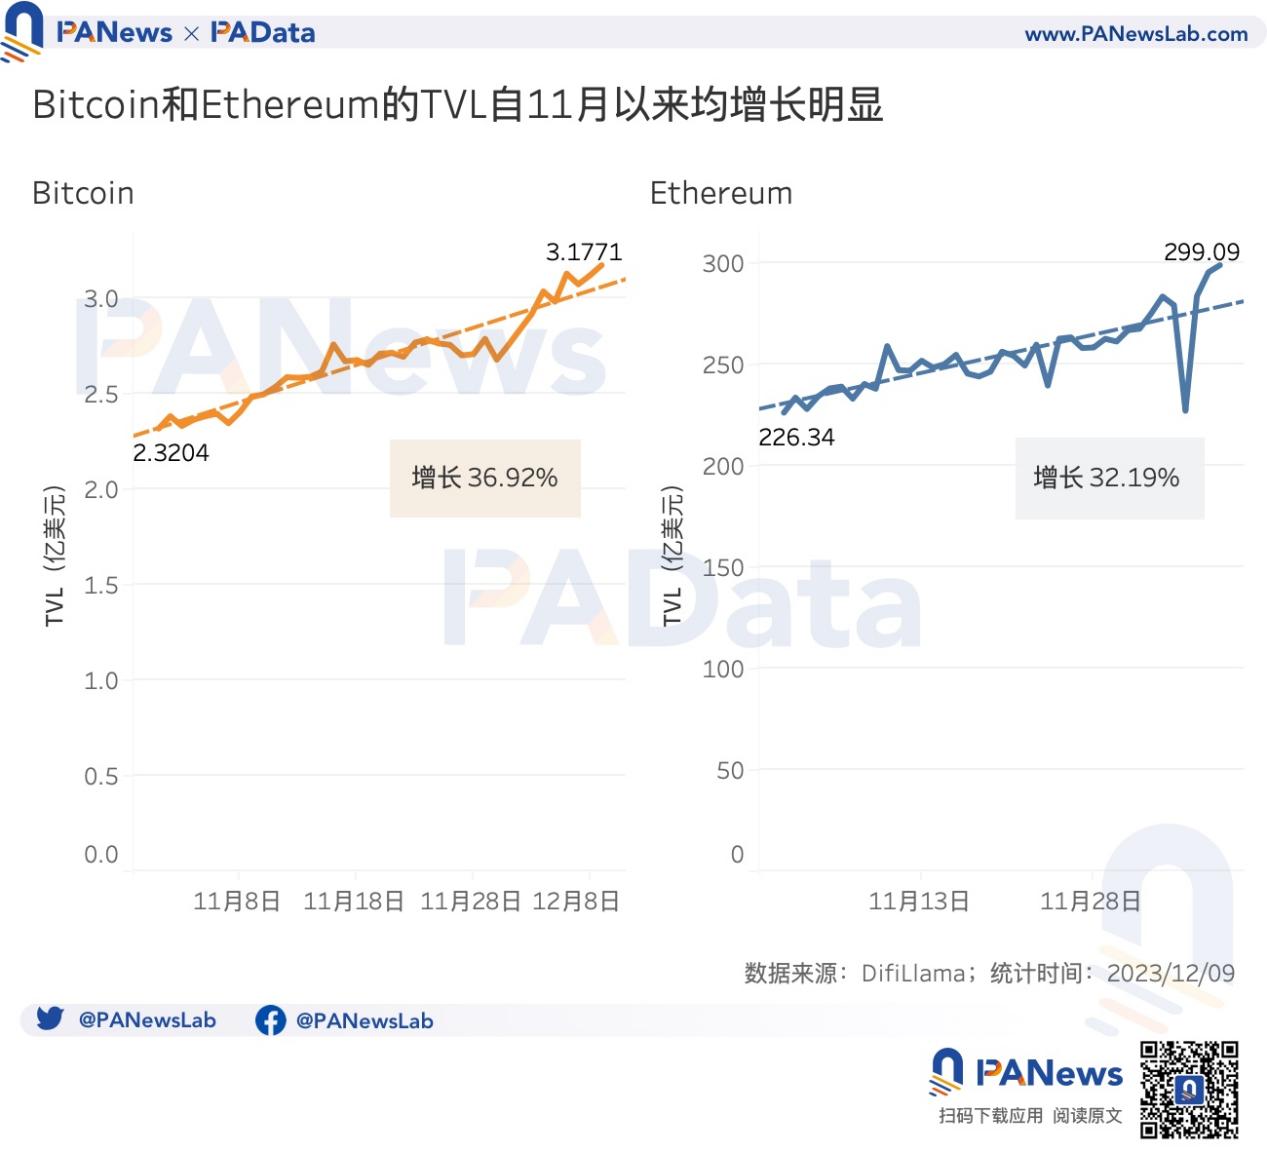
Data statistics show that on December 9, the TVL of DeFi on Bitcoin was $318 million, an increase of 36.92% compared to early November, showing a significant rise. During the same period, the TVL of DeFi on Ethereum also showed an upward trend, with a TVL of $29.909 billion. Currently, there is no clear data supporting the view of mutual exclusion between the two ecosystems. Another possible scenario in the future is that the development of the Bitcoin ecosystem may drive the comprehensive development of decentralized applications, promoting connections between different chains.