Review of the performance of 16 L1 public chains in Q3: total revenue decreased by nearly 50% quarter-on-quarter, with Solana experiencing the fastest growth in circulating market value
Author: Peter Horton, Messari
Compiled by: Felix, PANews
This report summarizes and compares the financial, network, and ecological status of 16 L1 blockchains in the third quarter. These L1 public chains include: Aptos, Avalanche, BNB Chain, Cardano, Celo, Cosmos Hub, EOS, Fantom, Hedera, NEAR, Polkadot, Polygon, SKALE, Solana, Tezos, and WAX.
Financial Overview
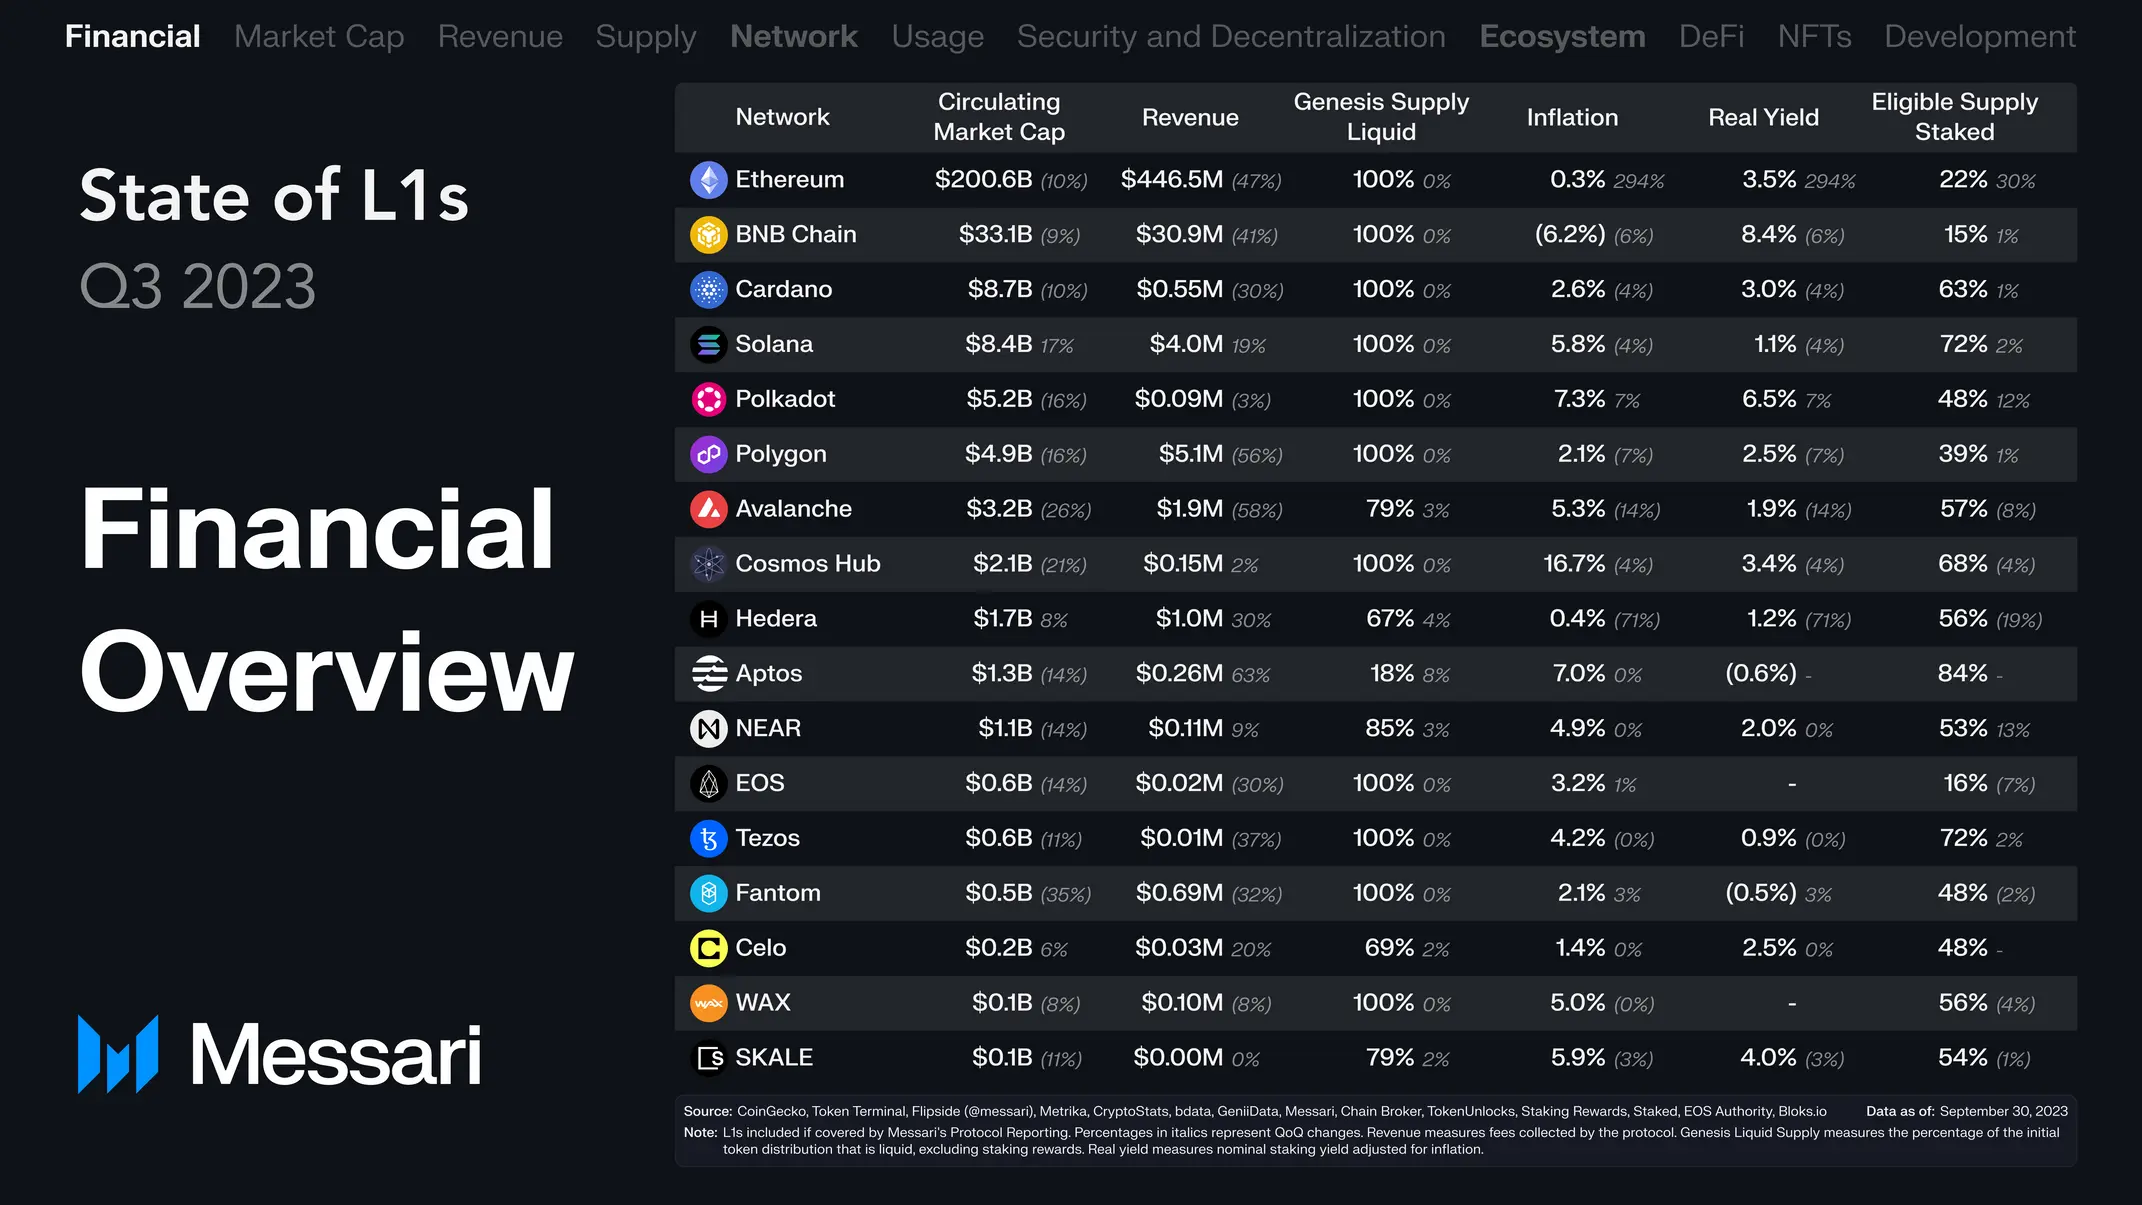
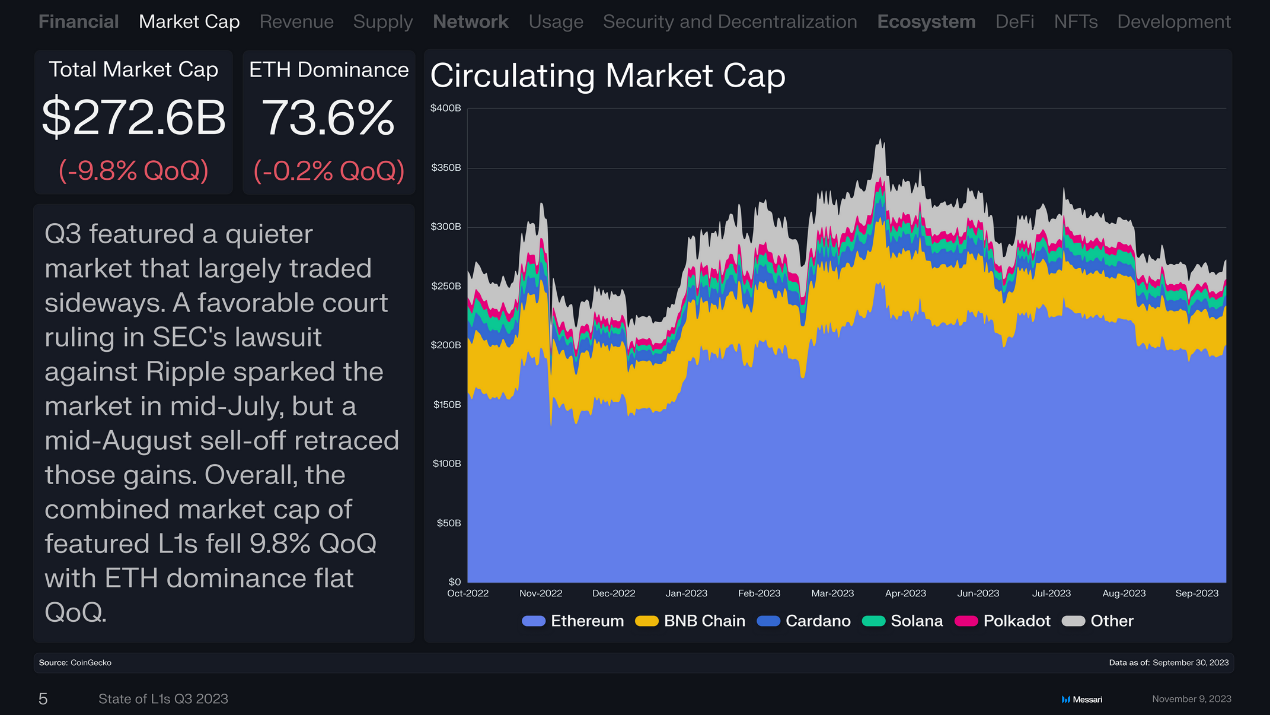
The market was relatively calm in the third quarter, primarily trading sideways. In mid-July, a favorable court ruling by the U.S. SEC against Ripple triggered a market rally, but the sell-off in August reversed those gains. Overall, the total market capitalization of the 16 public chains was $272.6 billion, a quarter-on-quarter decrease of 9.8%; Ethereum accounted for 73.6%, down 0.2%, remaining relatively stable.
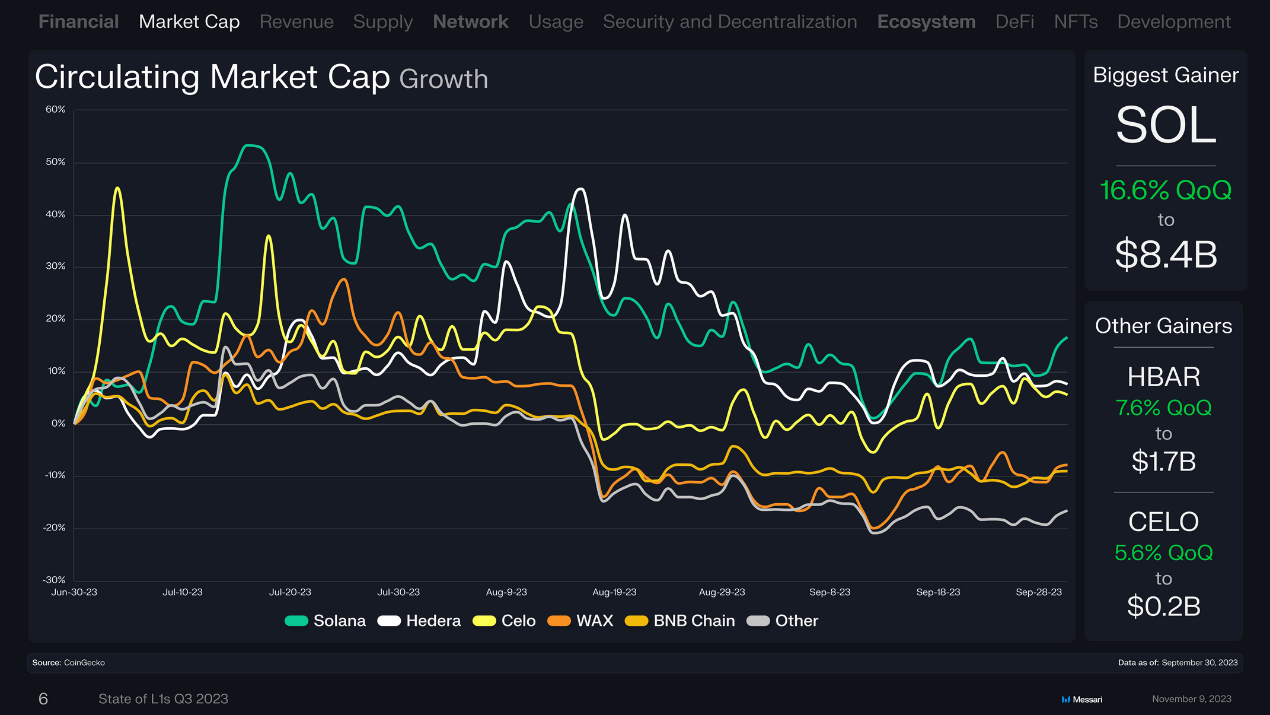
The highest growth in circulating market value was seen in Solana (SOL), which increased by 16.6% to $8.4 billion; second was Hedera (HBAR), with a 7.6% increase to $1.7 billion; third was Celo (CELO), with a 5.6% increase to $200 million.
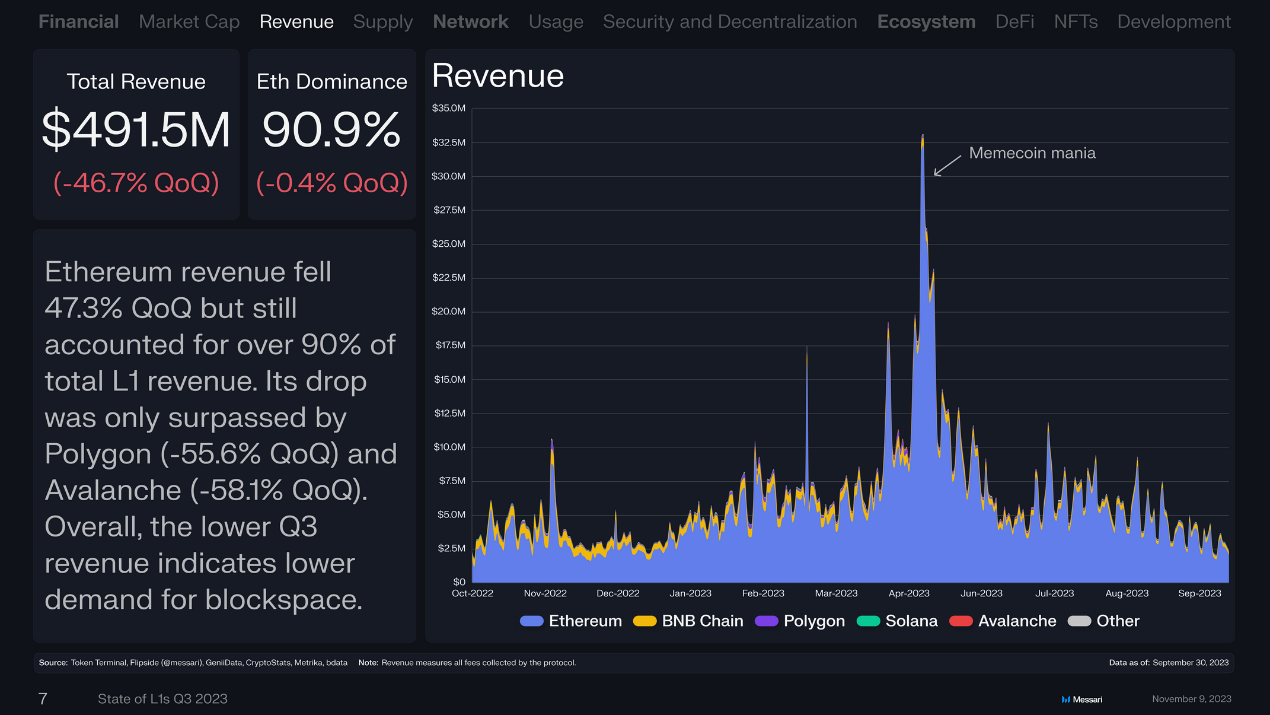
The total revenue of the 16 public chains was $491.5 million, a quarter-on-quarter decrease of 46.7%. Ethereum's revenue decreased by 47.3% quarter-on-quarter but still accounted for over 90% of the total revenue of the 16 public chains. The decline was only surpassed by Polygon (down 55.6% quarter-on-quarter) and Avalanche (down 58.1% quarter-on-quarter). Overall, the low revenue in the third quarter indicates a lower demand for block space.
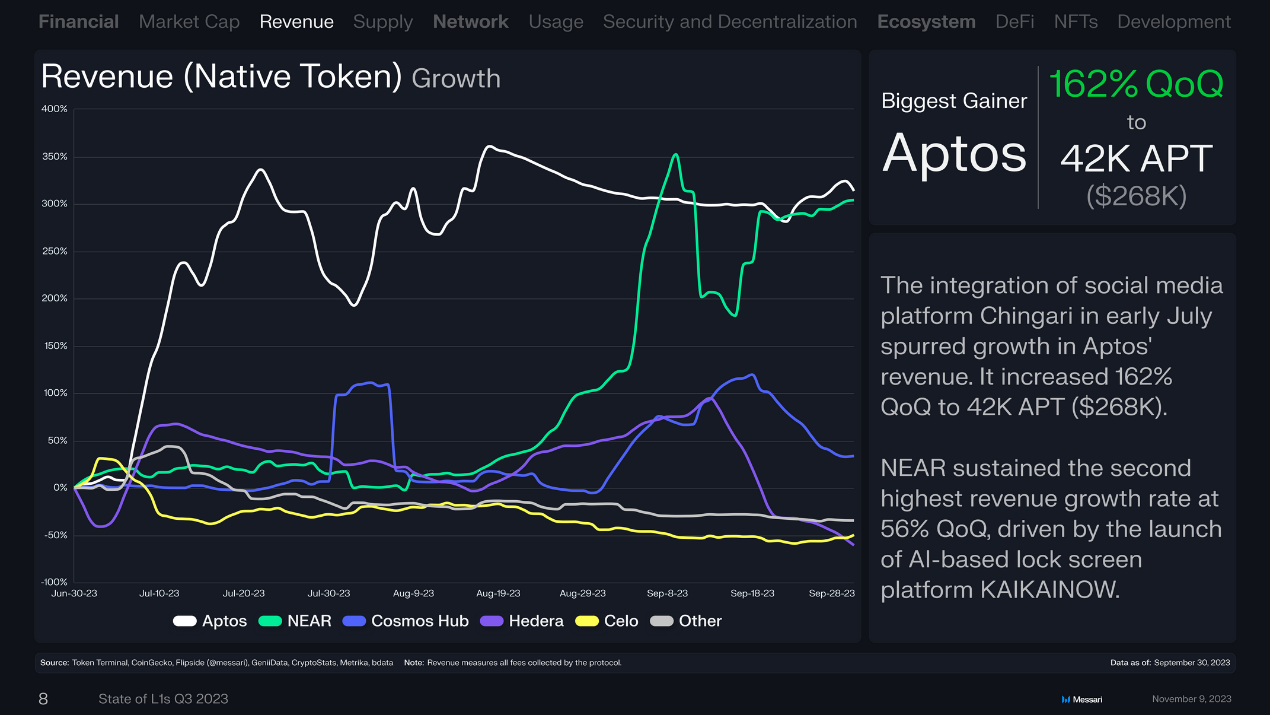
Revenue (Native Token) Growth
In early July, the launch of the Indian short video social app Chingari stimulated revenue growth for Aptos. The quarter-on-quarter growth was 162%, reaching 42,000 APT (approximately $268,000).
Driven by the AI-based lock screen platform KAIKAINOW, NEAR maintained the second highest quarter-on-quarter growth, increasing by 56%. *(Note: * Cosmose AI company released a new technology called KAIKAINOW, which uses AI and blockchain technologies. KAIKAINOW is built on the NEAR protocol and helps users obtain information and interact with the surrounding world without unlocking their phone screens.)*
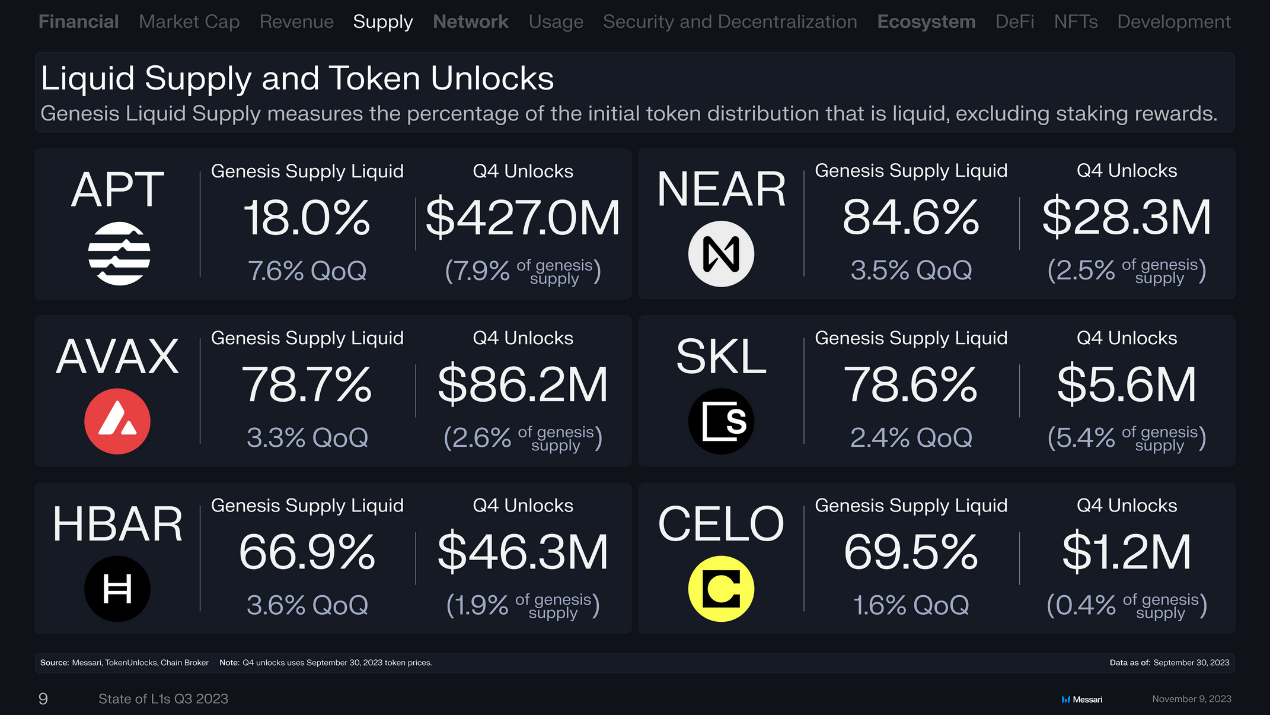
Liquidity Supply and Token Unlocking
The following chart measures the percentage of initial token distribution for liquidity, excluding staking rewards, and the amount set to unlock in Q4.
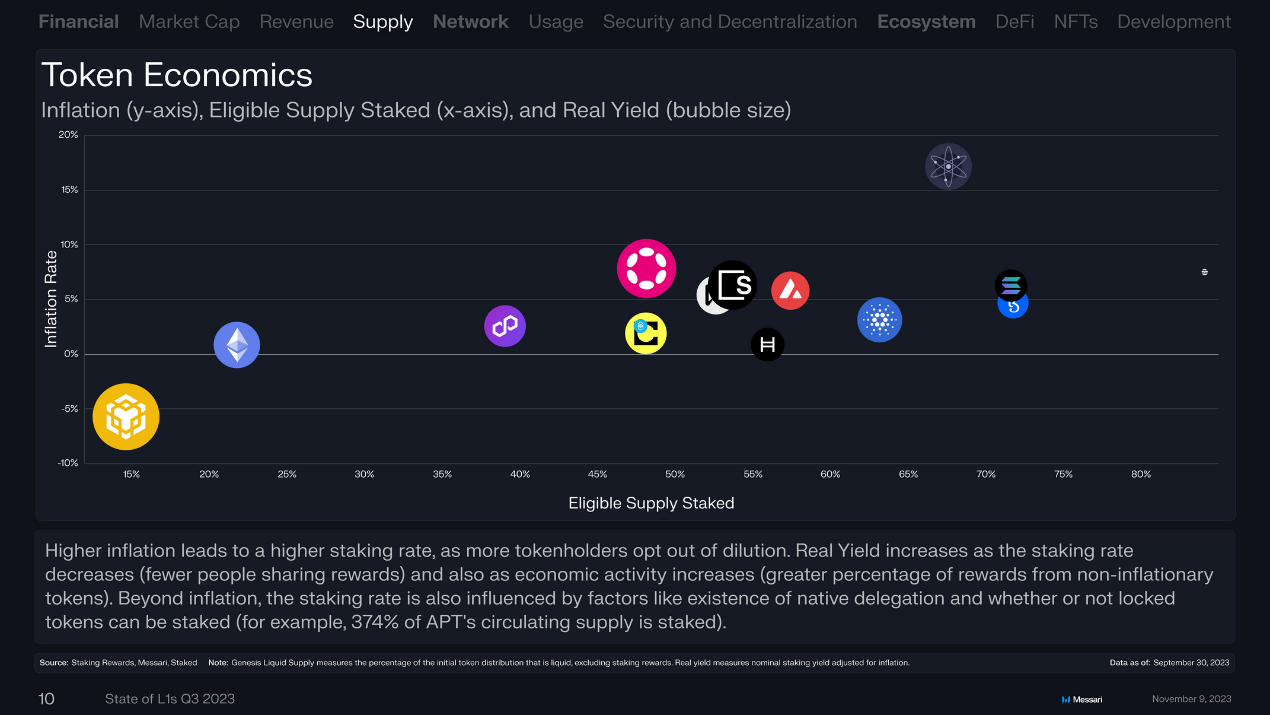
Token Economics
Inflation (y-axis), qualified supply staking (x-axis), and actual yield (circle size)
Higher inflation leads to higher staking rates, as more token holders choose not to dilute. As staking rates decrease (fewer people sharing rewards) and economic activity increases (the proportion of rewards from non-inflationary tokens increases), actual yields will also rise. In addition to inflation, staking rates are influenced by the presence of native delegation and whether locked tokens can be staked (for example, 374% of APT's circulating supply is staked).
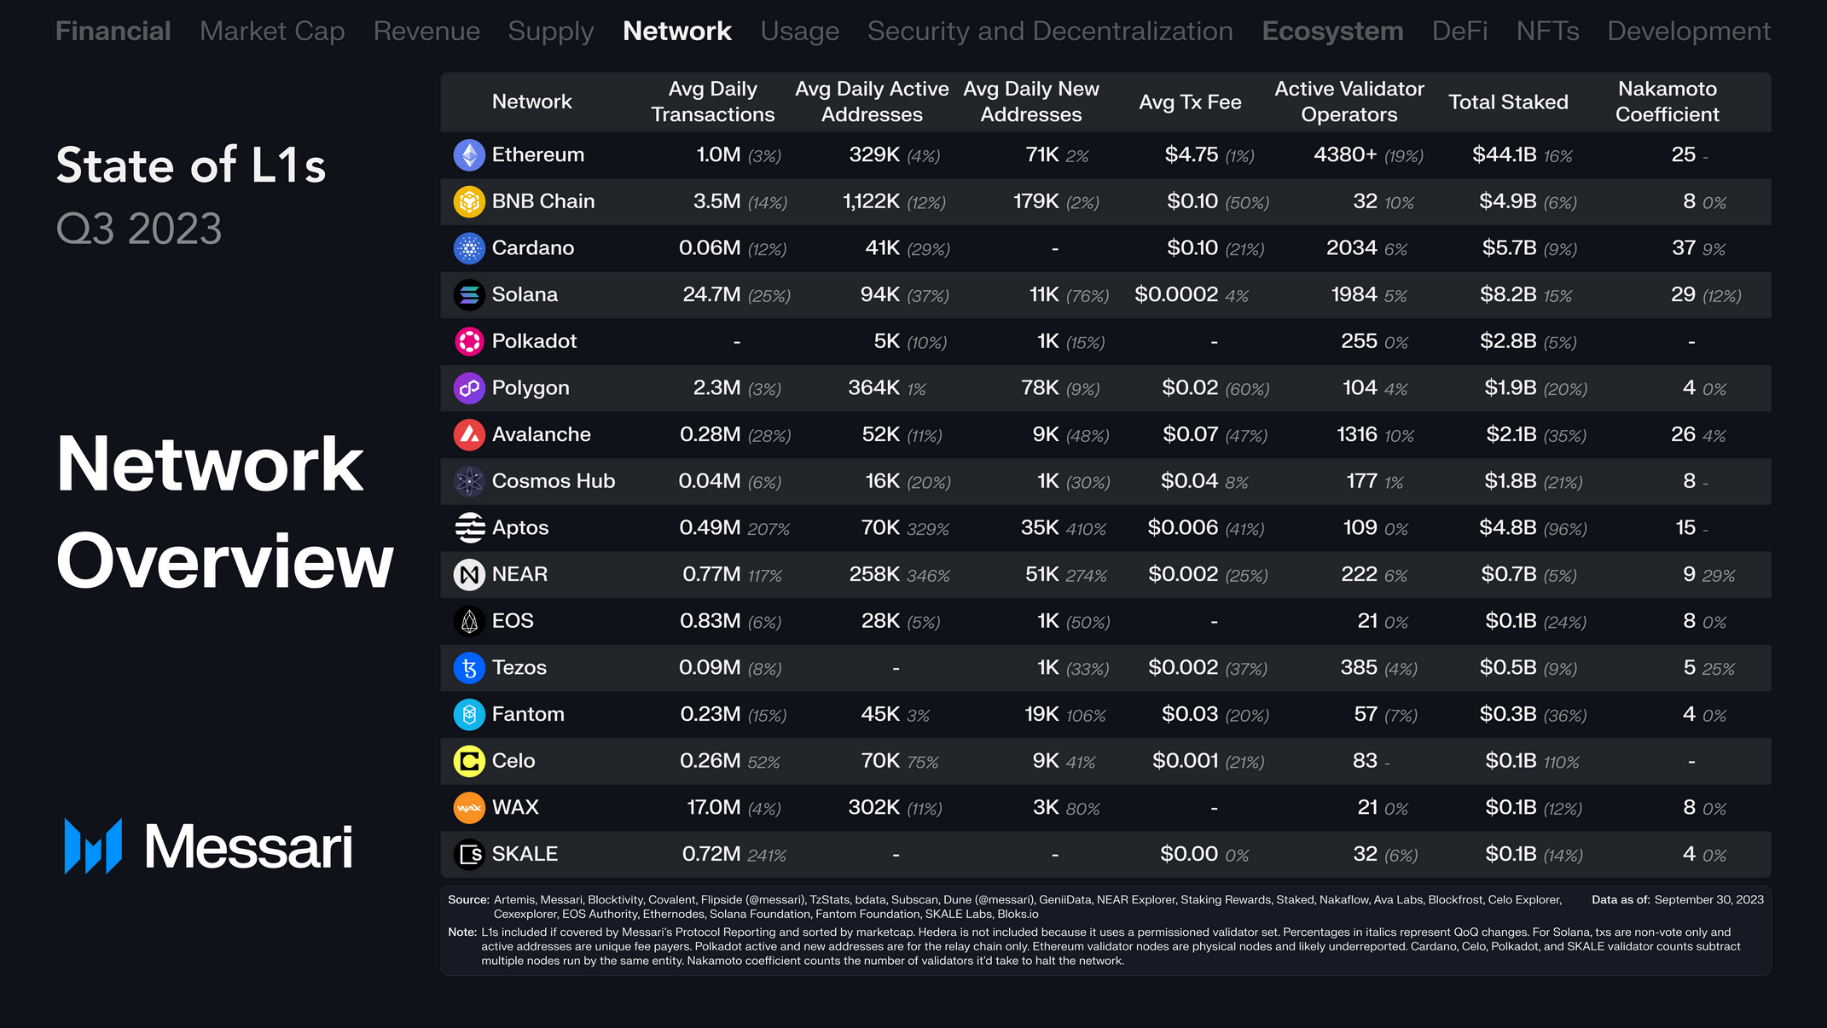
Network Overview
The average daily transaction volume on the Ethereum sidechain SKALE increased by 241% quarter-on-quarter to 719,000 transactions, primarily driven by the Web3 protocol Exorde. Exorde encourages users to collect and submit data from social networks to create market sentiment ratings, identify trends, and other analytical tools.
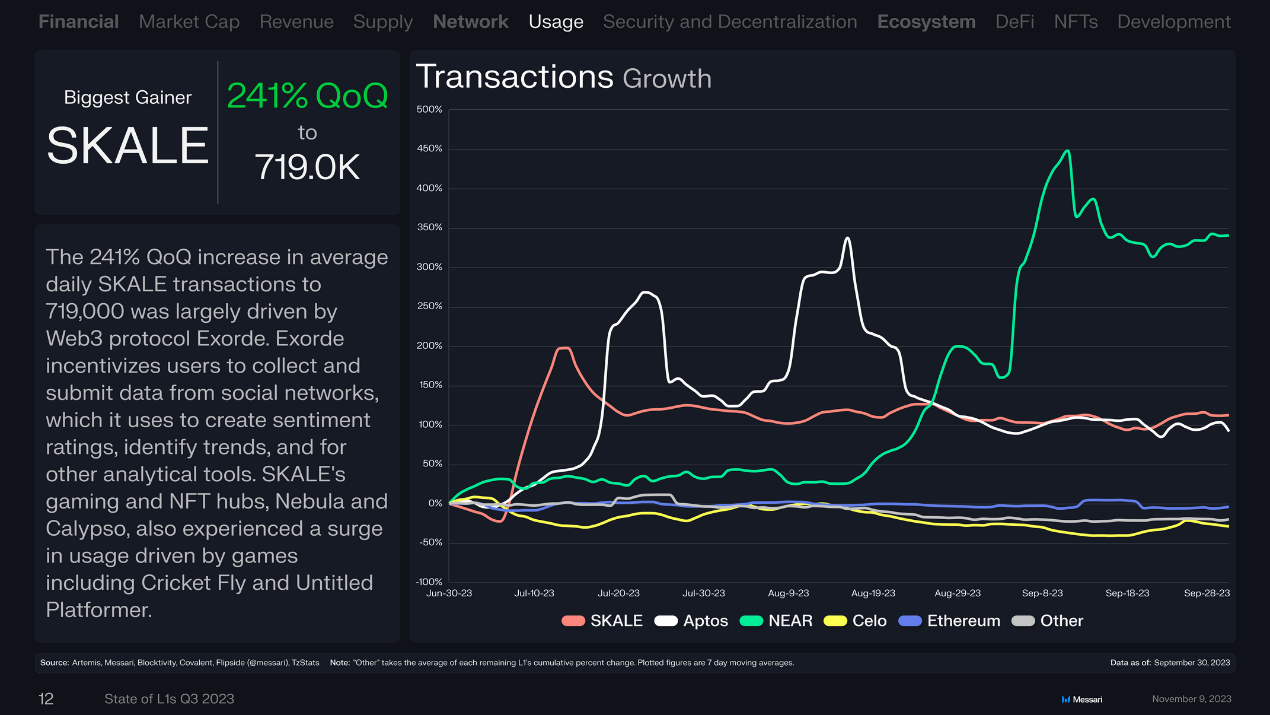
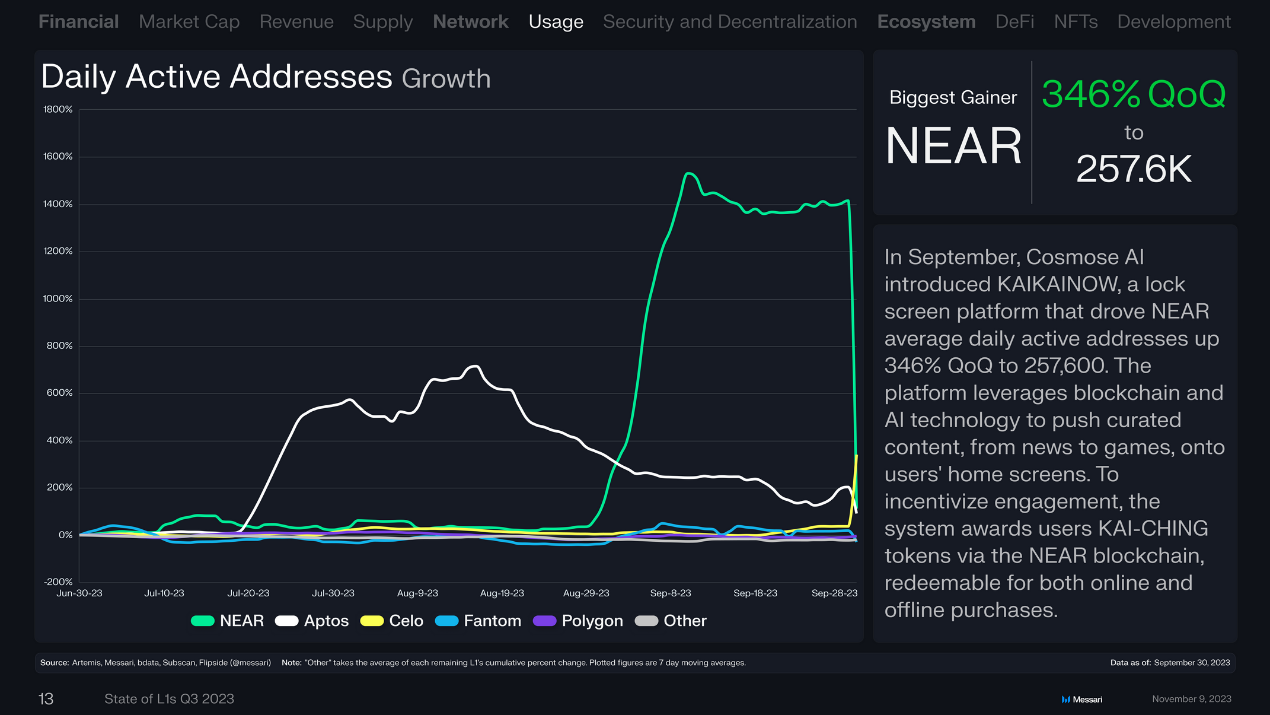
In September, Cosmose AI launched the KAIKAINOW lock screen platform, leading to a 346% quarter-on-quarter increase in NEAR's average daily active addresses, reaching 257,600. The platform uses blockchain and AI technology to push curated content from news to games to users' home screens. To incentivize user participation, the system rewards users with KAI-CHING tokens through the NEAR blockchain, which can be purchased online and offline.
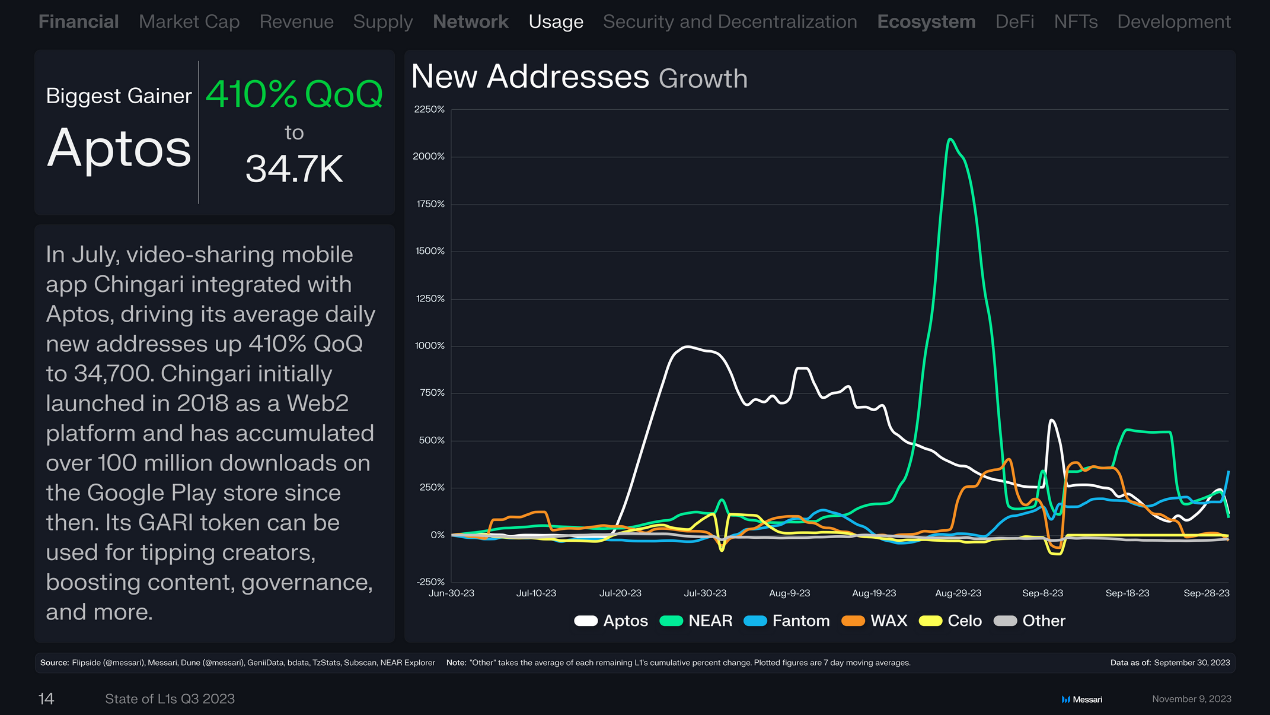
In July, the video-sharing mobile app Chingari integrated with Aptos, resulting in a 410% quarter-on-quarter increase in daily new addresses to 34,700. Chingari was initially launched in 2018 as a Web2 platform and has since accumulated over 100 million downloads on the Google Play Store. Its GARI token can be used for tipping creators, boosting content, governance, and more.
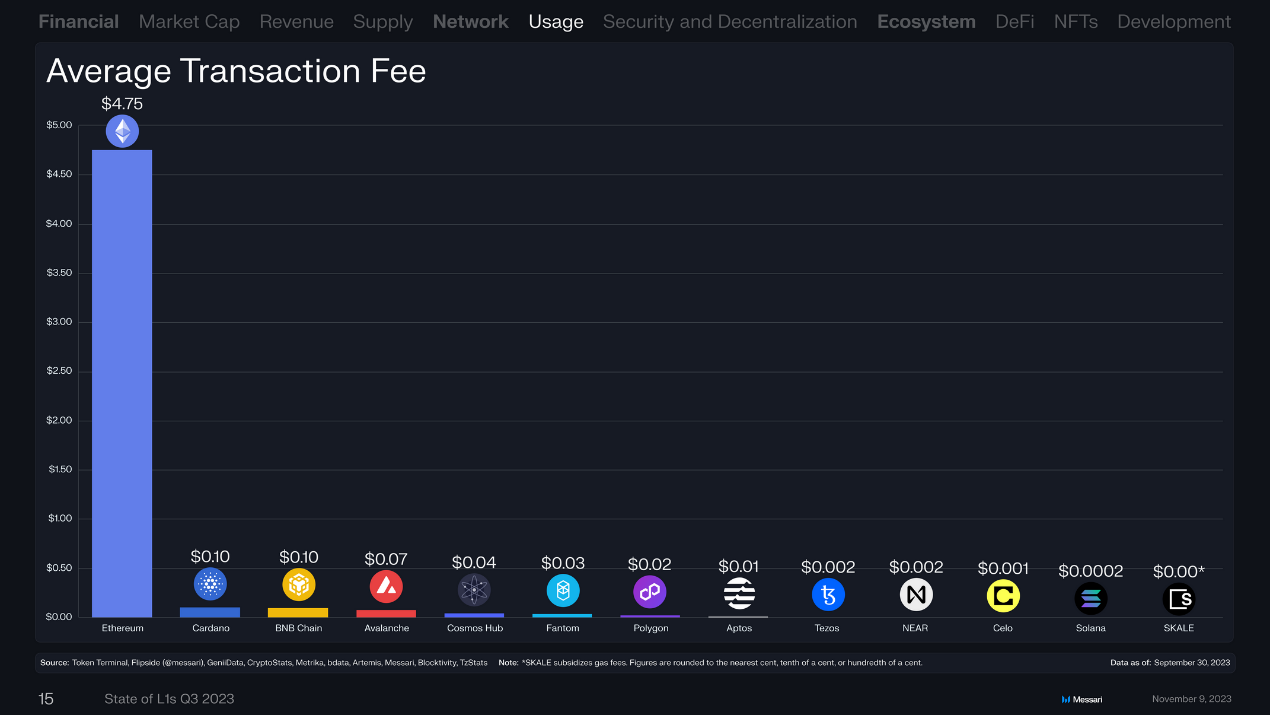
Average Transaction Fees
The average transaction fee on the Ethereum chain was $4.75, far exceeding other public chains. Cardano and BNB Chain tied for second place with an average transaction fee of $0.10. Following them were Avalanche ($0.07), Cosmos Hub ($0.04), Fantom ($0.03), Polygon ($0.02), Aptos ($0.01), Tezos ($0.002), NEAR ($0.002), Celo ($0.001), and Solana ($0.0002).
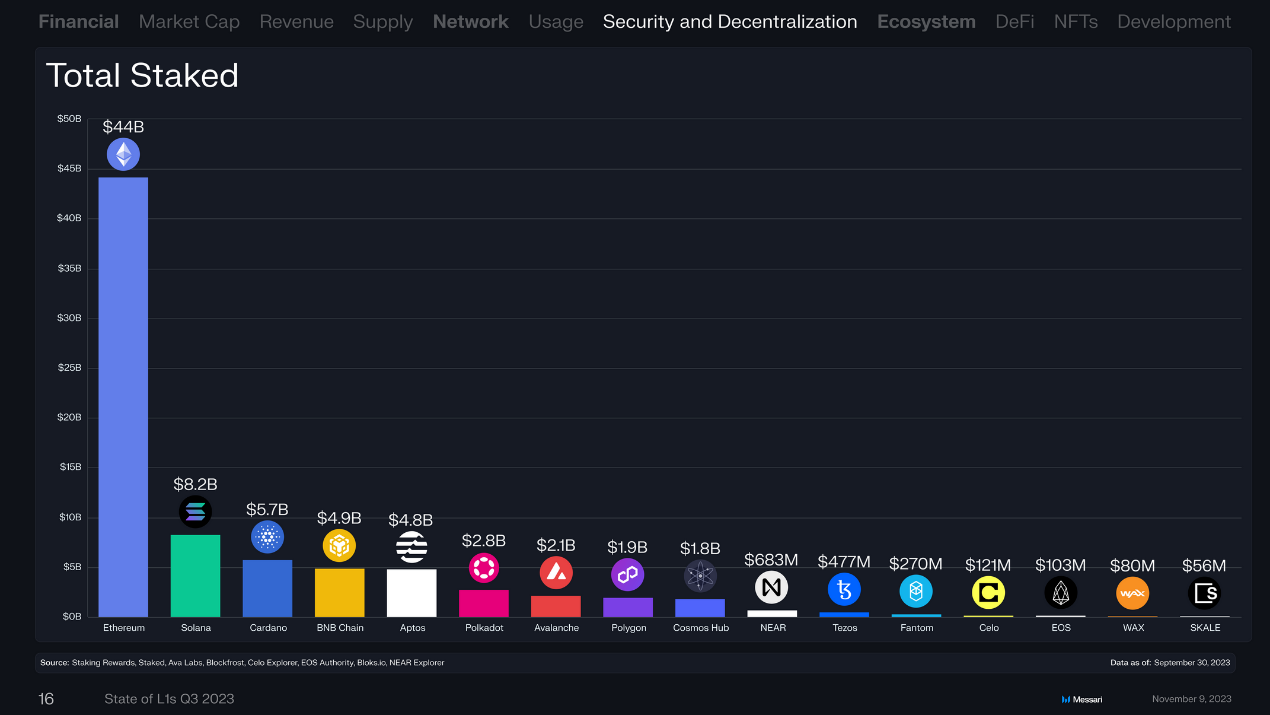
Total Staked Value
The total staked value on the Ethereum chain remained the highest at $44 billion, followed by Solana ($8.2 billion), Cardano ($5.7 billion), BNB Chain ($4.9 billion), Aptos ($4.8 billion), Polkadot ($2.8 billion), and Avalanche ($2.1 billion).
Ecological Overview
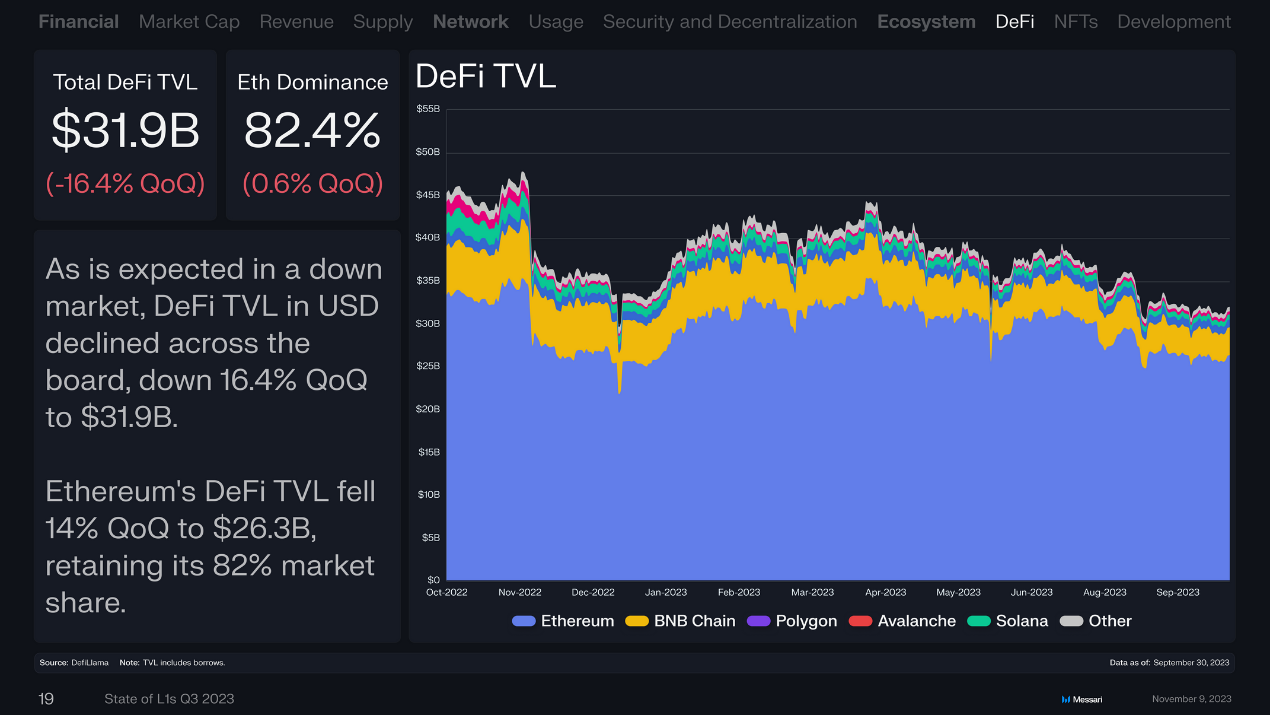
As expected in a sluggish market, the DeFi TVL measured in USD declined across the board, decreasing by 16.4% to $31.9 billion. Ethereum's DeFi TVL decreased by 14% to $26.3 billion but retained an 82% market share.
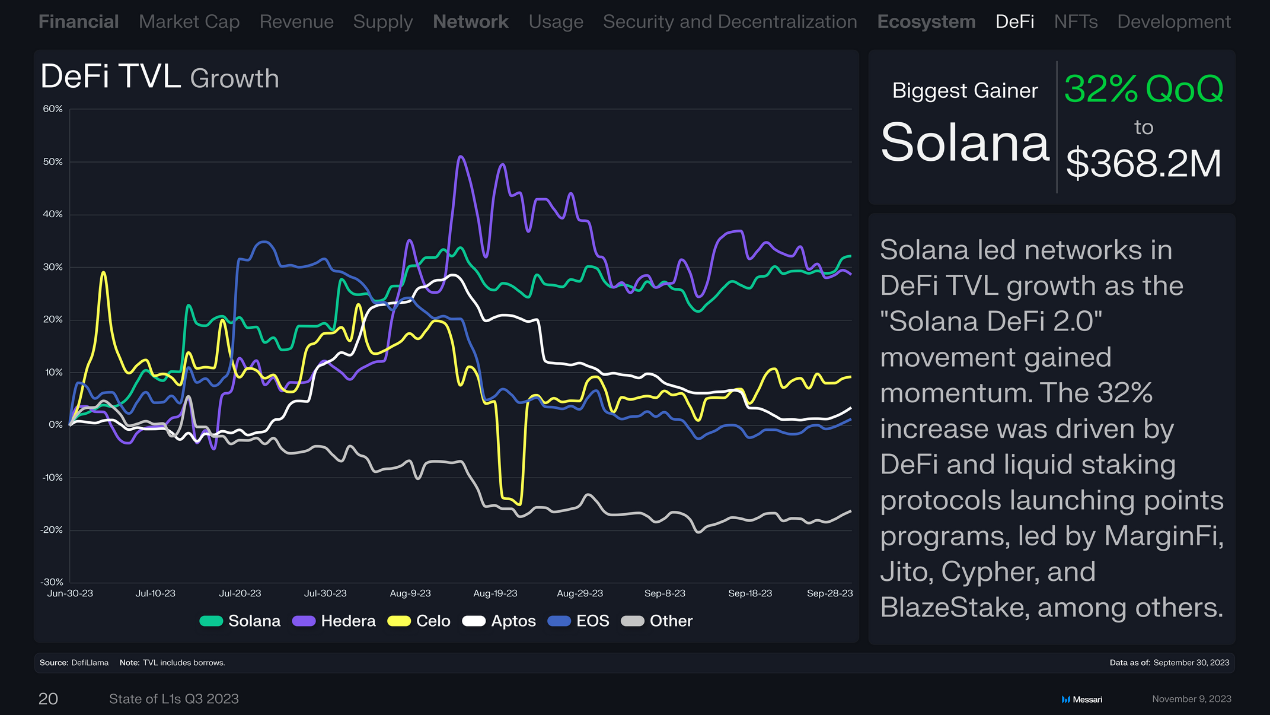
With the strong momentum of "Solana DeFi 2.0," Solana led in DeFi TVL growth. The 32% increase was driven by incentive programs launched by DeFi and liquid staking protocols, particularly represented by protocols like MarginFi, Jito, Cypher, and BlazeStake.
The market capitalization of stablecoins was $74.9 billion, continuing to decline with a quarter-on-quarter decrease of 5.7%. It reached an annual low in the third quarter. Events such as the regulatory "Operation Chokepoint 2.0," the temporary decoupling of USDC, and rising interest rates led to a reduction in the supply of stablecoins. However, the downward trend is slowing and may be nearing a bottom.
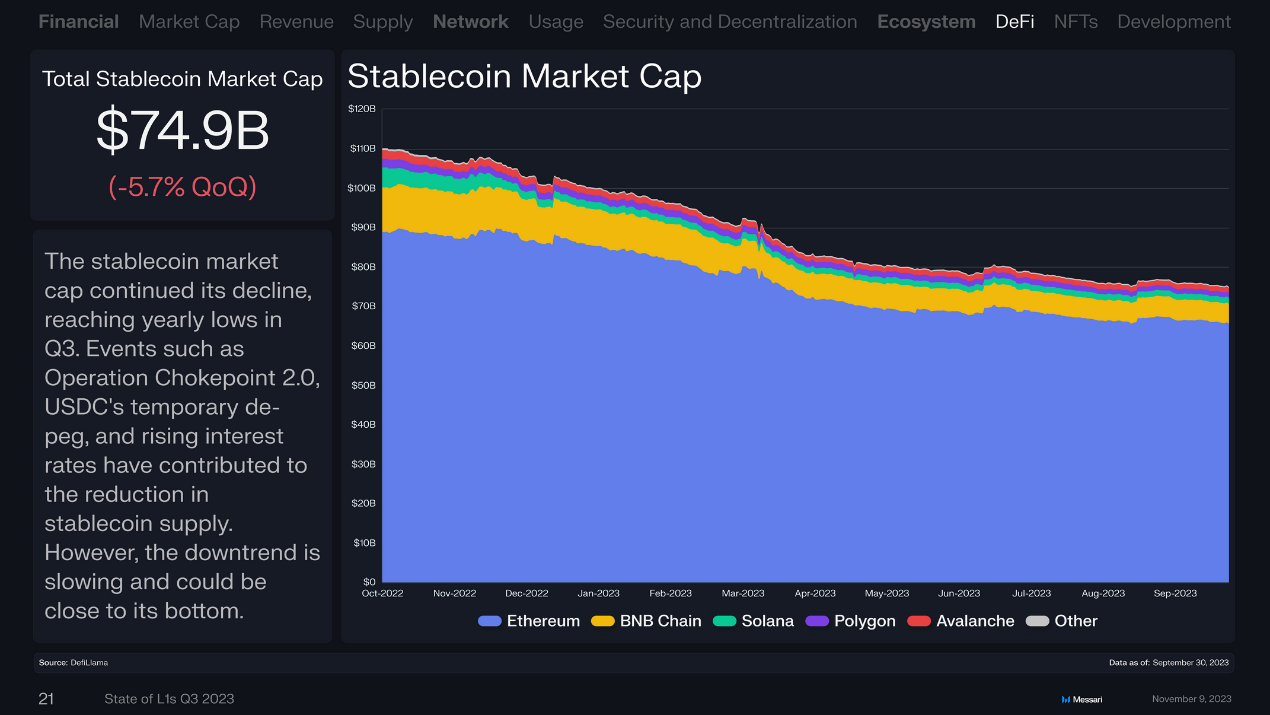
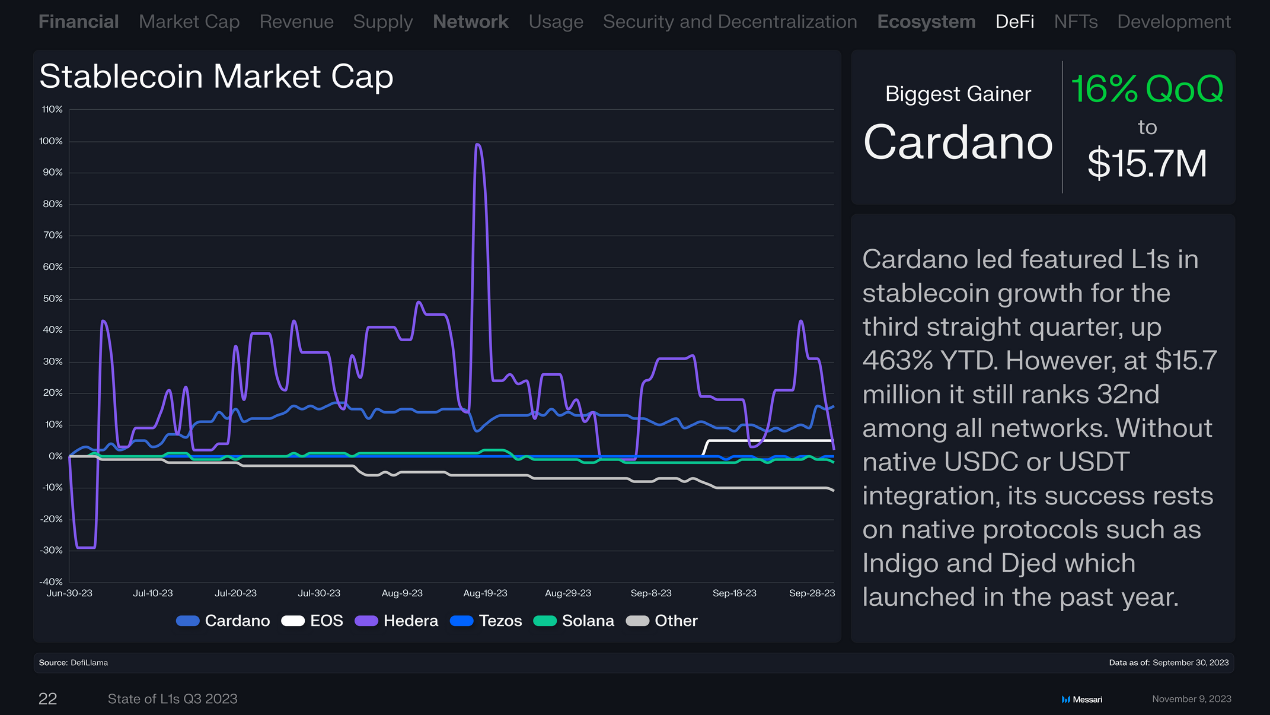
Cardano led L1 stablecoin growth for the third consecutive quarter, growing 463% year-to-date. However, it still ranked 32nd among all networks with $15.7 million. Cardano's success relies on native protocols like Indigo and Djed launched last year, without native USDC or USDT integration.
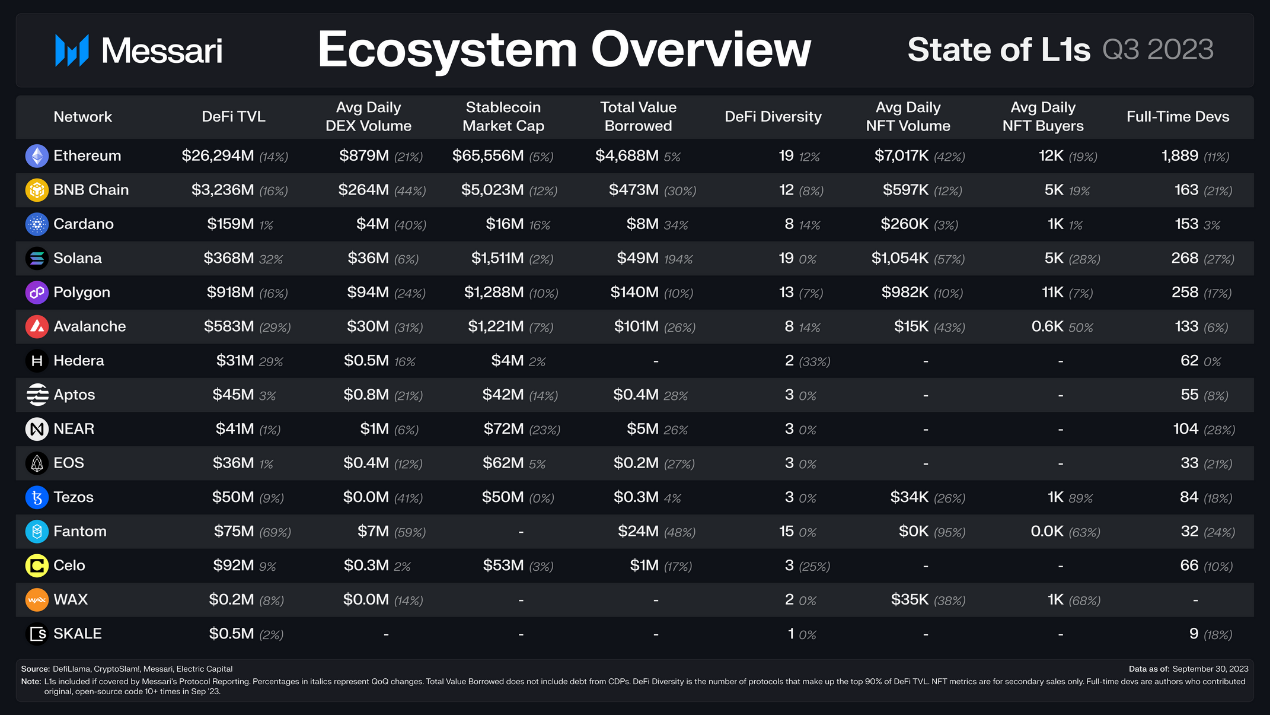
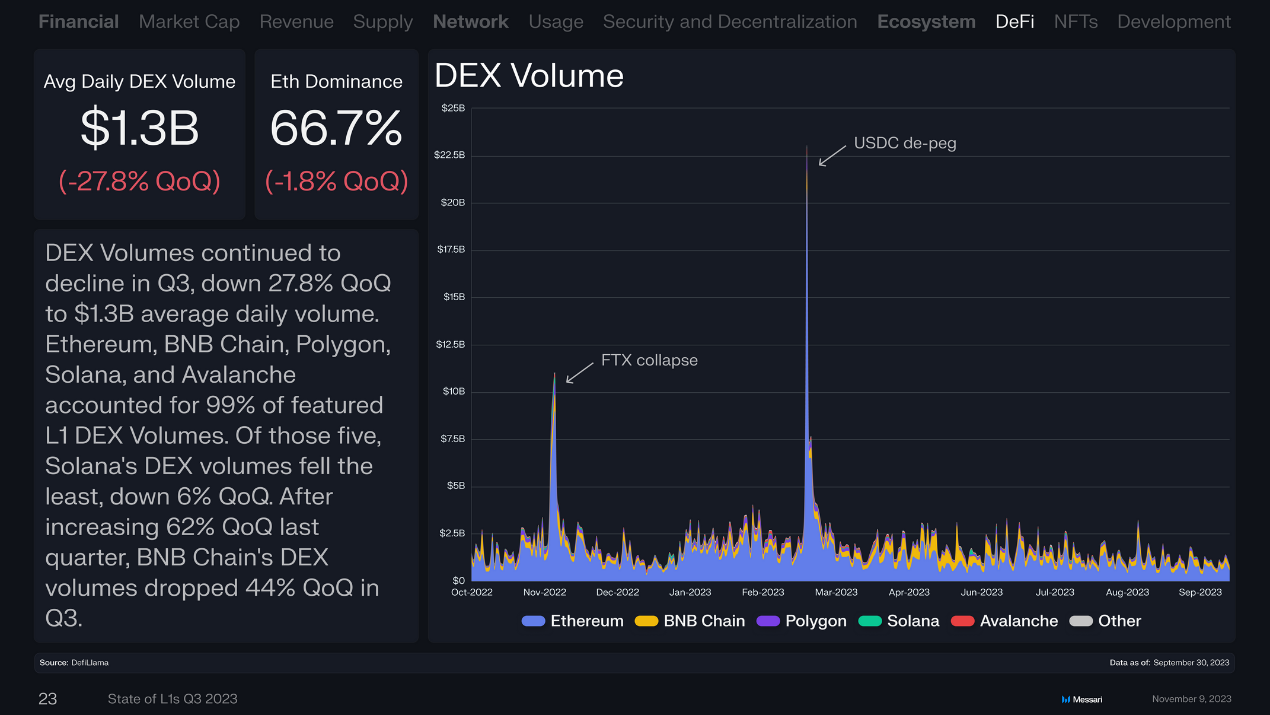
In the third quarter, DEX trading volume continued to decline, decreasing by 27.8% quarter-on-quarter, with an average daily trading volume of $1.3 billion. Ethereum, BNB Chain, Polygon, Solana, and Avalanche accounted for 99% of L1 public chain DEX trading volume. Among these five public chains, Solana experienced the smallest decline in DEX trading volume, down 6% quarter-on-quarter. After a 62% quarter-on-quarter increase in the previous quarter, BNB Chain's DEX trading volume decreased by 44% in the third quarter.
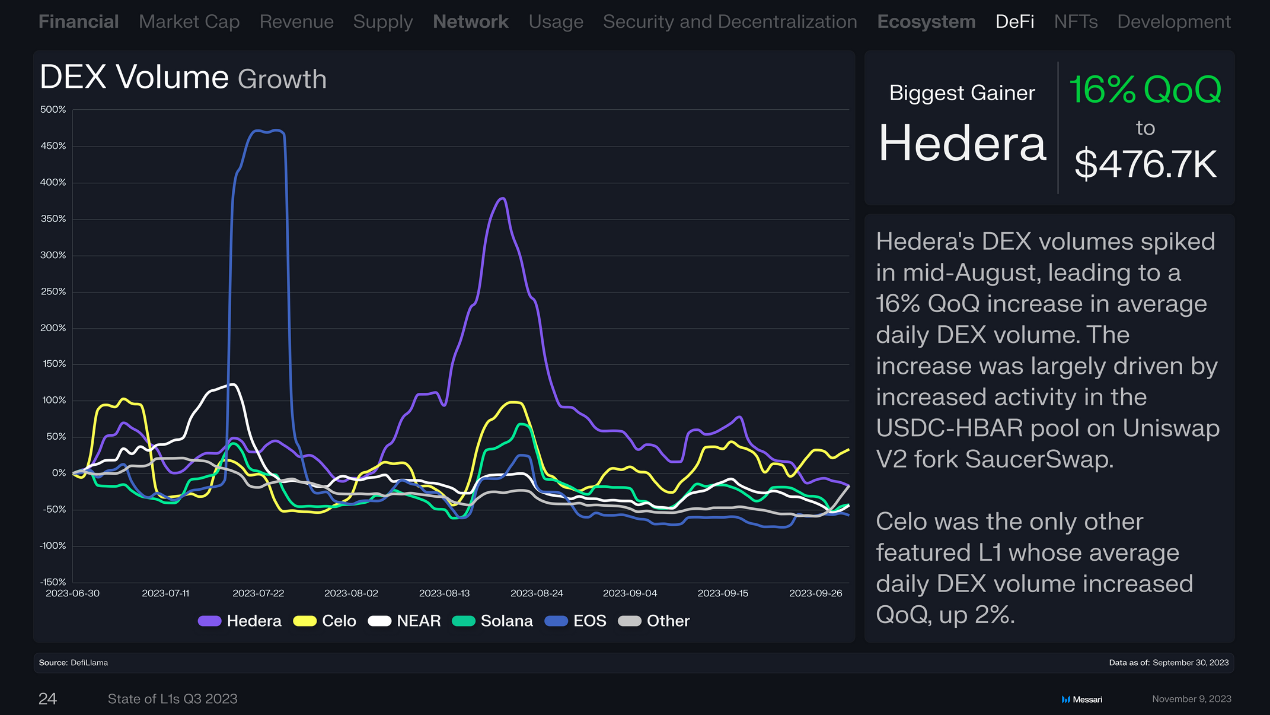
Hedera's DEX trading volume surged in mid-August, with an average daily DEX trading volume increasing by 16% quarter-on-quarter. This growth was mainly due to increased activity in the USDC-HBAR pool on the Uniswap fork project SaucerSwap.
Celo was the only mainstream L1 blockchain with a 2% quarter-on-quarter increase in average daily DEX trading volume.
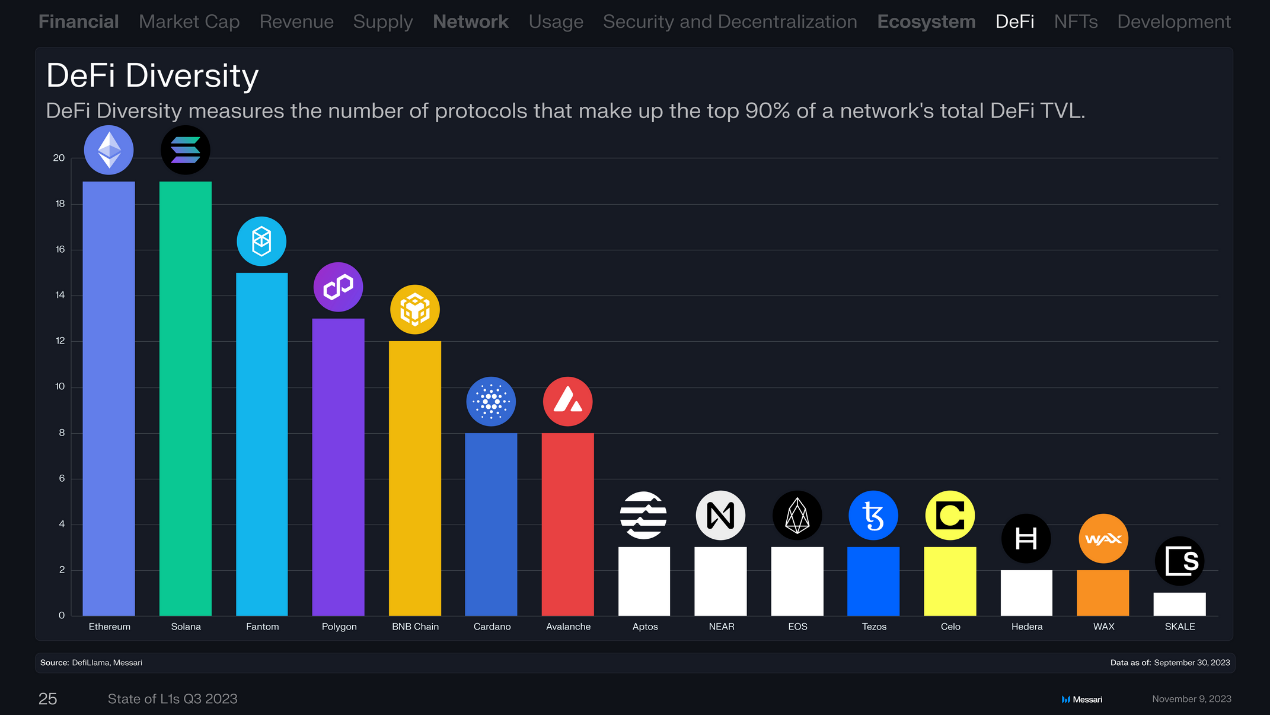
DeFi Diversification
DeFi diversity measures the number of protocols that account for the top 90% of the total DeFi TVL on the network. Ethereum and Solana ranked first and second.
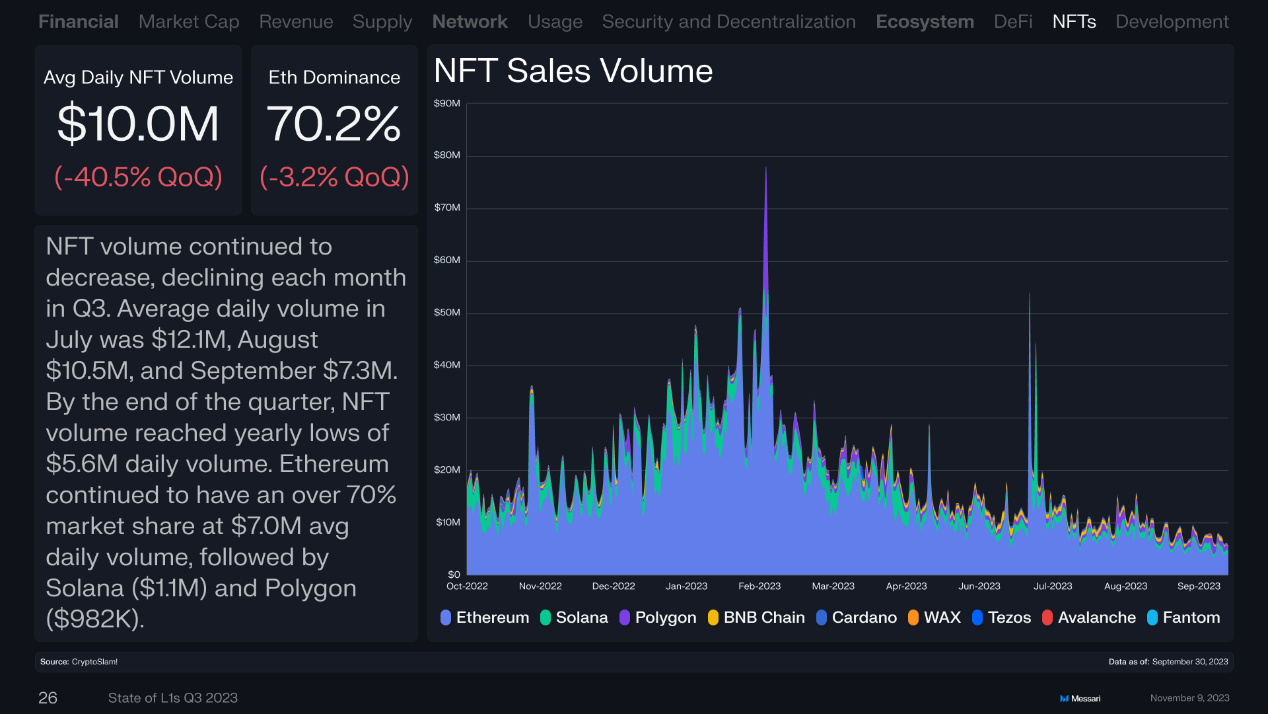
NFT trading volume continued to decline, decreasing every month in the third quarter. The average daily trading volume was $12.1 million in July, $10.5 million in August, and $730,000 in September. By the end of the quarter, NFT trading volume had dropped to an annual low of $5.6 million. Ethereum continued to dominate with an average daily trading volume of $7 million, accounting for over 70% of the market share, followed by Solana ($1.1 million) and Polygon ($982,000).
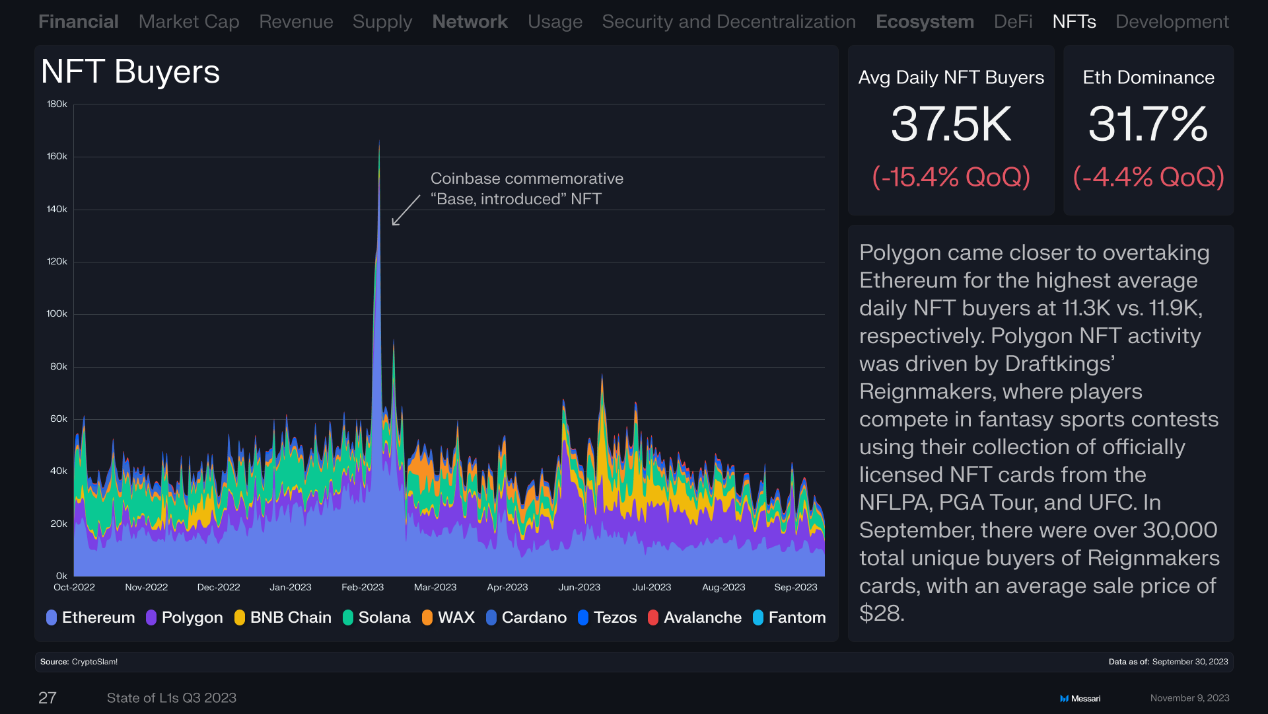
Polygon is close to Ethereum, with average daily NFT buyers at 11,300 and 11,900, respectively. The growth in Polygon NFT activity was driven by DraftKings' Reignmaker NFT series, where players use their collected NFLPA, PGA Tour, and UFC officially licensed NFT cards to participate in fantasy sports competitions. In September, the total number of unique buyers for Reignmaker exceeded 30,000, with an average price of $28.
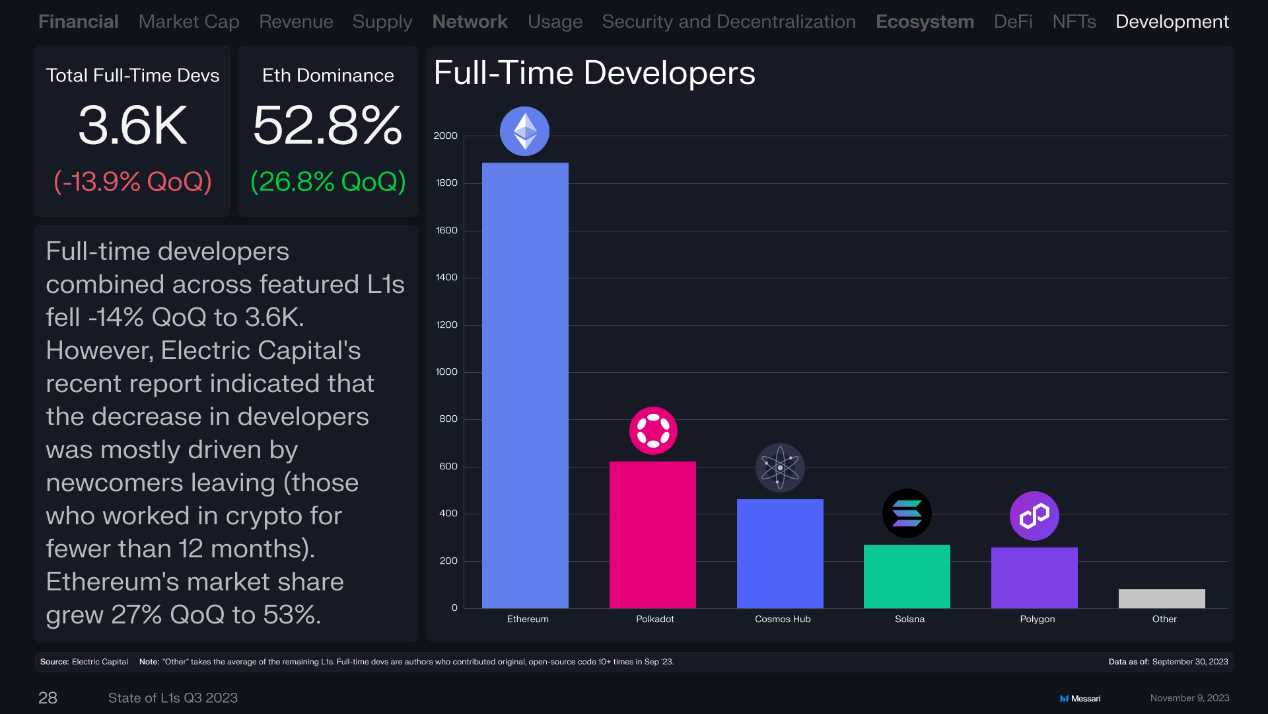
The number of full-time developers decreased by 14% quarter-on-quarter to 36,000. However, a recent report by Electric Capital indicated that the decrease in developers was mainly due to the exit of newcomers (those who have worked in the crypto field for less than 12 months). Ethereum's market share increased by 27% quarter-on-quarter to 53%.
