
Glassnode: Researching the Logic Behind the Rise of BTC and ETH from Data

 The performance of BTC and ETH exceeded traditional assets like gold by 93% and 39%, respectively.
Original Title: 《The Waterfall Effect of Capital》
Authors: Ding HAN, Checkmate, CryptoVizArt, UkuriaOC, Alice Kohn, Glassnode
Abstract
- The digital asset market achieved impressive returns in 2023, with BTC and ETH outperforming traditional assets like gold by 93% and 39%, respectively.
- The market corrections for these two major digital assets have been noticeably smaller than in previous cycles, indicating support from investors and positive capital inflows.
- Our Altseason indicator shows the first significant appreciation against the dollar since the peak of this cycle. However, it is noteworthy that this occurred against the backdrop of Bitcoin's continued dominance, with Bitcoin's market cap growing by 110% year-to-date.
In recent weeks, Bitcoin's price has risen by over 30%, partly due to positive developments related to numerous Bitcoin ETF applications submitted for SEC approval. Additionally, Bitcoin and the entire digital asset space have shown relative performance compared to traditional asset classes such as commodities, precious metals, stocks, and bonds.
In this week's report, we will explore the impressive relative performance of digital assets in 2023. So far, BTC and ETH have significantly outperformed traditional assets, while also experiencing smaller pullbacks compared to previous cycles.
Relative Resilience
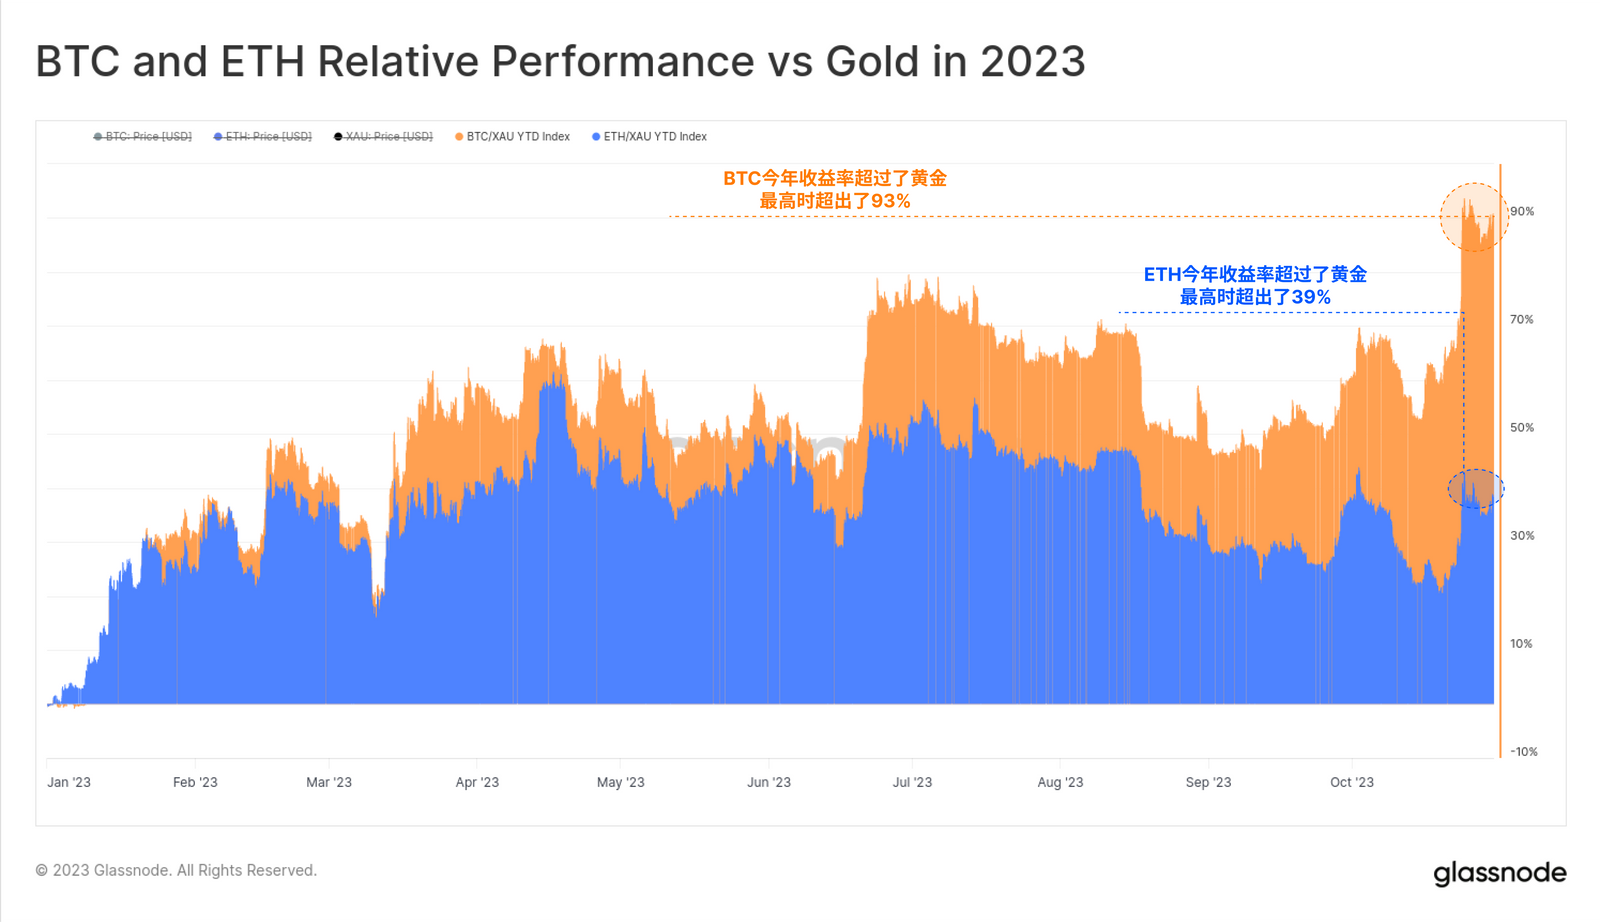
The chart below compares the prices of BTC and ETH in terms of gold, showcasing their performance relative to traditional defensive value stores. In 2023, BTC appreciated by 93% compared to gold, while ETH rose by 39%. Against the backdrop of increasing global uncertainty, the strong performance of digital assets may have attracted the attention of many traditional investors.
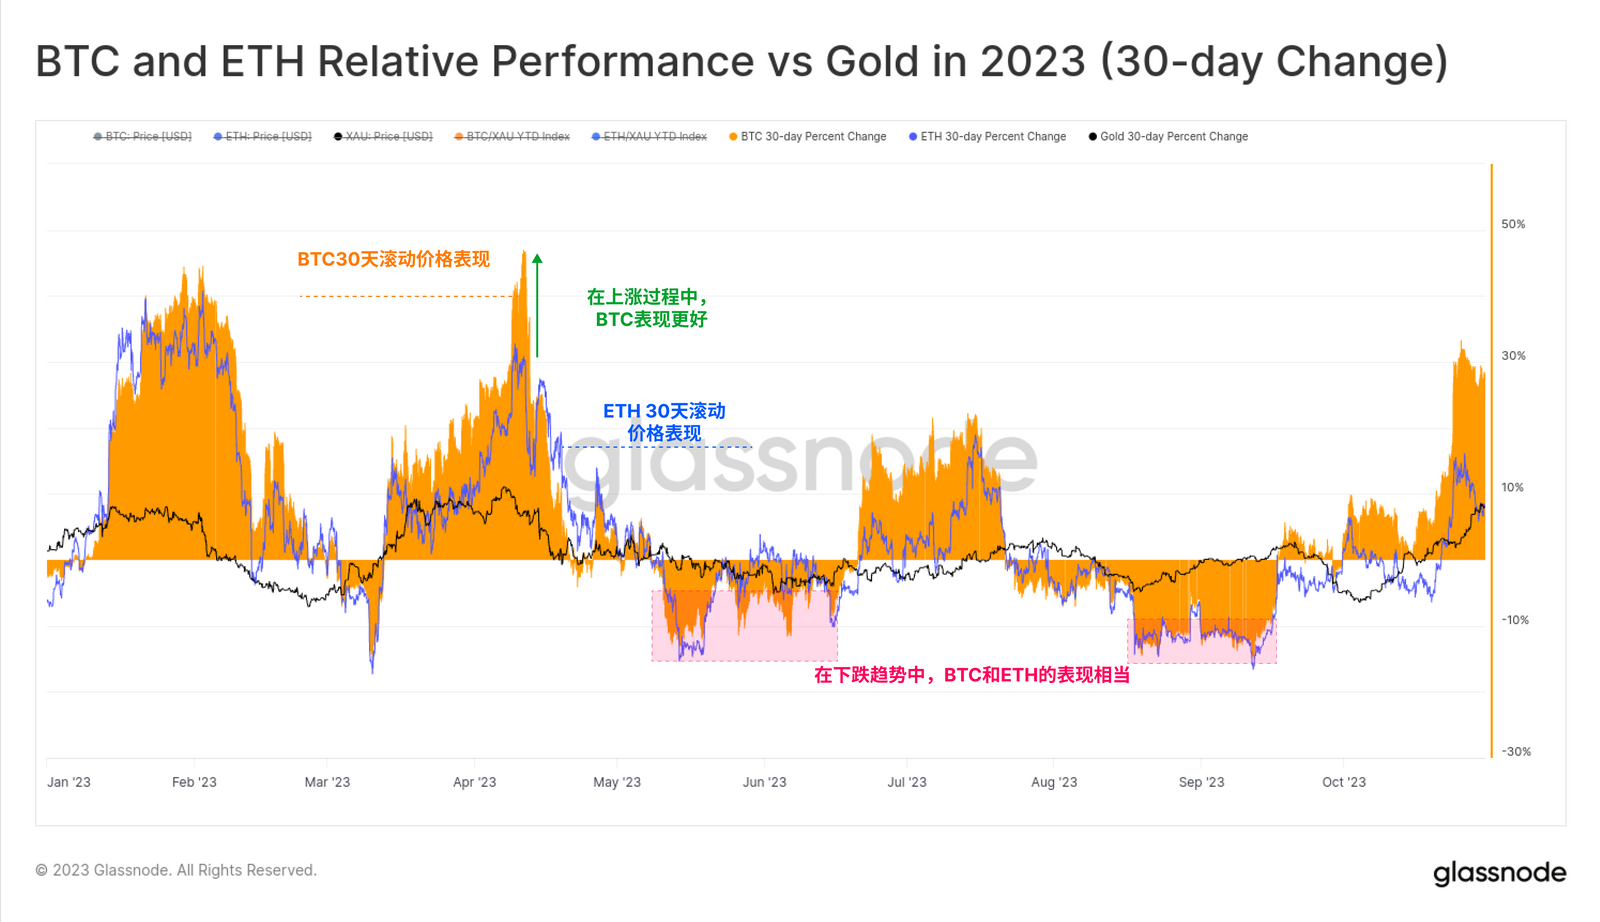
We can see that the returns of BTC and ETH have been closely correlated throughout 2023 based on a rolling 30-day benchmark. Both assets experienced similar magnitudes of decline, but Bitcoin showed stronger performance during the upswings.
We can also observe that the relative volatility of both digital assets has exceeded that of gold (black), which has shown smaller price fluctuations in both directions.
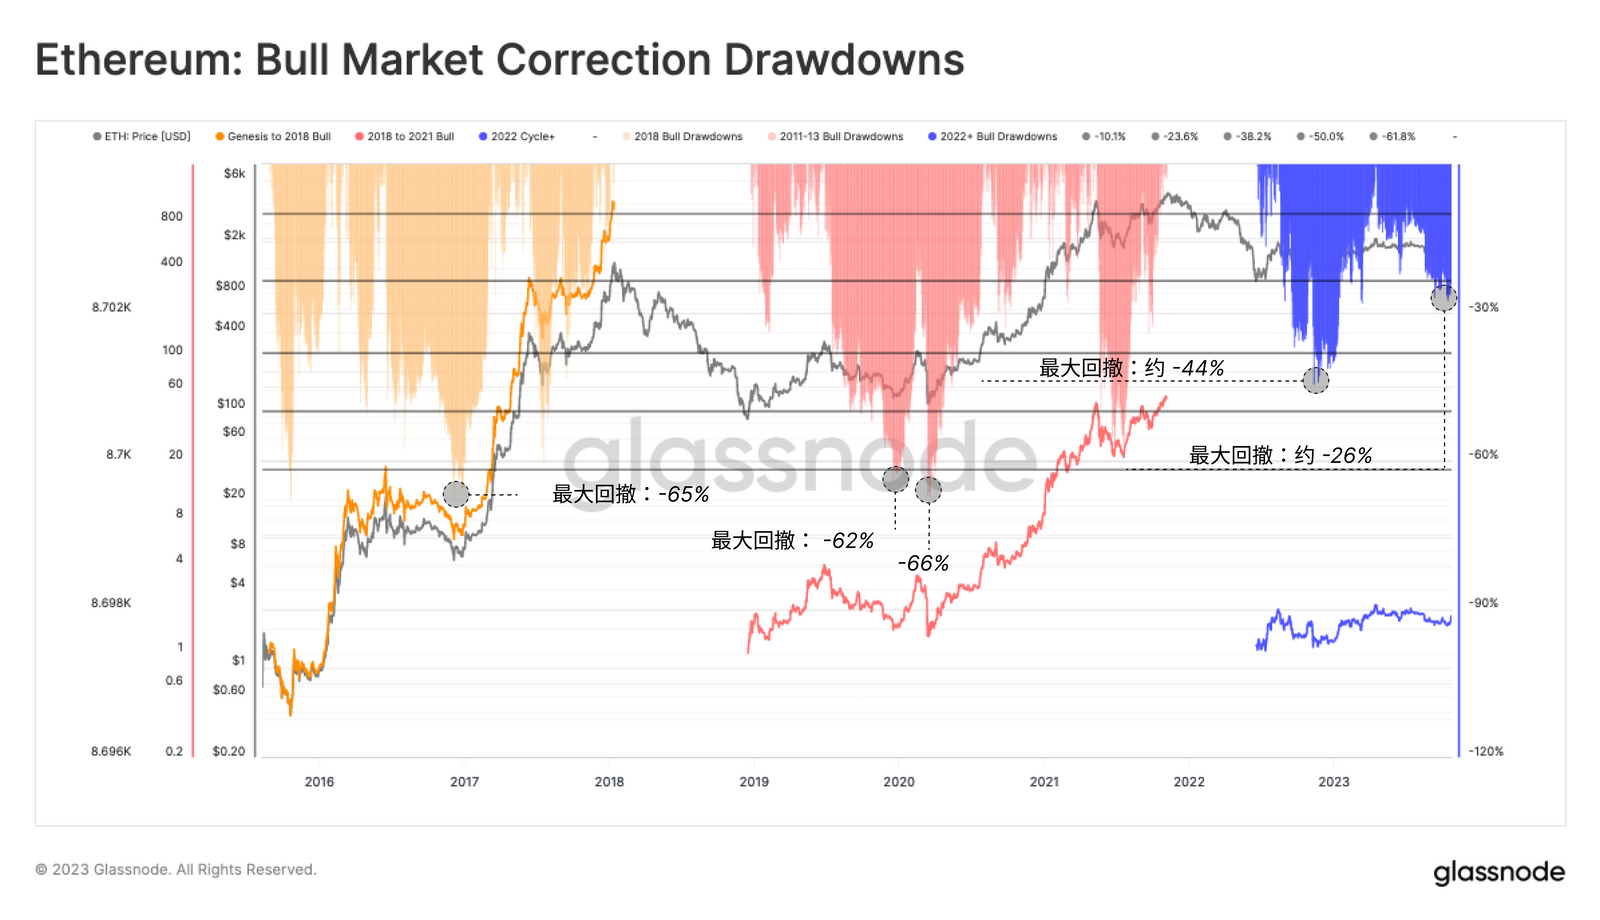
By assessing the deepest corrections within the macro uptrend, we can also observe the relative strength of digital assets. Here, we will evaluate this metric for ETH, allowing us to see its performance relative to the dollar (an external benchmark) but also in comparison to the market leader BTC (an internal benchmark).
We believe that the cycle low for ETH/USD occurred in June 2022 after the collapses of 3AC, Celsius, and LUNA-UST. Since then, the deepest ETH/USD correction relative to the local peak has been -44%, set during the FTX failure. Today, ETH is trading $2,118 below its 2023 peak, a decline of 26%, which shows a notably strong performance compared to the -60% or greater pullbacks seen in previous cycles.
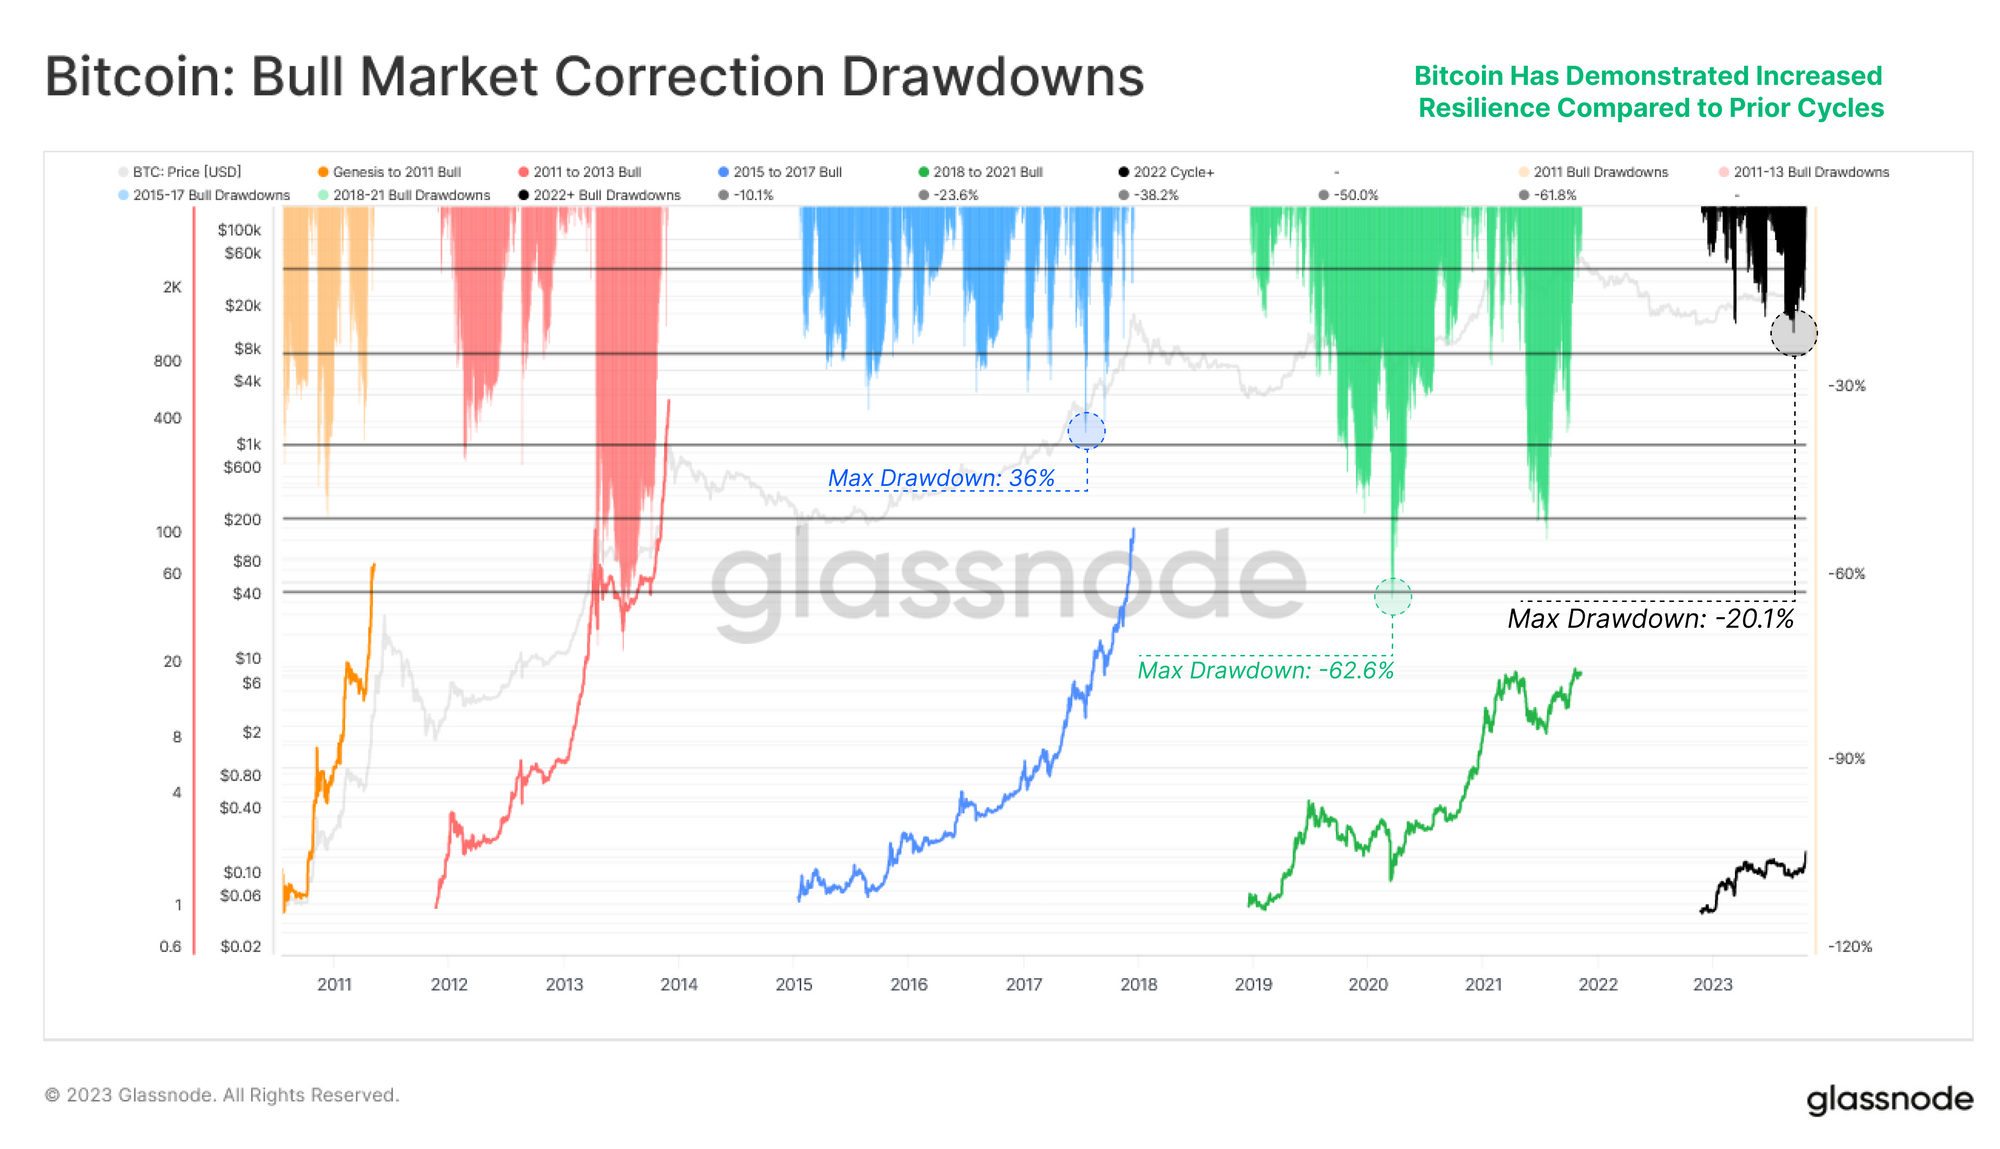
BTC's performance is also comparable, with its deepest pullback in 2023 being only -20.1%. The bull market of 2016-17 frequently saw corrections exceeding -25%, while in 2019, it pulled back over -62% from its July 2019 peak of $14,000.
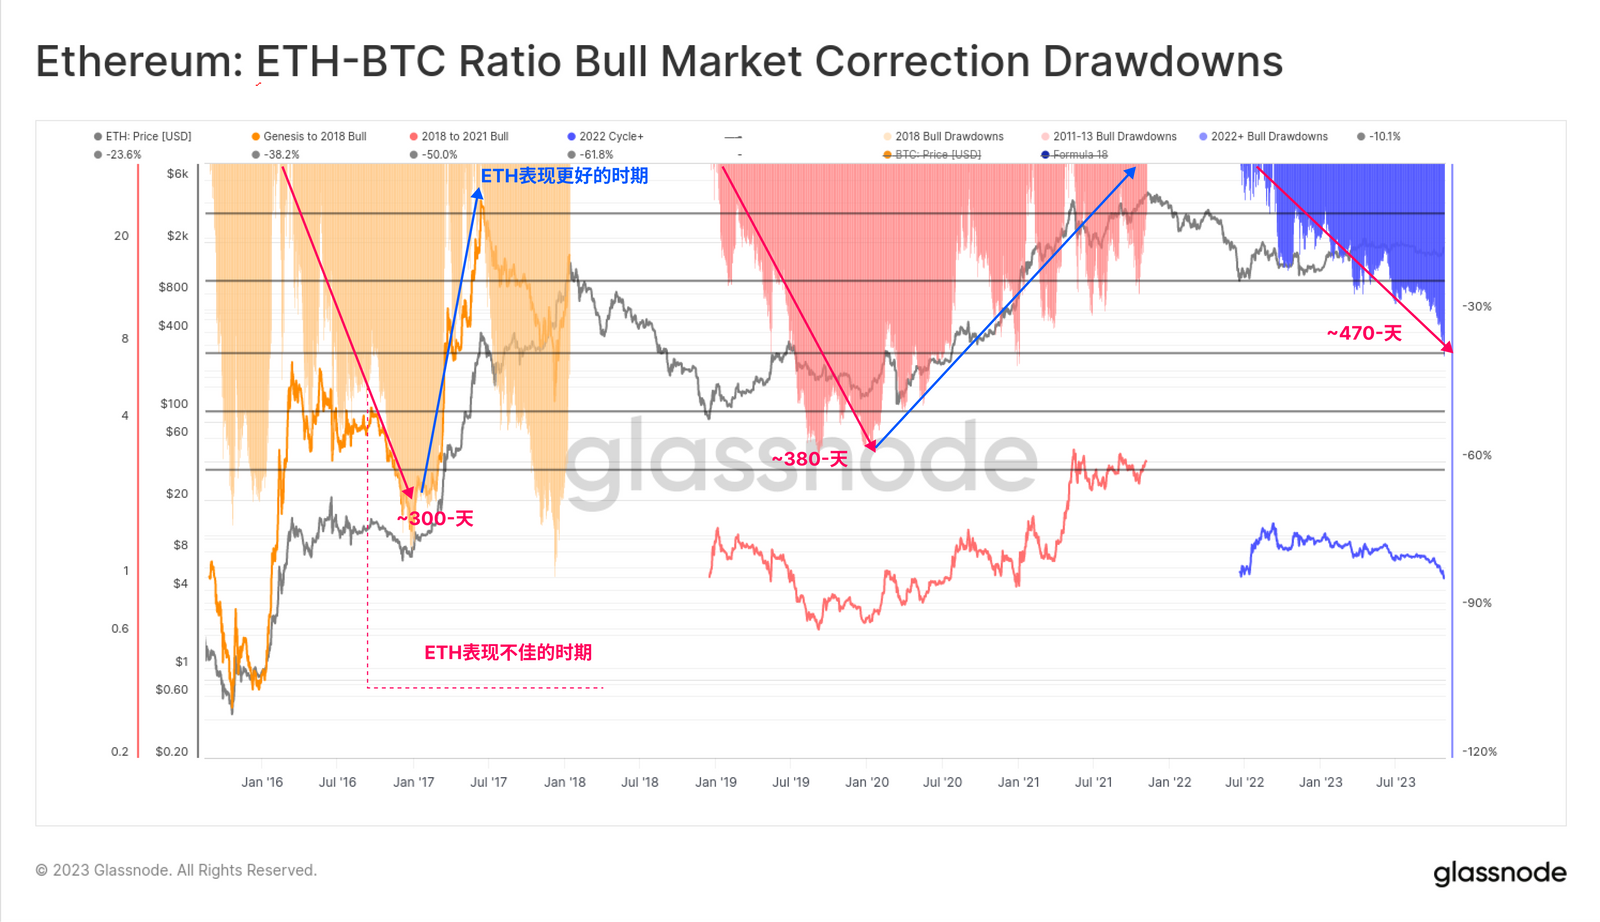
To assess capital flows within the digital asset market, a useful reference is to look for periods when ETH outperformed BTC. The chart below shows the depth of the maximum pullback of the ETH-BTC ratio compared to the local peaks of the current uptrend.
Previous cycles have seen ETH experience pullbacks exceeding -50% during the recovery phase of bear markets, while the current pullback stands at -38%. Particularly noteworthy is the duration of this trend, as ETH has depreciated relative to BTC for over 470 days. This highlights a potential trend between cycles, where BTC's dominance tends to strengthen for a longer period during the hangover phase after a bear market.
We can also use this tool to monitor turning points during periods of rising and falling risk.
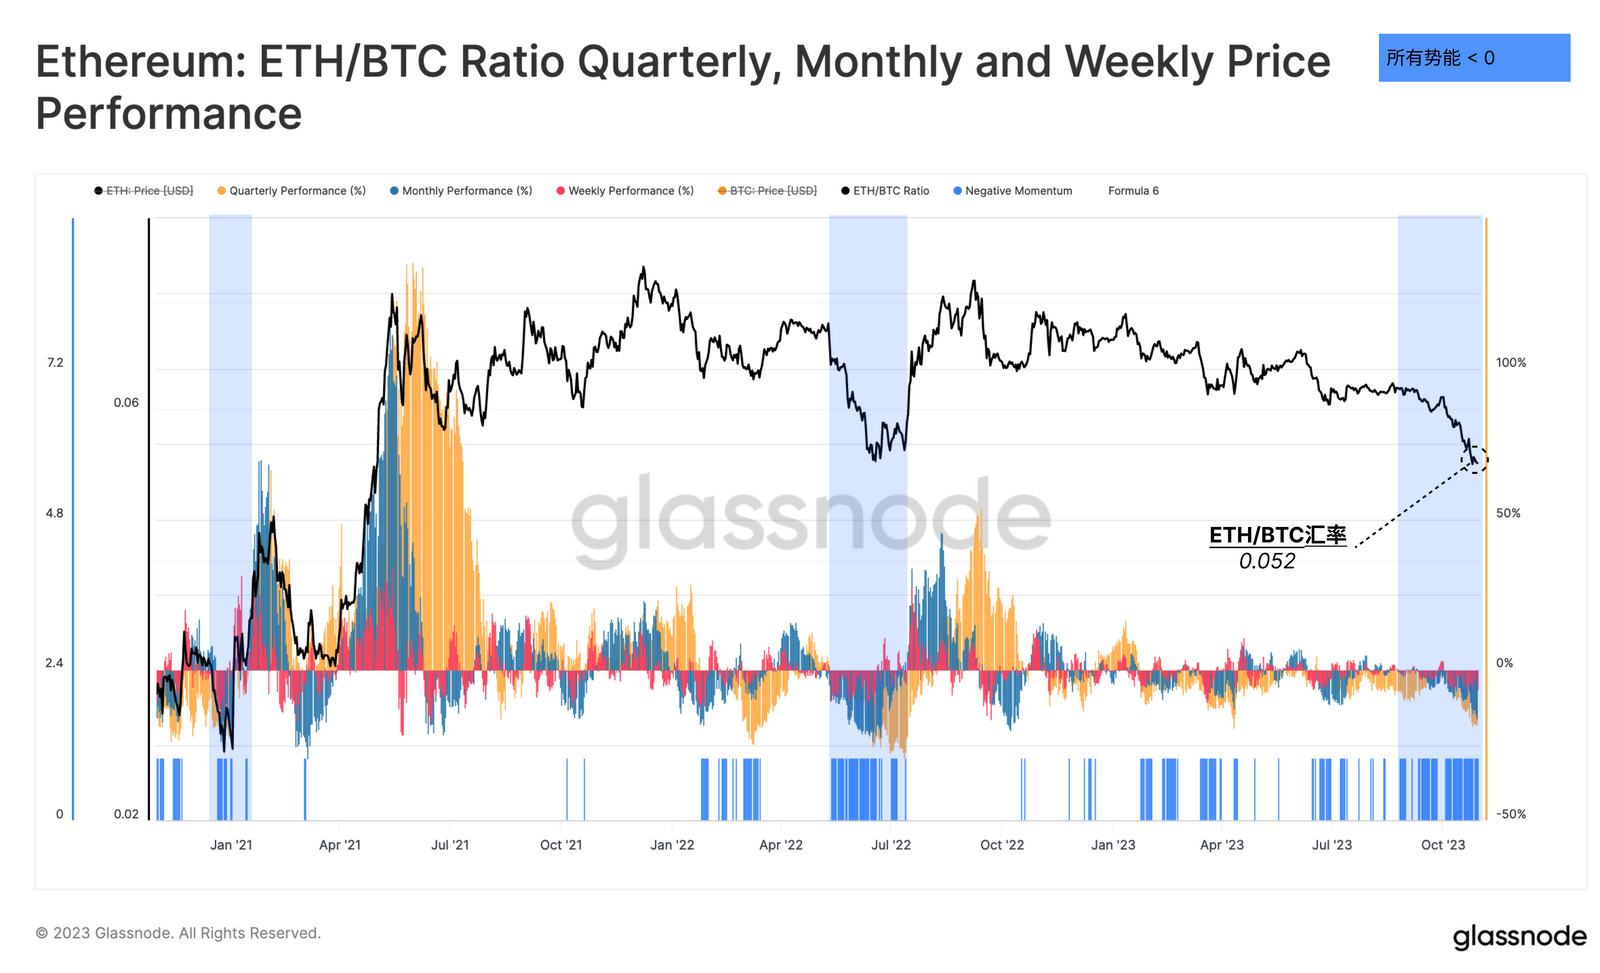
The chart presents another perspective on the relative performance of the ETH/BTC ratio, showing the oscillation indicators of quarterly, weekly, and weekly rolling investment returns for the ETH/BTC ratio. A bar code indicator (blue) highlights periods where all three time frames show ETH underperforming relative to BTC.
Here we can see that the recent weakness in the ETH/BTC ratio is similar to the situation from May to July 2022, where the price ratio reached the same level of 0.052.
Investor Sentiment Trends
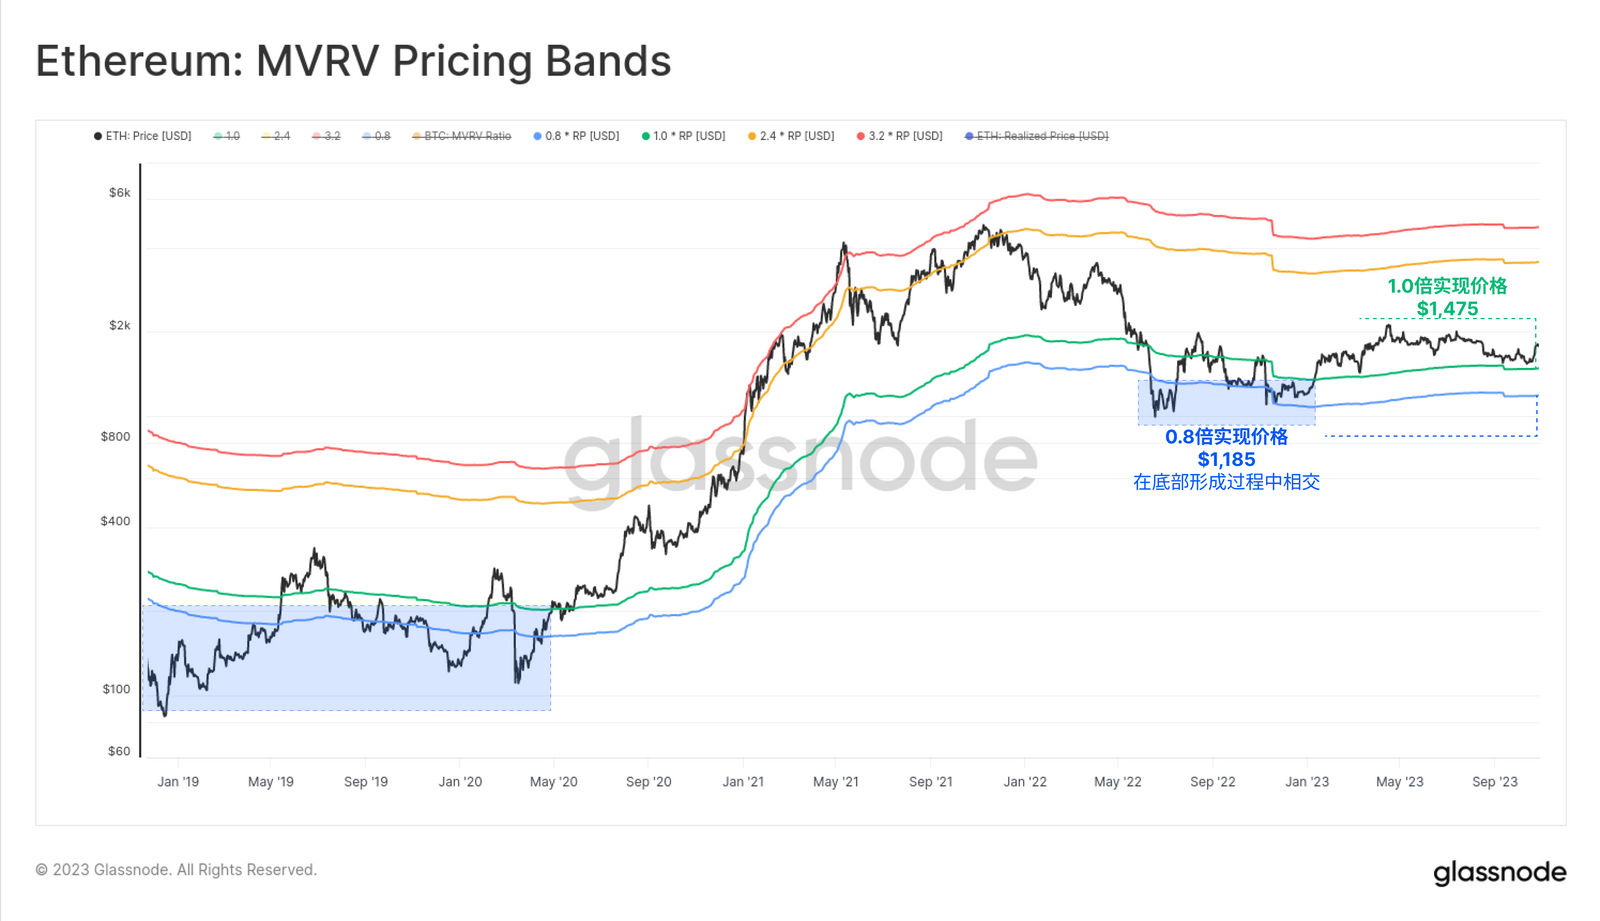
Delving into the Ethereum price model, we note that ETH's trading price is $1,800, which is 22% higher than the realized price ($1,475). The realized price is typically viewed as the average cost basis of all coins in supply, priced according to the last transaction time.
This indicates that the average holder of ETH is sitting on moderate profits, but it is still far below the extreme price levels often seen during bull market frenzies.
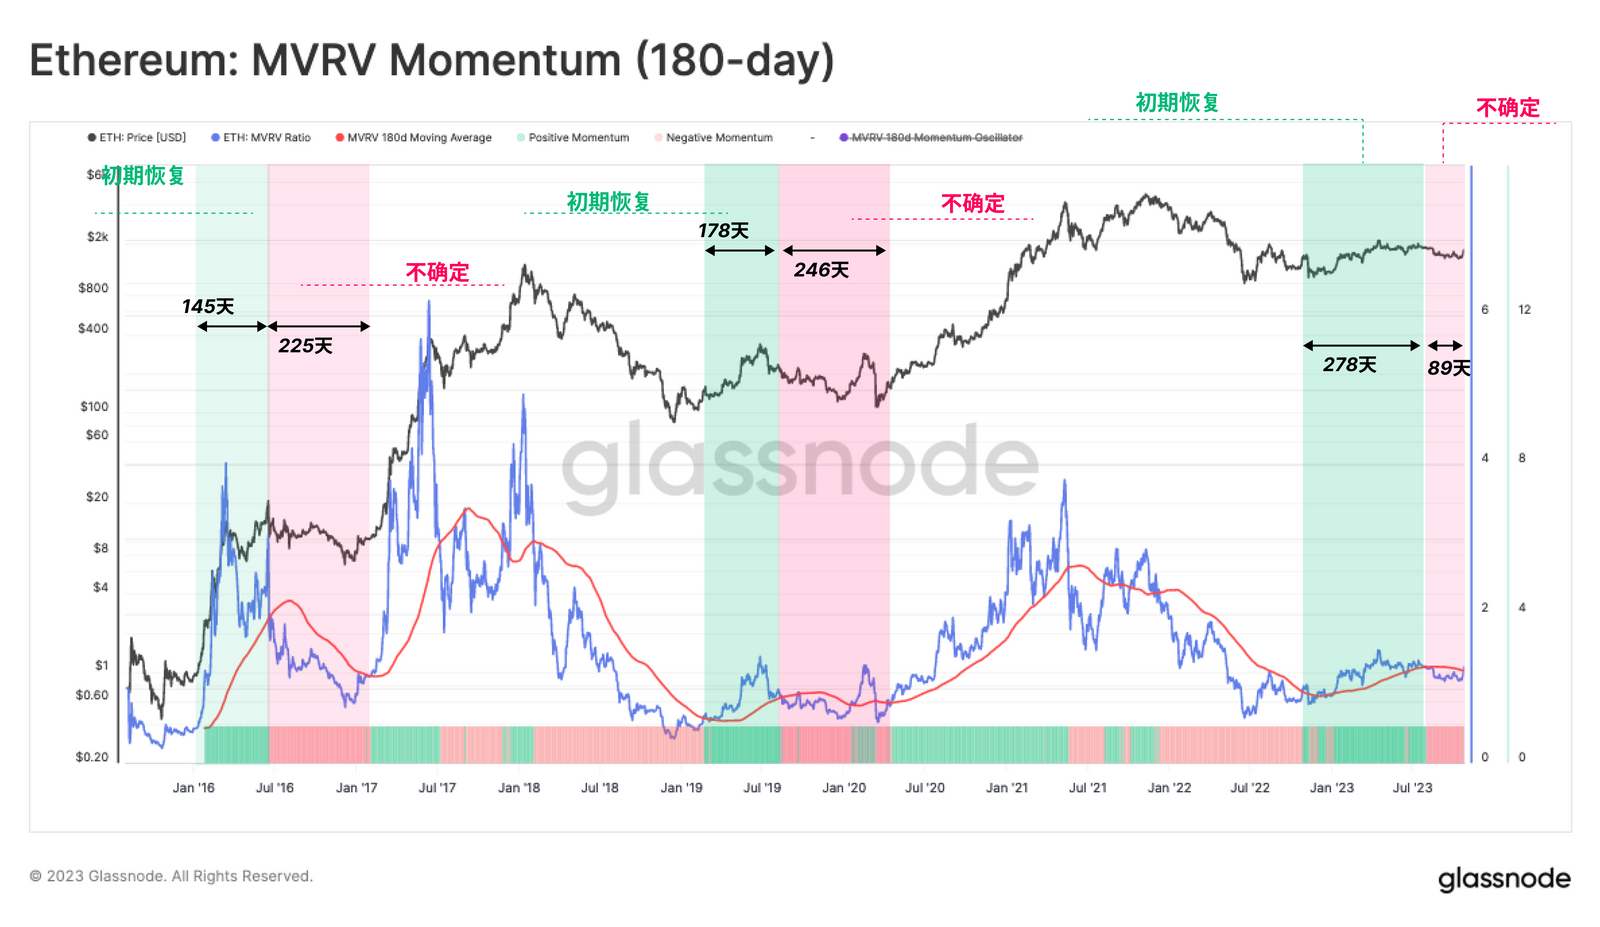
Another way to visualize changes in investor profitability is through the MVRV ratio, which is the ratio of price to realized price. In this case, we compare the MVRV ratio to its 180-day moving average as a tool for monitoring trends.
When the MVRV ratio is above this long-term average, it indicates that investor profitability is significantly increasing, which is typically a signal of a market uptrend. However, despite ETH's strong market performance earlier this year, the market remains in a negative momentum state according to this indicator. It appears that the aftershocks of the 2022 bear market are still slowly dissipating.
Changes in Confidence
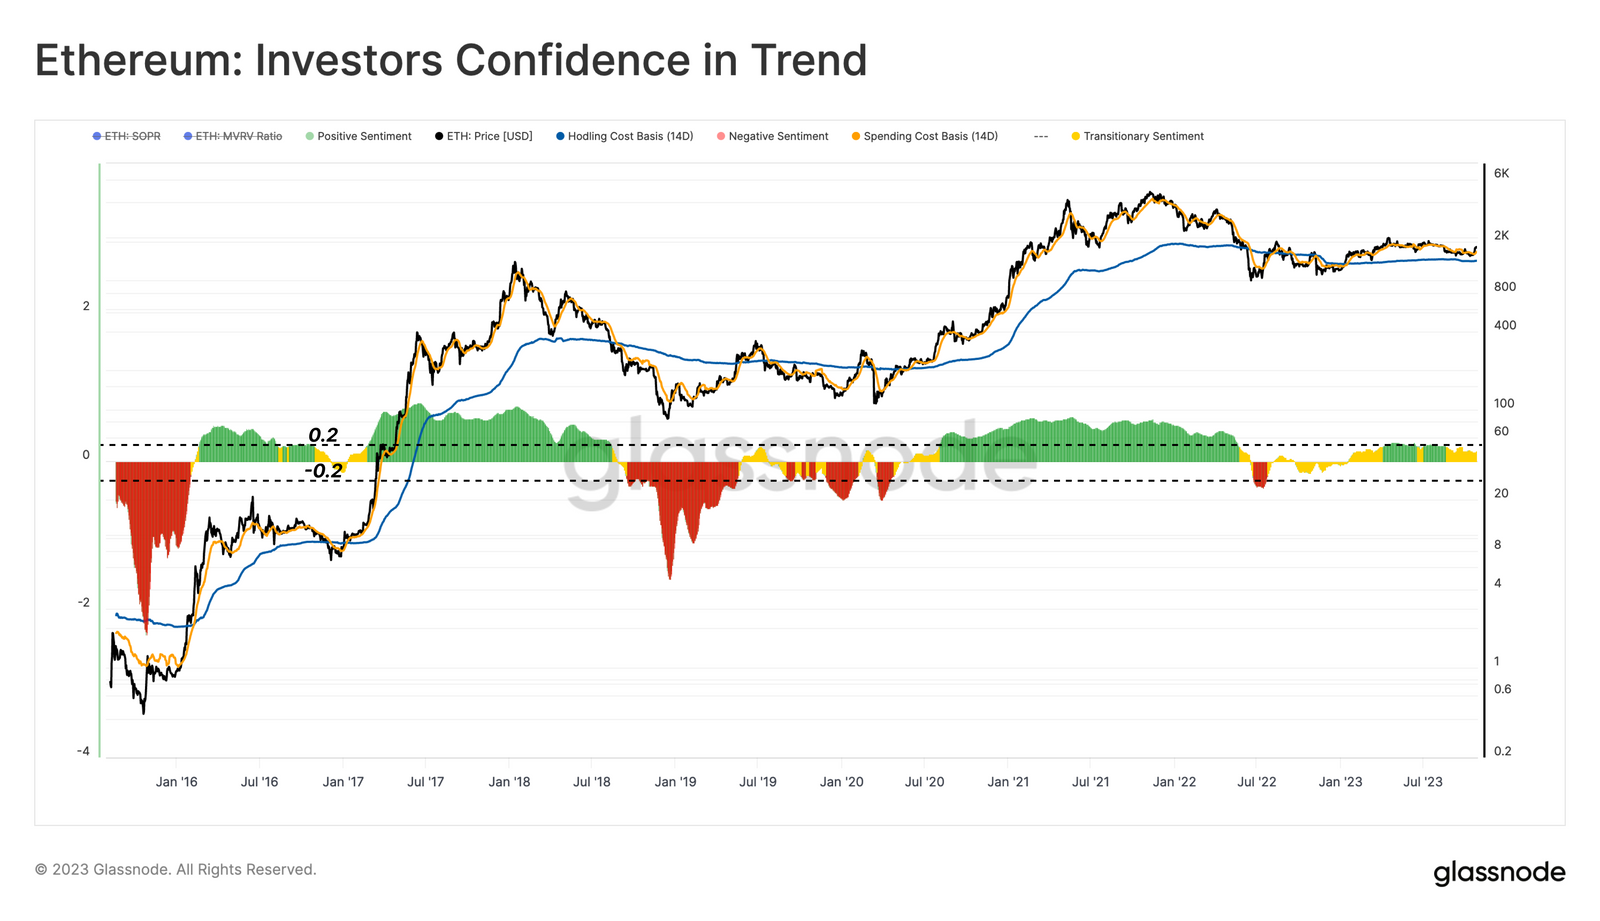
We can also utilize the "Investor Confidence in Trend" indicator to measure the relative performance of Ethereum investors' profitability. We attempt to gauge changes in Ethereum investor sentiment by comparing the differences between the cost basis of holders and sellers.
- When the sellers' cost basis is lower than that of holders, it indicates a red sentiment leaning negative;
- Conversely, if the sellers' cost basis is higher, it shows a green sentiment leaning optimistic.
- Orange transitional sentiment indicates that the cost basis fluctuations are close to the holders' cost basis.
By this measure, the market is in a transitional zone, positive but relatively small in magnitude.
Altcoin Season: Dollars…. but not BTC
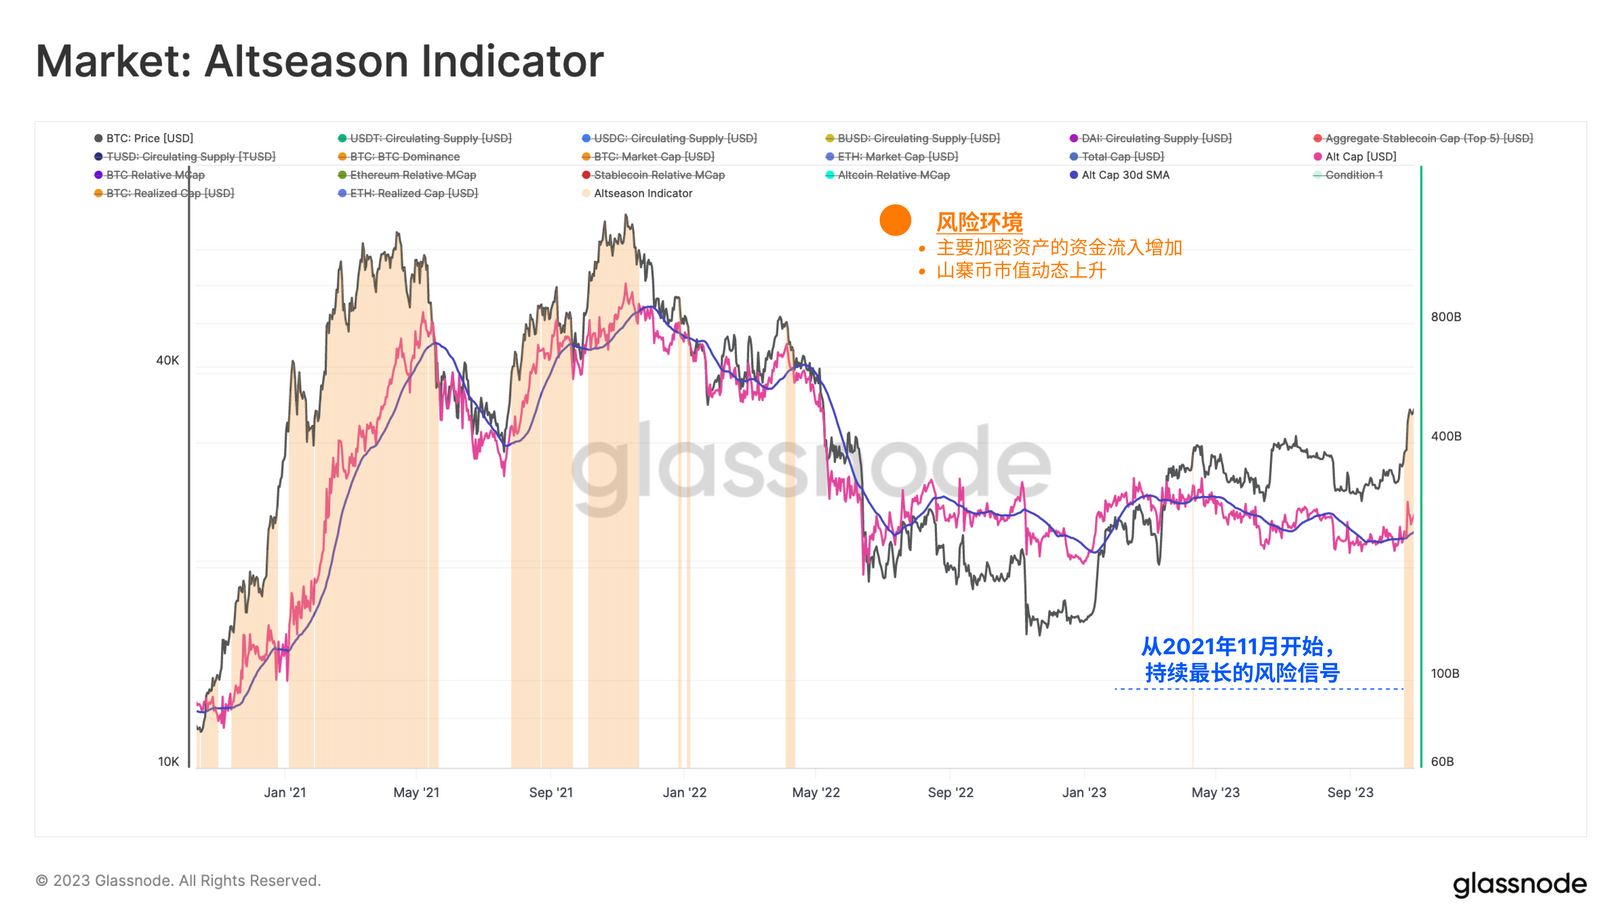
Building on previous work, we are able to iterate on the altcoin indicator. In this model, we use the previously defined risk environment as our first condition, requiring capital inflows into BTC, ETH, and stablecoins. We also added a second condition, which is positive momentum in the total market cap of altcoins (excluding the total market cap of BTC, ETH, and stablecoins).
Here, we look for periods when the total valuation of altcoins exceeds its 30D SMA. Before Bitcoin surged from $29,500 to $35,000, this indicator showed positive values on October 20.
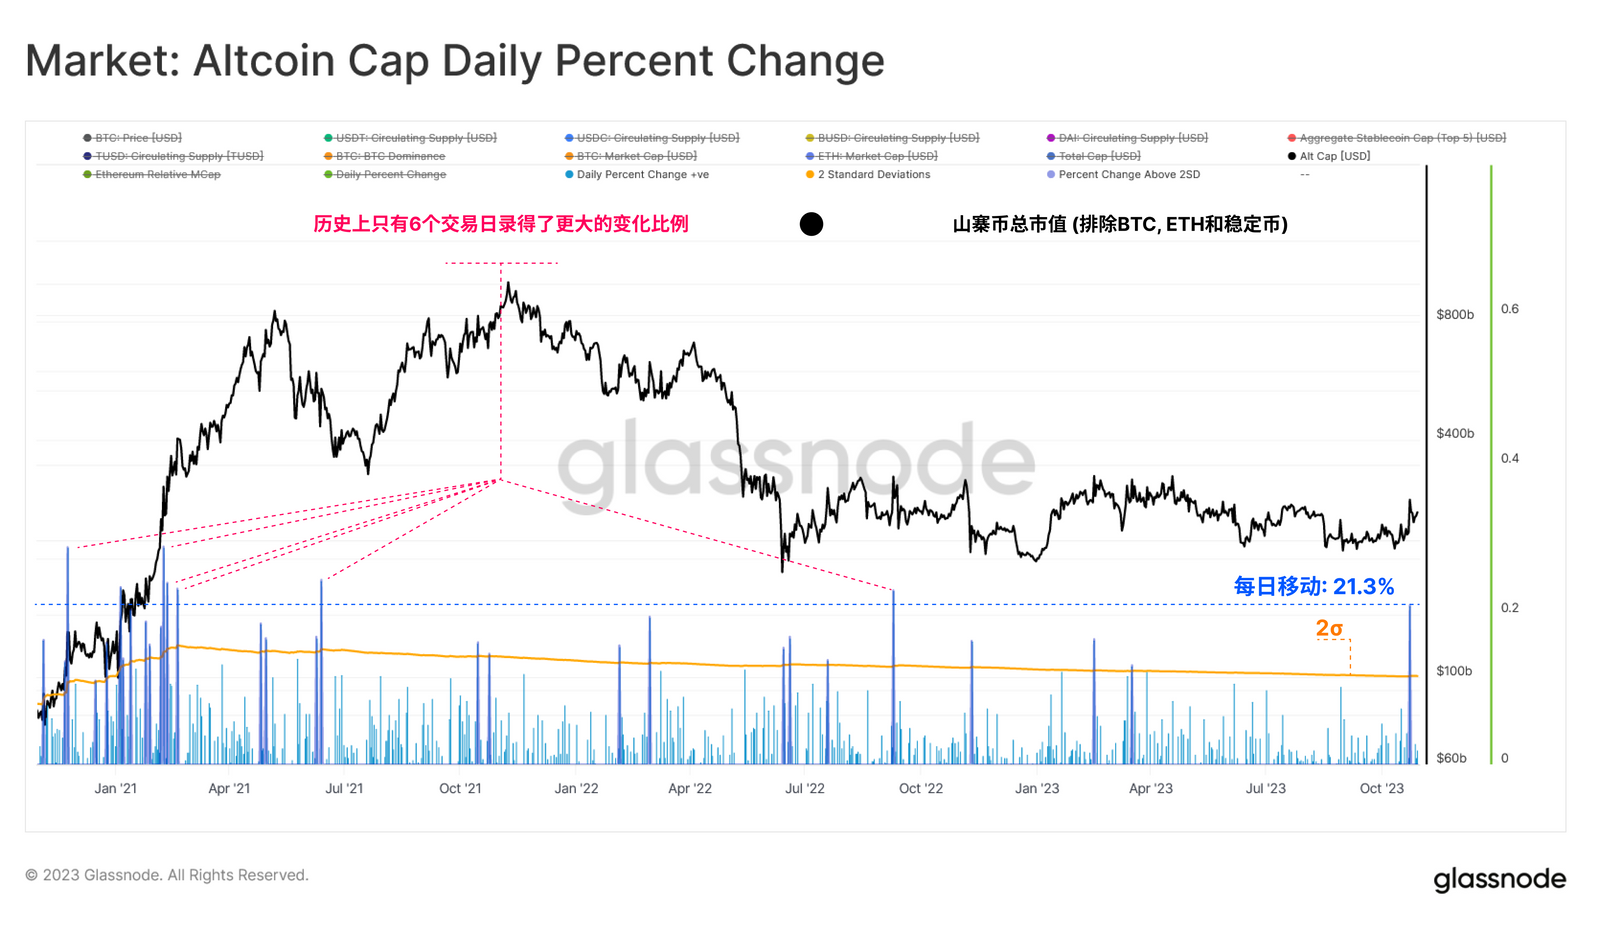
When assessing the recent performance of the total market cap of altcoins, we can clearly see a high level of confidence in digital assets.
The local uptrend recorded a +21.3% growth in industry valuation, with only six trading days showing significant percentage changes. This highlights the waterfall effect of investor capital, as Bitcoin's dominance tends to rise, prompting an increase in altcoin valuations compared to fiat currencies.
However, it is important to remember that Bitcoin's dominance is continuing to rise. From a relative perspective, BTC now holds over 53% of the digital asset market valuation, while Ethereum, large altcoins, and stablecoins have all experienced a relative decline in their dominance in 2023. Bitcoin's dominance has risen from a cyclical low of 38% set at the end of 2022.

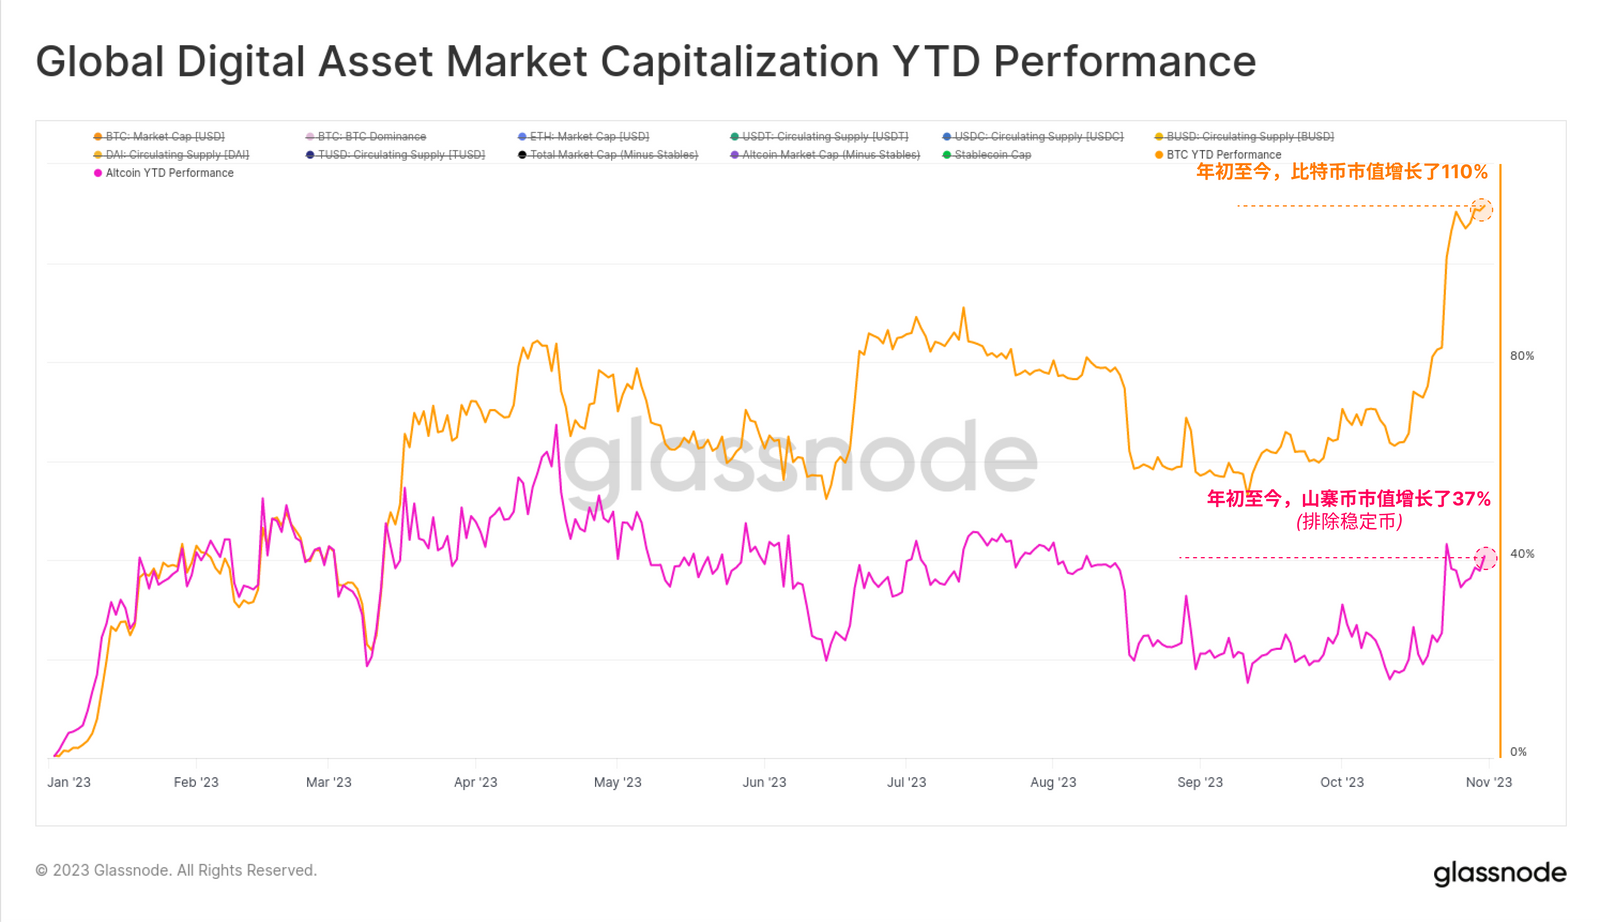
Finally, we can compare the annual growth rates of Bitcoin and the total market cap of altcoins (excluding stablecoins). Bitcoin's market cap grew by 110% in 2023, while the market cap of altcoins grew by 37%, an impressive increase but relatively small.
This highlights an interesting market dynamic, where the altcoin space outperformed traditional assets like fiat currencies and gold, but still significantly lagged behind Bitcoin.
Conclusion and Summary
The digital asset market has reported impressive returns in 2023, moving beyond the initial recovery phase and entering an uptrend once again. For market leaders BTC and ETH, the market corrections in 2023 have been noticeably shallower than the upward trends of previous cycles, indicating that investor support and positive capital inflows are occurring.
From multiple indicators, including our developed "Altcoin Indicator," we have seen a significant increase in the market valuation of the altcoin sector for the first time since the peak of the last cycle. However, it is important to note that this performance is relative to fiat currencies (i.e., the dollar). In the realm of digital assets, Bitcoin's dominance continues to rise, leading to a year-on-year growth rate of over 110% in Bitcoin's market cap.


