What is driving the crypto bull market? Is it the upgrade of technology?

 "The team's continuous development without giving up" is not the core driving factor for the price increase after the bear market.
Author: LUCIDA & FALCON
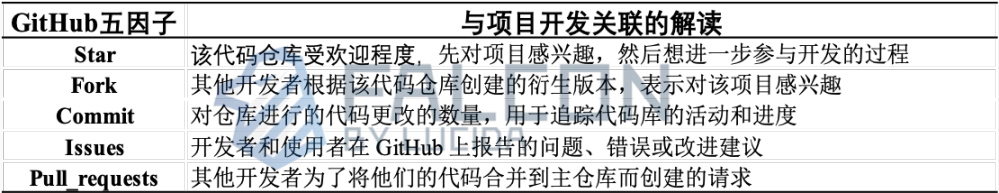
In the previous article "Does the team's work really relate to the price of the coin?", we analyzed the correlation between the overall GitHub development activity in the industry and the fluctuations in token prices, concluding that the six GitHub factors are positively correlated with price fluctuations in both bull and bear markets.
This article further expands on the conclusion of "correlation" to study the causality between the two, namely, "Is it the technological upgrades that promote the rise in coin prices, or is it the rise in coin prices that drives technological upgrades?" This aims to help investors and developers clarify the position of "technical development" as a fundamental factor in the fluctuations of coin prices.
The overall structure of the article is as follows:
First, we construct a GitHub Development Activity Index (GDAI) for individual tokens.
Second, based on this, we combine factors such as the market capitalization ranking of the industry and the regular trends in the number of GitHub projects over time to create an Industry GitHub Development Activity Index (IGDAI) that reflects the overall GitHub development activity in the industry.
Then, by comparing the changes in the industry development activity index IGDAI with the fluctuations in coin prices over the past six years, we assess the causal relationship between technology and price.
Finally, we apply the GDAI index to tokens that have been continuously developed over the past six years, comparing their development activity index values and price increases with those of BTC and ETH to validate the previous judgment on the causal relationship between technology and price.
Step 1. Constructing the GitHub Development Activity Index GDAI for Individual Projects Using the Analytic Hierarchy Process
The specific GDAI formula is as follows:

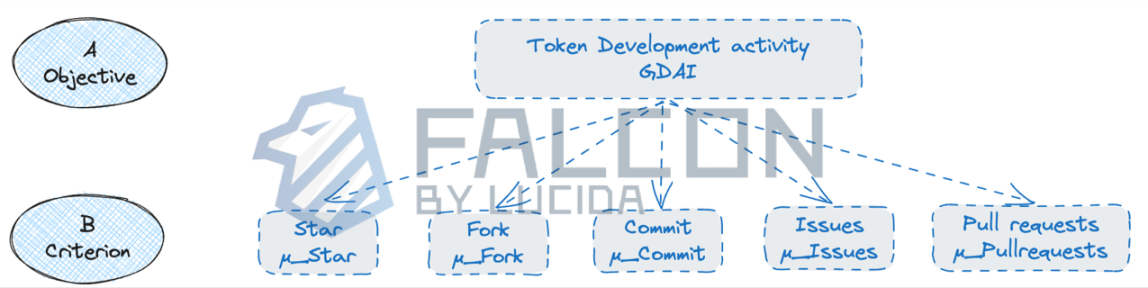
The Analytic Hierarchy Process (AHP) is a comprehensive evaluation method for system analysis and decision-making, which decomposes the elements of the required decision into an objective layer, criterion layer, and scheme layer. Based on this decomposition, qualitative and quantitative analyses are conducted again, with a simple and efficient calculation method.
(1) Analyze the relationships between various factors in the system and establish a hierarchical structure.
Decompose the objective layer GDAI into five criterion layers: μStar, μFork, μCommit, μIssues, μPullRequests.
(2) Establish the judgment matrix.
For the elements at the same level, perform pairwise comparisons regarding the importance of a certain criterion in the previous layer, constructing a pairwise comparison matrix (judgment matrix). We determined the measures of different importance levels in Table 2.
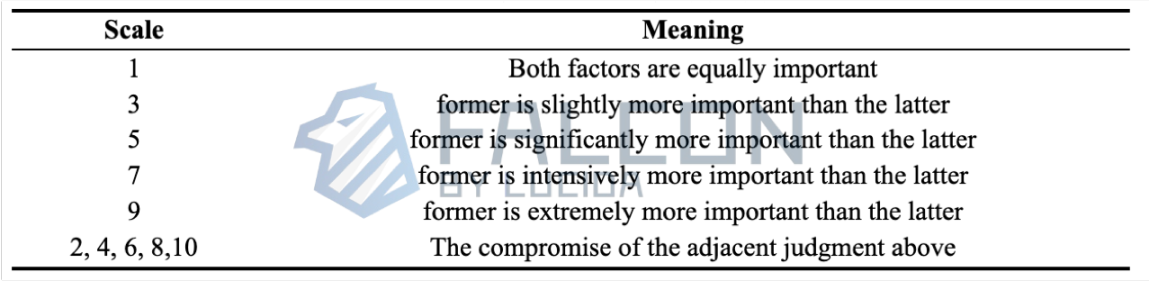
Create the following judgment matrix for criterion layer B. Based on experience and the nature of the indicators, the priority for the contribution to GitHub development activity is Commit > Pullrequests > Issues > Fork > Star. Since the Star and Fork indicators do not have a particularly direct connection to development activity, we assign them relatively low scores.

(3) Consistency Check (CI)
The characteristic equation of matrix B:


(4) Calculate weights using three methods.
Method 1: Arithmetic Mean

The derived weight vector formula is:

Method 2: Geometric Mean

Method 3: First, use the eigenvalue method to determine the maximum eigenvalue of matrix A and the corresponding eigenvector. Then normalize the eigenvector to obtain the desired weights.
The average of the weights obtained from the above three methods is the final determined weight value. The specific results are shown in Table 4:
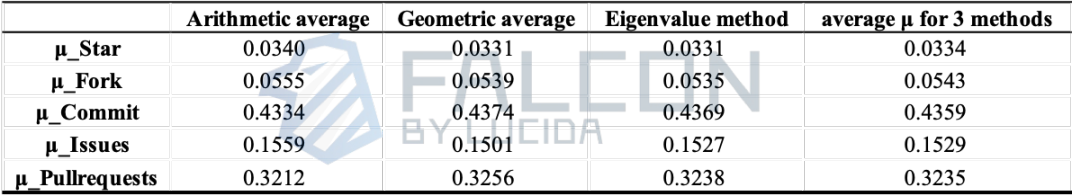
Thus, the specific GDAI index formula can be expressed as follows:
$$\(GDAIi =0.03Star i + 0.05Forki + 0.44Commiti + 0.15Issuesi + 0.32Pullrequestsi.\)$$
Step 2. Optimizing the Industry GitHub Development Activity Index IGDAI Based on GDAI
In Step 1, we constructed the GitHub development activity index GDAI for individual tokens. Now, based on GDAI, we comprehensively consider all listed and circulating tokens in the cryptocurrency industry that are open source on GitHub, summing their GDAI to obtain the Industry GitHub Development Activity Index (IGDAI). The specific IGDAI calculation formula is as follows:

Where n represents the total number of all tokens circulating in the cryptocurrency market and open source on GitHub during a certain time period.
There are generally two approaches to constructing an index that reflects the overall industry situation:
1. Select representative targets to calculate their performance. 2. Consider the overall situation of the entire industry.
For approach 1, we first consider that the current cryptocurrency industry ecosystem is not very complete, and many tokens with good price performance and market capitalization have not been open-sourced, making it debatable whether the selected targets are "representative"; secondly, the current cryptocurrency industry is still a blue ocean with vast development space, and each token may achieve rapid development in a short time; finally, the high liquidity characteristic of the cryptocurrency industry, which trades 24 hours a day, leads to significant short-term fluctuations in industry market capitalization. If we refer to the A-share market, changing selected targets within six months may result in missing a lot of information about token market capitalization changes.
Therefore, this article comprehensively considers the development information of all industry tokens to calculate IGDAI.
Step 3. "Technological Revolution" vs. "Price Increase": Which is the Cause and Which is the Effect? Price Changes Unidirectionally Affect GitHub Development Levels
We use the Granger causality test to analyze the causal relationship between the industry development activity IGDAI and BTC price changes over two time series data, with the time period from 2015 to 2023.10.31, and the index dimension being "daily." First, we determine the lag order to be 4, and through the unit root test, we confirm that both types of data are stationary series (the premise for conducting the Granger causality test is that the data is "stationary"), yielding the following results:
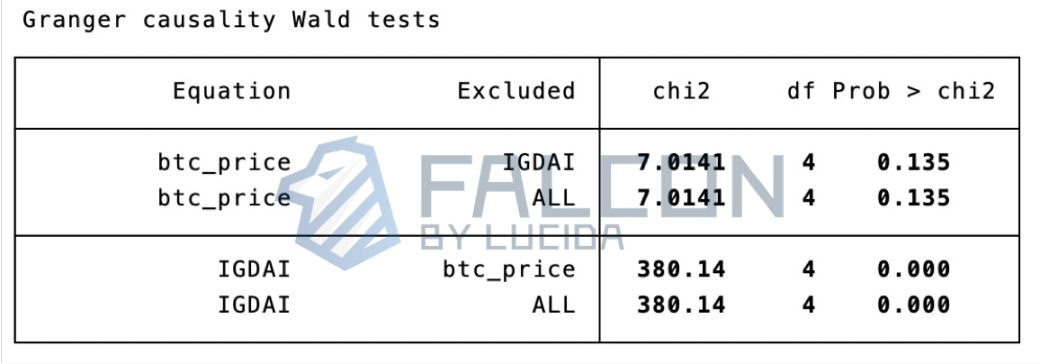
Where 0.000 < 0.05 indicates that the F test rejects the null hypothesis (null hypothesis H0: there is no Granger causality between the two), BTC_price is the cause of IGDAI, meaning that the industry GitHub development activity IGDAI is influenced by the lagged terms of price changes.
0.135 > 0.05 indicates that the F test accepts the null hypothesis, meaning IGDAI is not the cause of BTC_price. In summary, price changes unidirectionally affect the level of industry development activity.
At the same time, we analyze more intuitively using charts. Considering that the daily development activity index fluctuates significantly and has many random factors, making the view less intuitive, we perform exponential smoothing and expand the time period to "weekly." Figure 2 shows the IGDAI index and BTC price changes from 2015 to the present, with a monthly interval:
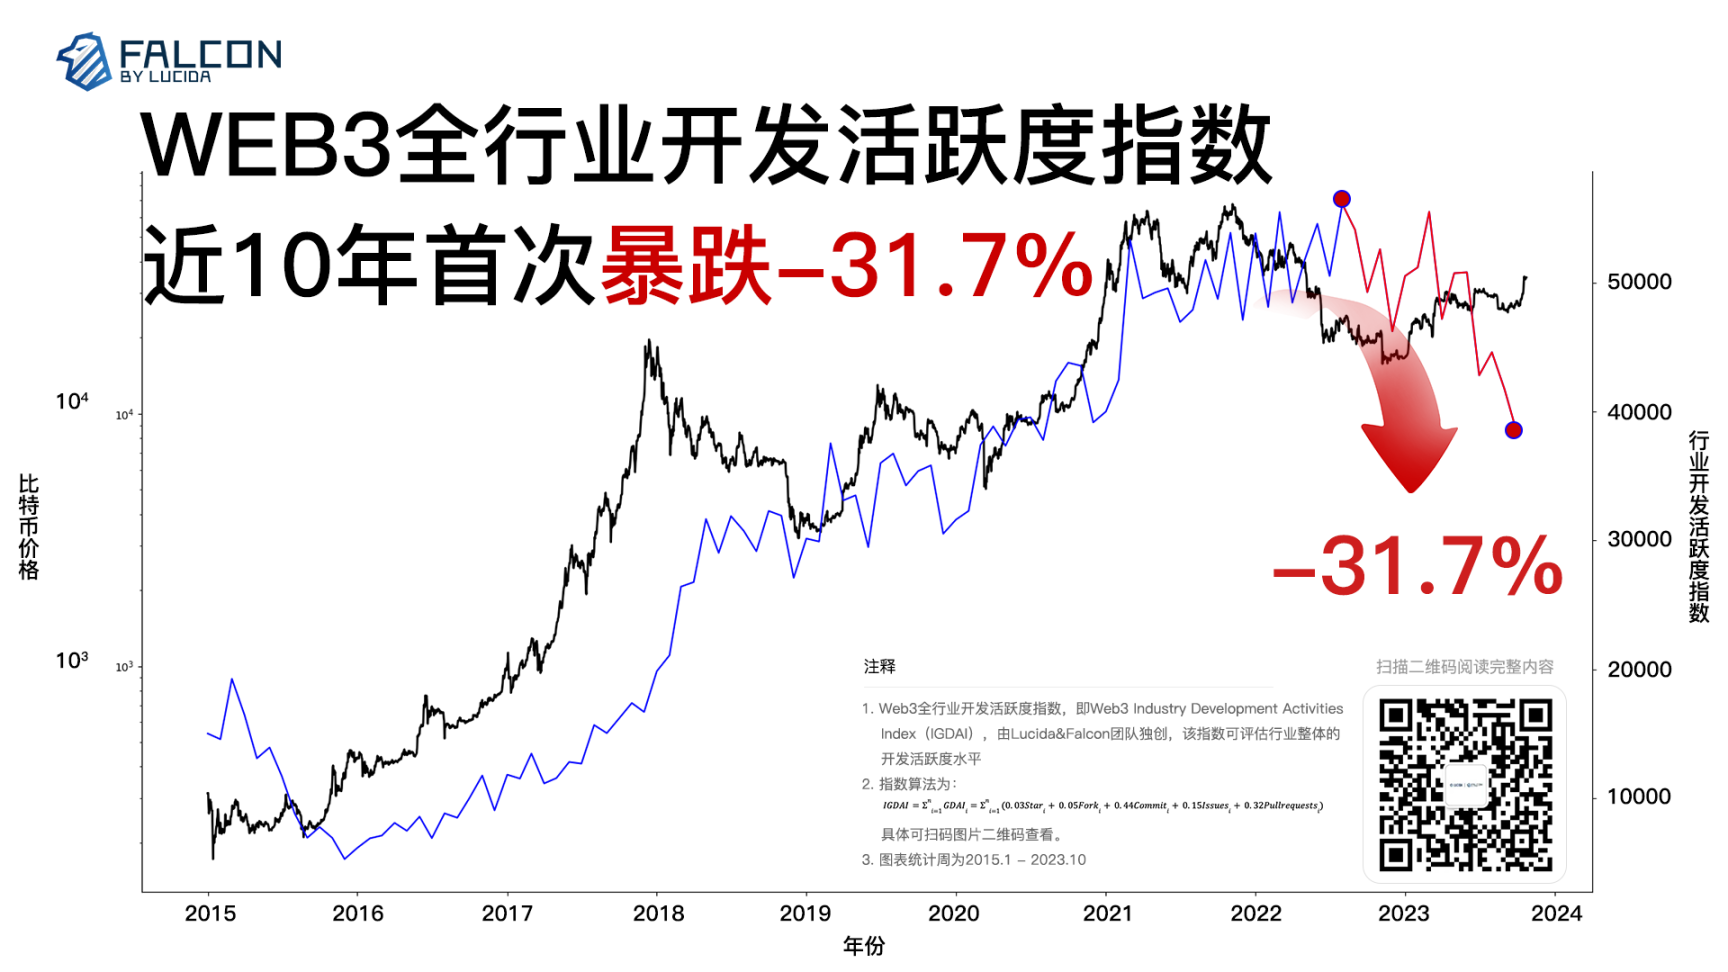
This chart clearly shows that the changes in the industry development ecosystem lag behind the changes in BTC prices during different periods, and both exhibit similar fluctuations, confirming the conclusion that IGDAI is unidirectionally influenced by price changes.
Additionally, we observe from the chart that in the past few months, the industry development activity index plummeted by 31.7%, marking the largest drop in nearly a decade!
Step 4. As Long as the Development Team Keeps Developing and Survives the Bear Market, Will the Price Not Be Too Poor? Wrong!
In Step 3, we established the conclusion that price changes unidirectionally affect technological development through the Granger causality test. However, we also want to explore whether there exists a special relationship: even if the level of GitHub development does not improve the price fluctuations, as long as the team keeps developing and survives the bear market, will the price performance not be particularly poor? Considering the maturity of the token development ecosystem and the changes in the variety of tokens, we decided to look for tokens that have been continuously developed since 2018 and compare their GitHub development activity GDAI and price fluctuations with BTC.
We define "continuous development" as the core GitHub development factors—commit, issues, and pull requests—being non-zero in each week from 2018 to October 2023. Price fluctuations are defined as (highest price - lowest price) / lowest price during this period. Through massive data scraping and analysis, we first identify approximately 1,400 tokens that are both open source and listed from 2018 to the present, finding 38 that meet the above criteria (including BTC and ETH; considering that BTC and ETH have very mature development ecosystems and market capitalizations, they are highly representative. For the sake of brevity, this article focuses on the results of the remaining 36 tokens compared to BTC). The specific list of tokens is shown in Table 6:

Regarding GitHub development activity GDAI, we analyze the situation of the 38 tokens and obtain Figure 3:
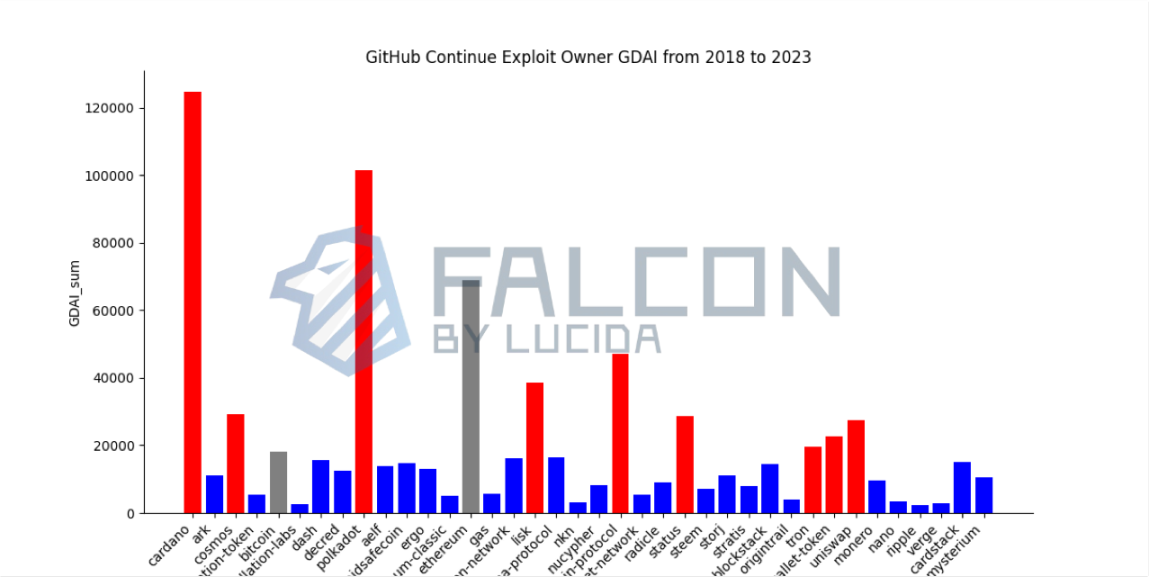
Red indicates tokens with IGDAI exceeding BTC, while blue indicates those that do not. Among the continuously developed tokens, 9 have development activity exceeding that of BTC.
Regarding price fluctuations, we obtain Figure 4:
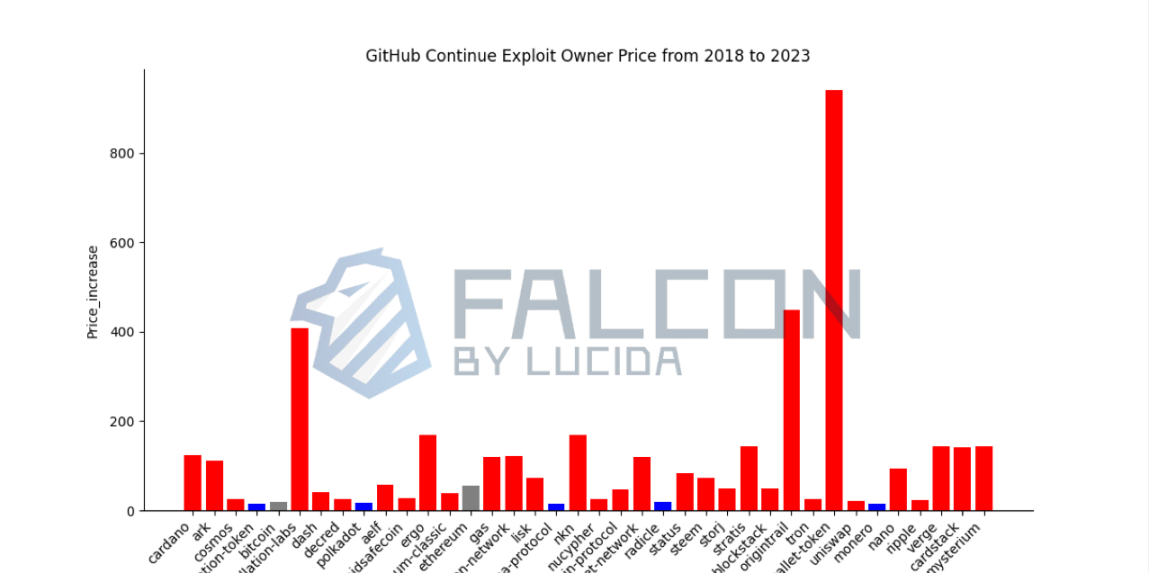
Red indicates tokens with price fluctuations exceeding BTC, while blue indicates those that do not. Among the continuously developed tokens, 31 have price increases exceeding that of BTC.
Summarizing the situations from the two figures, there are 8 tokens that overlap in red, meaning that from 2018 to the present, 8 tokens have both GitHub development activity GDAI and price fluctuations performing better than BTC (the industry benchmark), accounting for 22% of all continuously developed tokens in that period. The specific tokens are listed in Table 7:

From the perspective of continuous development, a 22% overlap rate is relatively low, so we can only conclude that continuous development has a certain degree of influence on price, but we cannot definitively state that continuous development has a very positive driving effect on price. This view also corroborates the results of the Granger causality test in Step 3.
Article Conclusion
Based on the above content, Falcon summarizes the conclusions of this article:
- Using the Analytic Hierarchy Process, this article established a development activity index GDAI for individual tokens and an industry-wide GitHub development activity index IGDAI.
- By analyzing the "Industry GitHub Development Activity Index IGDAI" and "BTC Price Data" from 2015 to 2023.10, we found that price changes only unidirectionally affect GitHub development activity. Moreover, in the past few months, the industry development activity index plummeted by 31.7%, marking the largest drop in nearly a decade.
- "The team continues to develop and does not slack off" is not the core driving factor for price increases after a bear market. Other factors affecting prices must also be considered when investing.