
Pionex Market Weekly: The Surge Has Finally Arrived, What’s Next?

 It is now hard for us to ignore the growing unease in the market.
Author: Pionex

Macroeconomic Analysis
The U.S. core personal consumption expenditures (PCE) annual rate for September, released on Friday, was 3.7%, in line with market expectations. The core PCE, as the Federal Reserve's preferred inflation index, reveals some important details:
- The U.S. core PCE price index rose by 0.3% month-on-month, significantly exceeding August's 0.1%, marking the largest increase in four months.
- Personal consumption expenditures (PCE) in September grew by 0.7% month-on-month, surpassing the expected 0.5%, with a previous value of 0.4%.
- The month-on-month increase in personal income in September fell from 0.4% to 0.3%, below expectations, and lower than the 0.4% CPI increase in September.
Key findings from the report include:
- Inflation remains present and is rebounding.
- While consumer spending is very strong, income is shrinking.
U.S. Economic Data Continues to Shine
The U.S. economy expanded faster than expected in the third quarter, achieving its fastest growth rate in nearly two years, which is the latest sign of resilience in the face of high interest rates.
According to preliminary data, despite rising interest rates, inflation pressures, and various other domestic and global adverse factors, the U.S. GDP growth rate for the third quarter still exceeded expectations, reaching 4.9%, far surpassing economists' predictions of 4.3%. This is an increase from 2.1% in the second quarter and the strongest figure since Q4 2021.
 U.S. third-quarter GDP growth rate far exceeds expectations
The Federal Reserve has raised interest rates at the fastest pace since the early 1980s and has indicated it will maintain high rates until inflation returns to acceptable levels, yet GDP continues to grow. Although inflation rates have declined in recent months, price increases have consistently far exceeded the central bank's 2% annual target.
We believe that neither PCE nor GDP will change the outlook for monetary policy, but the real issue behind both data points is that, against a backdrop of stagnant or even shrinking income, consumer trends may not continue in the coming quarters, and high interest rates will have a substantial impact on the U.S. economy. We will continue to monitor this situation.
Fundamental Analysis
Price Surge, What Lies Ahead?
1. Bitcoin Supply on Exchanges
The supply of Bitcoin on cryptocurrency exchanges relates to users' willingness to hold cryptocurrencies. When the exchange supply rises rapidly, it indicates that Bitcoin holders are depositing their cryptocurrencies into exchange wallets for selling and cashing out; conversely, when the exchange supply decreases, it suggests that the overall trend is to transfer cryptocurrency assets to wallets outside exchanges, indicating an increased willingness to hold long-term, which supports the price.

According to Glassnode data, since May, the balance of Bitcoin supply on exchanges has shown a one-sided downward trend, indicating an increased willingness to hold Bitcoin long-term, with the proportion of Bitcoin available for sale decreasing, corresponding to a reduction in market selling pressure. This suggests that investors believe Bitcoin's price will rise in the future and are gradually starting to accumulate their spot holdings, which is a positive bullish signal. However, recent data still shows a slight uptick, indicating some potential short-term selling pressure has accumulated.
At the same time, due to reduced market supply, only a slight increase in demand is needed to drive prices up quickly. In this context, we still believe that futures leveraged trading should be approached with caution, especially with high multiples of short positions.
2. Stablecoin Supply on Exchanges
When the supply of stablecoins on exchanges increases, it indicates that many investors are still in a wait-and-see mode and have not truly entered the cryptocurrency market, suggesting a bearish sentiment where investors sell their tokens for stablecoins; conversely, when stablecoin supply decreases, it indicates that many investors are selling stablecoins for Bitcoin, Ethereum, and other tokens, which is a bullish signal for the market.


The total market capitalization of stablecoins is approximately $122 billion, with USDT and USDC accounting for nearly 87%. From the latest data on stablecoin supply on exchanges, both USDT and USDC have shown a significant downward trend recently, indicating a clear bullish sentiment in the market.
Exchange data shows that market sentiment remains high, and against the backdrop of stable total market capitalization for stablecoins, more people are choosing to buy and hold Bitcoin, leading to a marginal decrease in stablecoin supply and a marginal increase in Bitcoin supply. Whether this situation can continue will require time to verify, and we will continue to update data to provide the latest interpretations.
Technical Analysis
Bitcoin
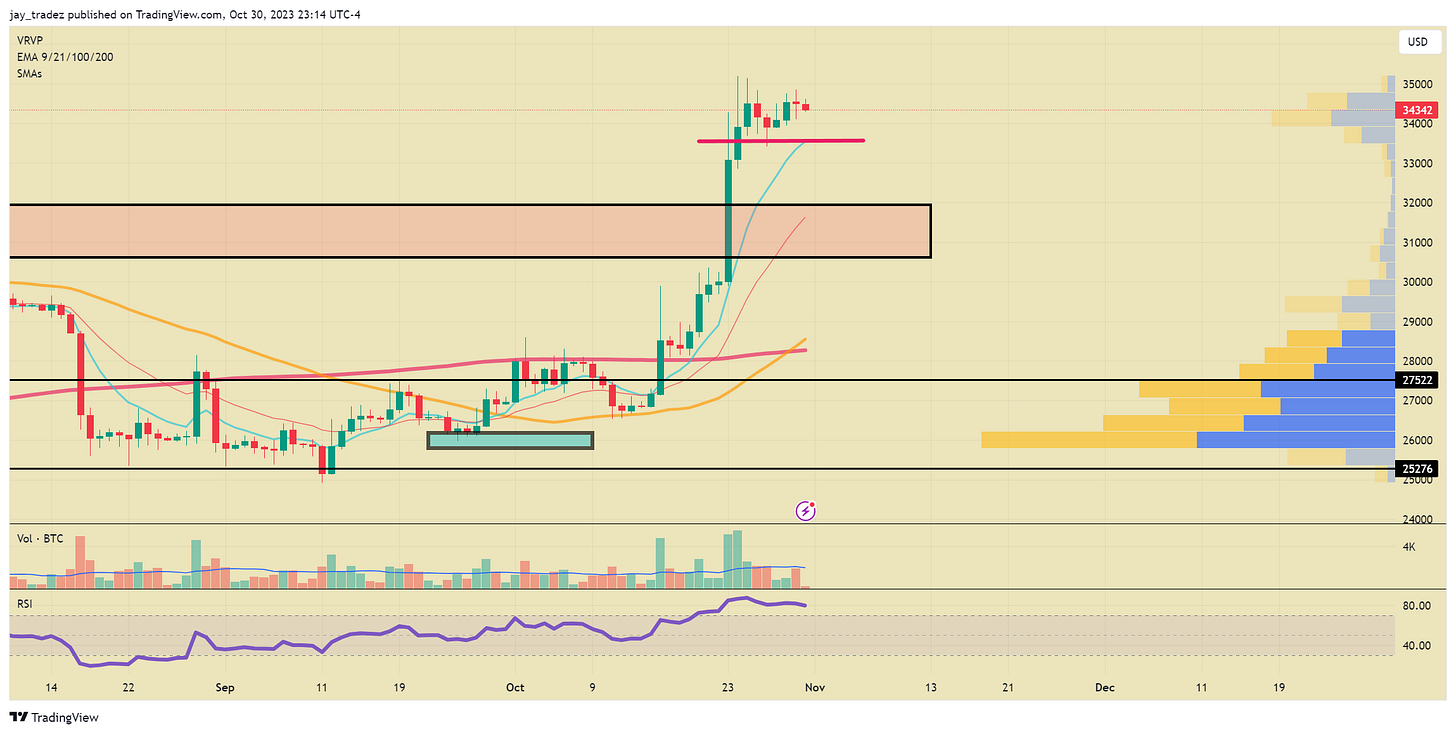
Last week, we noted that Bitcoin had returned to a bullish market structure. On Monday, Bitcoin broke through all resistance levels, officially bringing us back into the bullish zone. The magnitude of this breakout indicates a large capital reserve waiting to enter the market, as well as the fear of missing out (FOMO) among investors. Some say that this price movement may have been influenced by the news that Blackrock's Bitcoin ETF stock code IBTC was added to the DTCC website, indicating that the ETF has taken another step in the SEC approval process. However, reports suggest that IBTC was actually added to the DTCC back in August, but the discussion on Twitter only heated up before the price surge.

Blackrock stated that the stock codes listed on the DTCC do not guarantee ETF approval. Like Blackrock's other ETF applications, this is merely a preliminary step. However, after the clarification, the re-entry of marginal funds has not stopped, further supporting our view that this rise is driven by FOMO traders.
The weekly candle just closed, and the expansion of the candlestick (low → high) has increased with rising volume. This is a clear bullish signal. Additionally, both the 50-day and 200-day moving averages are trending upward, indicating an overall upward trend. The RSI has just reached an overbought state, which, in the long-term framework, may actually represent a strong trend brewing (similar to October 2020).

Currently, we maintain a bullish outlook, believing that the likelihood of Bitcoin dropping below $30,000 is low. From the daily candlestick data, it appears to be in a bullish consolidation state, and we hope to see BTC break through $33,500 and establish support. In this scenario, going long would provide a good risk-reward ratio. Another option is to wait for a daily breakout and close above $35,000. If such a scenario occurs, we will be able to test the next resistance level at $40,000. However, like all breakouts, there is a possibility of a false breakout, which could lead to a prolonged downturn.
Overall, we do not want to see the price drop below $32,000, as that is a long-term resistance area and also the previous high we just broke through in 2023. A price below $32,000 would disrupt the price structure. However, if we want to give it some leeway, $30,000 may be the last support level to watch, as that is the short-term resistance level we broke through. Although we believe this possibility is very low, if the price were to drop below $30,000 at some point, we would retest $25,000 and possibly break below it. All FOMO buyers would incur losses, and the entire narrative would be shattered.
SPX/NDX
It is becoming increasingly difficult to ignore the growing unease in the market. Last Friday, the S&P 500 officially entered correction territory, having fallen more than 10% from its peak in 2023. The Nasdaq performed even worse, dropping over 12%, and the Dow Jones experienced its most challenging week since the banking crisis in March.
Recent surveys from the University of Michigan show a significant decline in consumer sentiment and consumer expectations, considering that consumer spending is the main driver of real GDP growth.
The chart below shows the relationship between Nasdaq price movements and the percentage of Nasdaq-listed stocks above their 200-day simple moving average (SMA). It reveals a continuous decline in positioning for small and mid-cap stocks since the first quarter of this year.
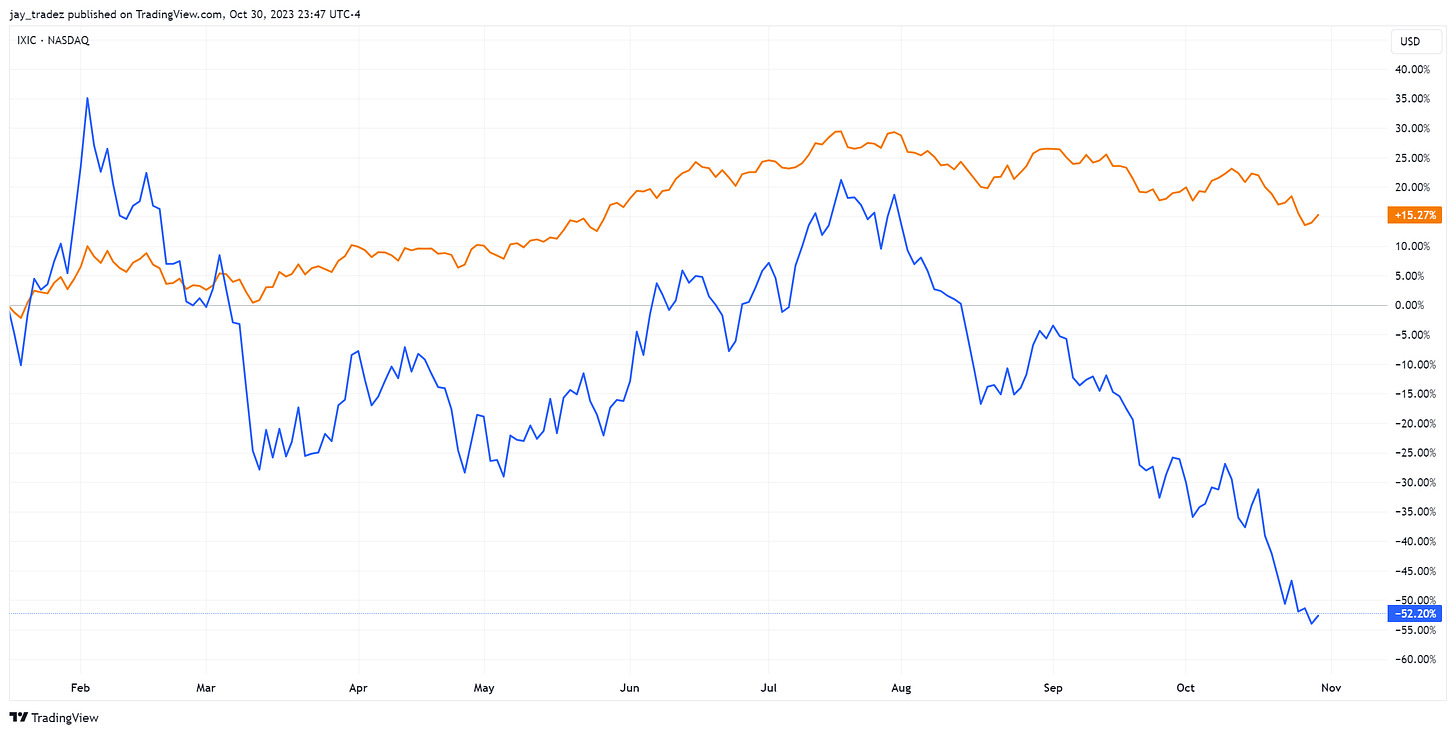 Blue Line: Percentage of Nasdaq below its 200-day moving average (200MA) Orange Line: Nasdaq Composite Index
Most of the capital in the index is concentrated in what we call the "Seven Giants" (including Meta, Amazon, Google, Nvidia, Netflix, Microsoft, and Tesla). However, as companies like Google and Tesla release disappointing earnings reports, the entire index has been negatively impacted. When we compare the Nasdaq 100 to its equal-weight counterpart, we observe that the equal-weight index has not performed better than its conventional version. This indicates that the decline of the Seven Giants is negatively affecting the sentiment of the entire index.
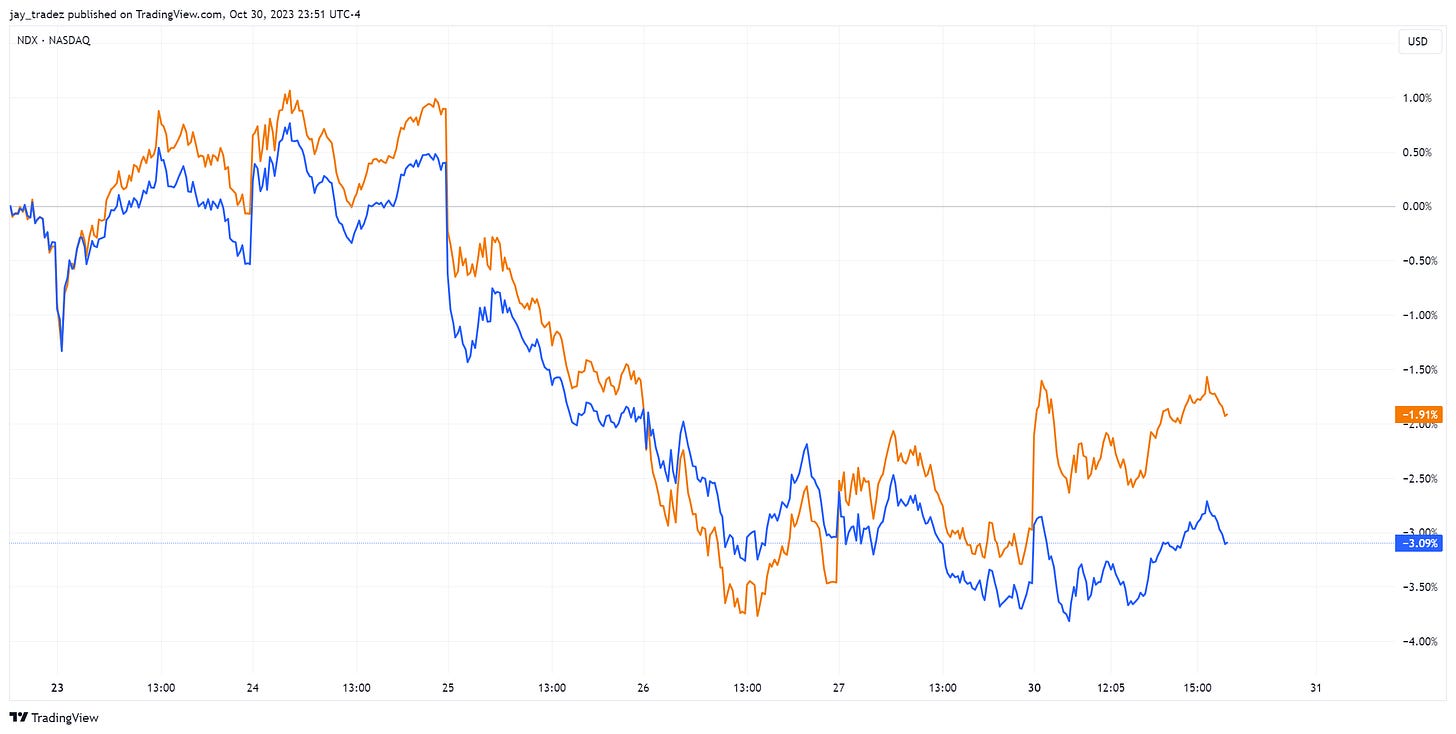 Blue: Equal-weight, Orange: NDX
Trading Recommendations
Bitcoin
Futures | Spot
In the technical analysis section, we introduced a short-term trading strategy that offers a good risk-reward ratio and a high probability of profit. When the price breaks above $33,500 and closes higher in the short term (5 minutes - 1 hour), please go long. At this point, your risk is $33,250 or the lowest point of a false breakdown. The first target is $35,000, providing you with a 4.5:1 risk-to-reward ratio. However, if you believe the price will continue to rise, you can wait for a breakout above $35,000 before taking action.

Structured Products
In last week's report, we recommended buying a bottom-fishing product at $28,000, and due to the price increase, we have already earned interest. For those who are more aggressive and seeking high returns, we recommend buying a bottom-fishing product at $32,000, expiring in 5-10 days. $32,000 is the previous high for Bitcoin, and we believe it will be the first strong support level for BTC this year.
For more conservative investors seeking U-based returns, I recommend considering purchasing a bottom-fishing product with an expiration date of November 2, 2023, and a buy price of $32,000. Given the important Federal Reserve meeting on November 2, choosing this expiration date means your investment will have lower risk during this period and can achieve stable returns. After earning interest, you can adjust your strategy again after the Federal Reserve meeting, buying more bottom-fishing products based on market reactions. Such significant meetings often trigger market volatility, providing you with opportunities for higher investment returns.


