60 sets of data pivoting the global Bitcoin mining pattern changes, market scale, and energy consumption statistics

 This article will delve into the fascinating world of Bitcoin mining, elucidating its significance and the key information you need to know.
Original Title: 60+ Bitcoin Mining and Energy Consumption Statistics For 2023 You Need to Know
Original Author: Techopedia
Compiled by: WEEX Exchange
In the fast-paced world of digital currency, Bitcoin has become a phenomenal presence, attracting the attention of investors worldwide. At the core of this revolutionary cryptocurrency is a process called "mining," which powers Bitcoin's operation and has a significant impact on the entire blockchain ecosystem. This article will delve into Bitcoin mining and energy consumption statistics, as well as why "mining" is crucial for the development of both Bitcoin and the environment.
Whether you are an experienced investor or a newcomer to the cryptocurrency space, understanding the ins and outs of Bitcoin mining is essential to grasping the true potential of this digital asset. So, let’s explore the fascinating world of Bitcoin mining, clarify its importance, and highlight the key information you need to know.
Bitcoin Mining Statistics Highlights
- In May 2023, the global annual electricity consumption for Bitcoin mining was approximately 95.58 terawatt-hours (TWh).
- It is estimated that Bitcoin consumes 60%-77% of the global electricity used by crypto assets.
- Bitcoin mining has a total market value of $8.11 billion.
- Bitcoin miners earn approximately $27.7 million in revenue daily.
- The United States has the largest Bitcoin mining industry in the world, accounting for over 38% of the Bitcoin network's hash rate.
Bitcoin Mining Energy Consumption Statistics
The energy consumption of Bitcoin mining has become a widely discussed and scrutinized topic. As Bitcoin has gained popularity and its value has soared, the energy required to mine new coins and maintain the blockchain has also increased.
According to The New York Times, in the early days of Bitcoin, when its followers were limited, a desktop computer could effortlessly mine cryptocurrency in a matter of seconds. Today, mining a single Bitcoin requires about "9 years of typical household electricity." In May 2023, Bitcoin mining is expected to consume approximately 95.58 TWh of electricity; its total electricity consumption for 2022 reached 204.5 TWh, exceeding the total electricity consumption of Finland.
Figure 1: Estimated Electricity Consumption for Bitcoin Mining, Minimum Consumption (TWh/year)
According to a report from the White House, the total energy consumed by Bitcoin mining in the U.S. reached 50 billion kilowatt-hours (kWh) in 2022, highlighting the scale of energy usage. The electricity consumed by Bitcoin mining exceeds the total energy consumption of all computers operating in the United States. Of course, Bitcoin mining itself is also included in the national electricity consumption data.
Figure 2: Comparison of U.S. Household Electricity Consumption and Cryptocurrency Mining Electricity Consumption
The above figure shows that the electricity consumption of different household scenarios in the U.S. ranks from high to low as follows: cooling, lighting, television, Crypto, computers, fans and pumps, freezers, washing machines, dishwashers (as of August 2022, Bitcoin is expected to account for 60%-77% of all Crypto electricity consumption, WEEX note).
A single Bitcoin transaction requires 1,449 kWh of electricity to be recorded (mined), which is roughly equivalent to the electricity consumption of an average American household over 50 days. In monetary terms, the average cost of 1 kWh in the U.S. is 12 cents, meaning that recording a single Bitcoin transaction consumes about $173 in electricity.
The energy consumed by Bitcoin mining accounts for approximately 0.5% of the world's total energy consumption, which is more than seven times the total electricity consumption of Google's global operations. When comparing the energy consumption of the Bitcoin network with that of various countries, it ranks 34th in the world (just behind the Netherlands and ahead of Kazakhstan, editor's note).
Figure 3: Energy Consumption Rankings by Country
The energy consumption of a single Bitcoin transaction is equivalent to nearly 100,000 Visa card transactions. In May 2023, the electricity consumption per Bitcoin transaction reached 703.25 kWh, while the electricity consumption for a Visa card transaction was only 148.63 kWh.
Figure 4: Bitcoin Transaction vs. Visa Card Transaction Energy Consumption
1) How is Bitcoin Mining Energy Consumption Calculated?
Determining the exact energy consumption of Bitcoin mining is challenging due to numerous influencing factors, including:
- The decentralized nature of Bitcoin mining
- Lack of standardized reporting requirements
- Dynamic and constantly changing mining landscape
- Different power sources used by miners
- The private and confidential nature of mining operations
Accurate estimates of energy usage often rely on assumptions, approximations, and statistical models based on available data. An infographic published by Digiconomist reveals the challenges of accurately measuring Bitcoin's energy consumption. Given that electricity costs are a significant ongoing expense, the total electricity consumption of the Bitcoin network is closely related to miners' revenues.
Figure 5: Steps to Determine Bitcoin Mining Energy Consumption
2) U.S. Bitcoin Mining Facilities and Energy Consumption Data
The New York Times listed 34 Bitcoin mining facilities, all large-scale operations in the U.S. with significant energy consumption. The operation of these facilities incurs costs, such as increased electricity bills and substantial carbon emissions, impacting nearby individuals. Each of these 34 mining projects consumes at least 30,000 times the average electricity consumption of a U.S. household. Collectively, these operations consume over 3,900 megawatts of electricity, nearly equivalent to the electricity consumption of 3 million surrounding households.
Figure 6: Distribution of Large Bitcoin Mining Facilities in the U.S.
A Bitcoin mining facility in Kearney, Nebraska consumes electricity equivalent to that of 73,000 surrounding households. A facility in Dalton, Georgia consumes electricity equivalent to that of approximately 97,000 households. The Riot Platform facility in Rockdale, Texas is the largest electricity-consuming Bitcoin mining facility in the U.S., with electricity consumption equivalent to that of 300,000 surrounding households.
The Riot facility is located near the Bitdeer facility, and its total electricity consumption exceeds the total electricity consumption of all households within a 40-mile radius.
Cryptocurrency miners in Texas have secured long-term contracts that guarantee them significantly discounted electricity rates for up to ten years.
Figure 7: Distribution of Bitcoin Mining Facilities in Texas
3) Climate Change and Bitcoin Mining and Energy Consumption
As of August 2021, the average emission factor for the Bitcoin network was 557.76 gCO2/kWh, with an expected electricity load demand of 13.39 GW, potentially resulting in annual carbon emissions of approximately 65.4 million tons of CO2 (MtCO2) from Bitcoin mining.
The carbon footprint of Bitcoin mining can be estimated based on the power sources used by miners. The following figure roughly represents the global carbon footprint of Bitcoin mining, comparable to the emissions of countries like Greece (56.6 MtCO2 in 2019), accounting for 0.19% of global total emissions.
Figure 8: Carbon Footprint of Bitcoin Mining
As of May 2021, Bitcoin mining generated approximately 31,000 tons of electronic waste annually. By June 2022, this figure had risen to 35,000 tons/year, equivalent to the annual electronic waste output of the entire Netherlands.
For example, a natural gas power plant in New York, Greenidge LLC, emits approximately 88,440 tons of CO2 equivalent annually while conducting behind-the-meter Bitcoin mining. If a power plant's electricity were entirely dedicated to Bitcoin mining, the annual emissions would reach 656,983 tons of CO2 equivalent.
Approximately 79% of total greenhouse gas emissions come from electricity generation, which is the primary source of emissions. If a power plant operates at full capacity, its annual emissions would be equivalent to the emissions from about 140,000 passenger vehicles or the emissions from burning 600 million pounds of coal.
4) Benefits Behind Bitcoin Mining Energy Consumption
To address the adverse effects of Bitcoin mining, the Bitcoin Mining Council (BMC)—a global forum composed of mining companies that account for 48.4% of the Bitcoin network's hash rate—revealed that operational data from the fourth quarter of 2022 indicated that renewable energy accounted for 58.9% of Bitcoin mining electricity consumption. This represents a significant increase from the estimated 36.8% reported in the first quarter of 2021.
Additionally, a research paper released by the Bitcoin Clean Energy Initiative memorandum states that Bitcoin mining machines are an ideal complementary technology for renewable energy and storage. Other key highlights of Bitcoin mining emphasized in the research paper include:
- Bitcoin mining can accelerate the global transition to renewable energy.
- Bitcoin mining can encourage investment in solar energy, while electricity costs may remain unchanged.
Bitcoin Mining Market Size and Revenue Statistics
Bitcoin mining, the process of verifying transactions and securing the network, has evolved into a highly competitive industry, leading to exponential growth in its market size and revenue. The market has become highly profitable, with numerous global participants, including individual miners and large mining operators.
Meanwhile, the price of Bitcoin also surpassed $65,000 in November 2021, setting a historical high for cryptocurrencies. As of June 2023, Bitcoin's market capitalization reached $597.8 billion.
The maximum supply of Bitcoin is set at 21 million coins. This ensures scarcity, which is a crucial factor in promoting Bitcoin's value proposition. By March 2023, the number of mined Bitcoins exceeded 19 million, leaving 2 million yet to be mined. Once the threshold of 21 million is reached, no new Bitcoins will be mined.
This scarcity, in turn, supports the total market value of Bitcoin mining, which currently stands at $8.11 billion.
1) Data on the Largest Bitcoin Mining Companies
A list compiled by CompaniesMarketCap includes the 16 largest publicly traded Bitcoin mining companies by valuation. Among them, Marathon Digital Holdings is the largest Bitcoin miner, with a market capitalization of $2.27 billion.
Figure 9: Top 5 Bitcoin Mining Companies by Market Capitalization
It is worth noting that this list does not include several smaller publicly traded mining companies, as well as many unlisted cryptocurrency mining companies.
In terms of revenue, Canaan is the top publicly traded mining company, reporting total revenue of $650 million in 2022. The revenue of Chinese Bitcoin mining companies primarily comes from the sale of Bitcoin mining machines.
Figure 10: Top 5 Bitcoin Mining Companies by Revenue
In terms of earnings (Earnings Before Interest and Taxes), Canaan also ranks first among publicly traded mining companies, with total earnings of $92.33 million in 2022. In 2021, the company's profits surged to $300 million, a significant improvement compared to a loss of $31.2 million in 2020.
2) Bitcoin Mining Revenue Data
As of June 26, 2023, Bitcoin miners generated daily revenue of $27.7 million, a substantial increase of 52.20% compared to $18.2 million during the same period last year. In April 2021, Bitcoin miners achieved their highest daily revenue since 2018, reaching $80.12 million (primarily due to the rise in BTC Gas fees brought by Ordinals and BRC20, WEEX note).
Figure 11: Changes in Bitcoin Miner Revenue
According to Glassnode, on June 27, 2023, Bitcoin miners transferred a record $128 million worth of BTC to exchanges in a single transaction.
Figure 12: BTC Data Transferred to Exchanges by Miners
3) Sources of Bitcoin Mining Revenue
Miners' revenue comes from two sources: Bitcoin block rewards and transaction fees.
Bitcoin rewards are earned by miners who successfully mine a block in the blockchain system. To claim the reward, miners add it to the header of the block.
Approximately every four years, the reward for successfully mining a new block in the Bitcoin network is halved. When Bitcoin was first introduced, the mining block reward was 50 Bitcoins. As of June 2023, the mining reward for each newly mined block is 6.25 Bitcoins, with a new block produced approximately every 10 minutes. The next halving is expected in 2024, when the block reward will drop to 3.125 BTC.
Figure 13: Bitcoin Halving Events
Bitcoin is halved approximately every 210,000 blocks until around 2140, when all 21 million Bitcoins will have been mined. Once the block reward reaches zero, miners will only receive transaction fee returns. Users pay transaction fees to have their transactions packaged in the Bitcoin blockchain. Users can also incentivize miners to prioritize their transactions by increasing transaction fees.
As of June 28, 2023, the average transaction fee for Bitcoin was $2.226, up from $1.168 a year ago. This data has the potential for continued growth, similar to the peak in April 2021, when it approached $62.79.
Figure 14: Bitcoin Gas Fees
Bitcoin transaction fees may depend on several factors:
- Network congestion
- Size of transaction data
- Required confirmation time
Fee calculations are typically based on transaction size (in bytes) rather than transaction amount. As of June 28, 2023, the average block size was 1.69 MB. Miners with higher hash rates have a better chance of adding new blocks to the blockchain, thus earning block rewards and transaction fees.
In the context of Bitcoin mining, hash rate refers to the computational power or speed at which mining equipment or the network can perform cryptographic calculations (known as hashing).
Driven by profit and returns, miners typically choose which coins to mine based on financial criteria, including daily reward amounts or the prices of different crypto assets.
Figure 15: Token Selection Criteria
The hash rate index report for May 2023 indicated that the average hash rate price was $82.23/PH/day (equivalent to 0.00298 BTC/PH/day), up 5.6% from the average of $77.87/PH/day (equivalent to 0.00270 BTC/PH/day) in April.
Figure 16: Bitcoin Hash Rate Measurement Units
In May 2023, miners collectively earned 33,365 BTC (equivalent to $918.5 million), a 20% increase from the 27,743 BTC (equivalent to $800.8 million) earned in April. Of this revenue, transaction fees contributed 4,540 BTC ($125.8 million), a 459% increase compared to 812 BTC ($23.5 million) in April.
Bitcoin Mining Country Statistics
From major countries like China and the United States to nations like Kazakhstan and Russia, different countries influence the complex landscape of global Bitcoin mining.
1) China's Bitcoin Mining Using Hydropower
Before the ban on Bitcoin mining in June 2021, China was the undisputed leader in terms of hash rate provision and electricity consumption, accounting for nearly 50% of the network's hash rate. The ban severely impacted mining activities from China, leading to a significant drop in hash rate.
Figure 17: Electricity Consumption for Mining by Country (TWh)
According to the Cambridge Bitcoin Electricity Consumption Index (CBECI), China was once the world's largest cryptocurrency mining center, accounting for 65% to 75% of the total hash rate of the Bitcoin network. China's monthly average hash rate share dropped from 75.5% in September 2019 to 22.3% in September 2021, a decline of over 50%.
Figure 18: Evolution of the Bitcoin Mining Market Landscape
During China's summer flood season, some regions have abundant hydropower resources, leading to lower electricity costs. Miners took advantage of this by relocating or expanding their operations to regions like Sichuan, which are rich in hydropower resources. At the start of the 2020 flood season, Sichuan accounted for 14.9% of China's total hash rate, which peaked at 61.1%. In contrast, Xinjiang, which primarily relies on coal power, saw its hash rate share drop from 55.1% at the start of the rainy season to a low of 9.6% during the same period.
Figure 19: Bitcoin Mining Areas in China
2) U.S. Bitcoin Mining Statistics
The United States is the largest Bitcoin mining region in the world, accounting for over 38% of the total hash rate of the Bitcoin network. From January 2020 to January 2022, the U.S. share of Bitcoin mining grew significantly from 4.5% to 37.8%.
Georgia has the highest hash rate share in the U.S., accounting for 30.8% in December 2021. Texas ranks second with an 11.2% share, followed by Kentucky with a 10.9% share.
Figure 20: Bitcoin Mining Shares by U.S. State
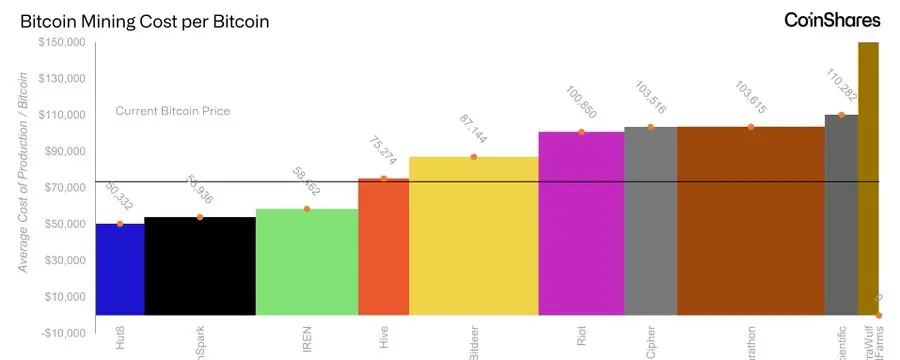
Hawaii has the highest mining cost at $54,862.05, resulting in a loss of $24,617.20, making it the most expensive state to mine Bitcoin.
The following figure shows the 10 states with the highest costs for mining a single Bitcoin (in order: Hawaii, Alaska, Connecticut, Rhode Island, Massachusetts, California, New Hampshire, Vermont, New York, New Jersey, WEEX note).
Figure 21: Top 10 States for Bitcoin Mining Costs in the U.S.
Louisiana has the lowest cost, with a total cost of $14,955.14 and a profit of $15,289.71.
Figure 22: State with the Lowest Mining Costs in the U.S.
3) Changes in the Global Bitcoin Mining Landscape
The shift of mining operations from China has altered the global mining landscape, making countries like Kazakhstan and Russia major beneficiaries of the redistribution of hash rate. According to data from the World Population Review, as of 2023, the hash rate shares of major Bitcoin mining regions are as follows:
- United States: 35.4%
- Kazakhstan: 18.1%
- Russia: 11.23%
- Canada: 9.55%
- Ireland: 4.68%
- Malaysia: 4.58%
- Germany: 4.48%
- Iran: 3.1%
After the ban was implemented, many Chinese miners relocated their operations to Kazakhstan, which is geographically closer and naturally rich in fossil fuels.
In 2019, fossil fuels accounted for 84% of Kazakhstan's electricity generation, while hydropower accounted for 12%, and solar and wind installations contributed less than 2%. The abundant coal reserves in northern Kazakhstan power over 70% of the country's power plants.
Kazakhstan's electricity is supplied by 155 power plants with different ownership models. As of January 1, 2022, the total installed capacity of the country's power plants reached 23,957 megawatts, with an available capacity of 19,004 megawatts.
From September 2019 to September 2021, Kazakhstan's share of global Bitcoin mining surged significantly from 1.3% to an impressive 24.3%. The country's Bitcoin mining operations thrived due to the self-sufficiency and energy efficiency of coal.
However, according to a report by Russian media outlet Kommersant in April 2023, Russia has become the second-largest Bitcoin mining region in the world, second only to the United States.
The data centers of Russia's top crypto mining company, Bitriver, are supported by the country's third-largest oil producer, Gazprom Neft. To meet the electricity demands of crypto mining, they generate power directly using liquefied petroleum gas.
Figure 23: Russian Mining Company Bitriver
While the U.S. maintains a significant mining lead with a supply capacity of 3-4 gigawatts, Russia's supply capacity reached 1 gigawatt between January and March 2023. The change in Russia's ranking coincided with the U.S. implementing tax and regulatory measures on cryptocurrency mining at both state and federal levels, creating a less favorable policy environment for the U.S. mining industry.
Bitcoin Mining vs. Other Resource Costs
Due to performance challenges, Bitcoin is often compared to "digital gold" rather than a payment system. Therefore, Bitcoin mining can be compared to gold mining.
Approximately 3,531 tons of gold are mined globally each year, resulting in total carbon emissions of 81 million tons. When comparing the carbon intensity of Bitcoin mining to that of physical gold mining, it is evident that the former exceeds the latter.
However, it is worth noting that this calculation includes mining fees, which do not exist in physical gold mining. Additionally, it is not advisable to make such comparisons because we can stop mining physical gold, but Bitcoin mining cannot cease for even a moment; it is an integral part of the entire Bitcoin network.
Figure 24: Gold Mining vs. Bitcoin Mining
The energy costs of resource extraction can vary significantly depending on the specific resource and extraction method. For example:
According to the U.S. Geological Survey (USGS), the energy consumption for copper mining is between 0.2 to 1.5 gigajoules (GJ/t) per ton of copper produced, with electrical applications of copper accounting for about three-quarters of total usage; producing one ton of aluminum requires approximately 17,000 kilowatt-hours (kWh) of electricity, and the energy needed to produce aluminum typically comes from coal-fired power plants, which operate at a maximum efficiency of about 30%.
In 2021, U.S. electric utilities and independent generators required the following to produce 1 kWh of electricity: 1.12 pounds of coal, 7.36 cubic feet of natural gas, 0.08 gallons of liquefied petroleum gas, and 0.82 pounds of petroleum coke (a byproduct of oil refining, produced by coking at 500-550°C, editor's note).
 Risk warning Risk warning