Capital continues to flow in, is Bitcoin about to face fluctuations?

 Despite Bitcoin temporarily reaching an annual high of $31,700, the Bitcoin market remains constrained within a narrow price range. Multiple indicators show that capital is slowly flowing into the Bitcoin market, with some indicators resembling those from the extremely volatile periods of 2016 and 2019-2020.
Source: https://insights.glassnode.com
Original Author: UkuriaOC, Glassnode
1. Capital is flowing into the Bitcoin market
Although Bitcoin temporarily reached an annual high of $31,700, its upward momentum could not be sustained, and the price returned to hover above $30,000.
The current volatility in the Bitcoin market remains very low, with the "Bollinger Bands" for Bitcoin prices only differing by 4.2%, making it the most stable Bitcoin market since early January this year.

Figure 1: Bitcoin Bollinger Bands
Capital continues to flow into the crypto market at a steady and slow pace. "Realized Market Cap" is one of the most macro and commonly used on-chain indicators, which can be used to observe the real capital flowing into the Bitcoin market. It is considered the "on-chain market cap," reflecting the cumulative total of all previously realized profits and losses.
The "Realized Market Cap" of Bitcoin is currently slightly below $400 billion and is continuously growing, indicating that Bitcoin is being traded at higher prices and that demand for Bitcoin is increasing.

Figure 2: Realized Market Cap
Typically, during bear markets, there is a significant outflow of capital from the Bitcoin market. In 2022, Bitcoin's "Realized Market Cap" decreased by 18.8%, illustrating how weak last year's bear market was. In previous cycles, the "Realized Market Cap" took 239, 193, and 95 days to recover from lows to all-time highs (ATH), while the current period has seen 188 days since the low in 2022.
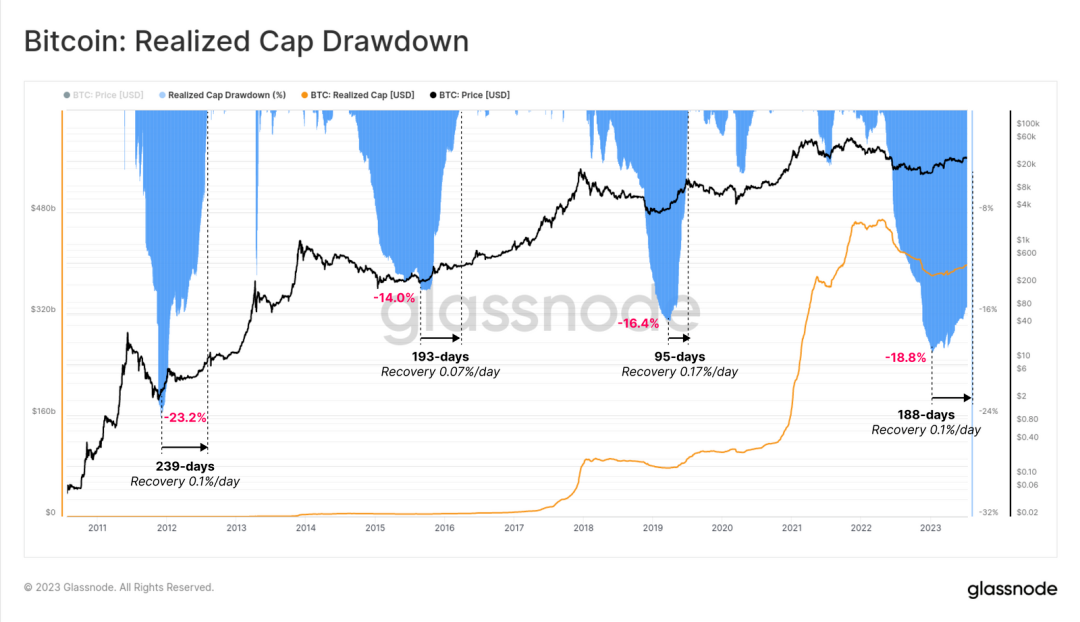
Figure 3: Decline in Realized Market Cap
Next, we analyze the NRPL indicator (the difference between realized profits and losses), which is a derivative of the Realized Market Cap.
For most of this year, the NRPL indicator has been greater than 0 (meaning that most of the Bitcoin traded has been profitable), with a daily net inflow (profits minus losses) of about $270 million. This marks the first sustained profitable state since April 2022, similar to the first half of 2019 and the end of 2020.
However, compared to the bull market of 2021, $270 million is not much, as the average daily net inflow during the 2021 bull market exceeded $3.68 billion.

Figure 4: NRPL Indicator (7-day)
We can see that so far in 2023, the realized profit-loss ratio has maintained a stable upward trend, steadily breaking through the breakeven level of 1.0 in early January.
This week, the ratio reached a less exaggerated new high, indicating that capital inflow has actually slowed down. If this high point is maintained, we may see market fluctuations similar to those in 2019-2020 and the second half of 2021.
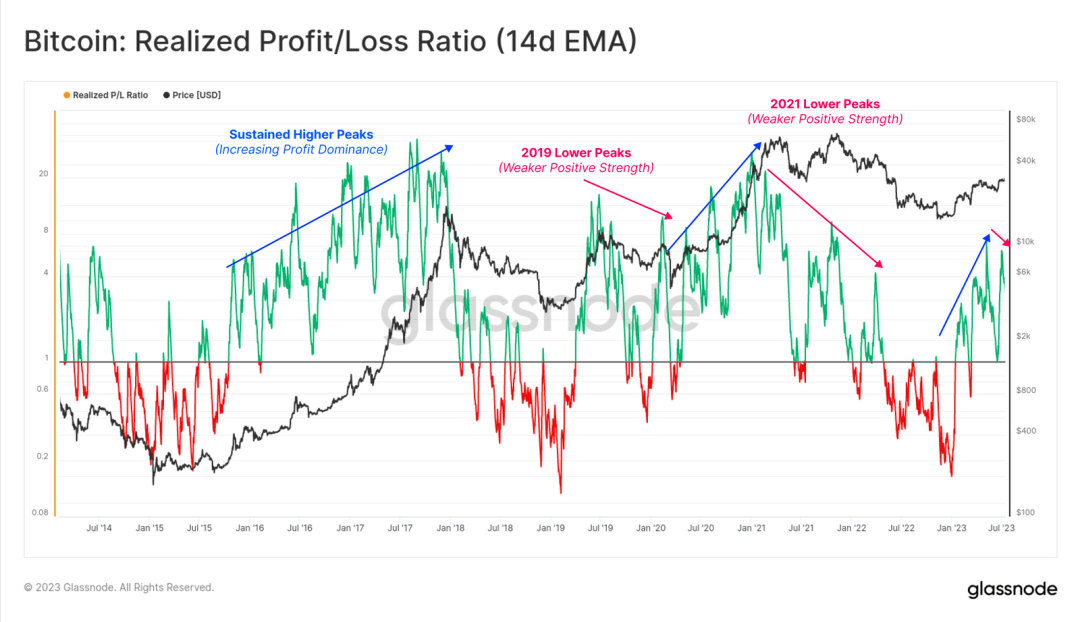
Figure 5: Realized Profit-Loss Ratio (14-day)
We can also estimate the overall trend of the crypto market by comparing the "Realized Market Cap" of BTC and ETH with the supply of mainstream stablecoins. Through this metric, we see that most capital is flowing in through the two major crypto assets, BTC and ETH, which have seen inflows of $21.9 billion and $18 billion, respectively, since the beginning of the year.
The total supply of stablecoins has decreased by $10.4 billion, mainly due to redemptions of USDC and BUSD. The analysis above clearly shows the market's preference for the two major crypto assets.

Figure 6: Realized Market Cap of Other Assets
2. The Bitcoin market in a profitable state
SOPR (Spent Output Profit Ratio) is also a useful indicator for tracking the scale of profits and losses in the entire market. We typically use this indicator to assess market conditions:
Loss-dominant state: SOPR consistently below 1.0 indicates that investors are at a loss and typically sell at breakeven (creating price resistance).
Profit-dominant state: SOPR consistently above 1.0 indicates that investors are in profit, with the breakeven level usually considered a short-term value point (creating price support).
Currently, the SOPR indicator is at 1.06, in a profit-dominant state, indicating that Bitcoin transactions are realizing an average profit of 6%. This again exhibits characteristics similar to those in 2016 and 2019.

Figure 7: SOPR (7-day moving average)
With this in mind, by studying the inflow of Bitcoin on trading platforms, we find that short-term holders (STH, i.e., investors who have been actively trading since early February) are the main group active in the market. Of the daily inflow of 39,600 BTC on trading platforms, 78% is related to short-term holders.

Figure 8: Inflows related to different groups on trading platforms
When we observe the proportion of STH holdings among profitable Bitcoins, we understand why STH is the main active group in the market—currently, this proportion exceeds 88%. Historically, this proportion is associated with a macro upward trend, suggesting that Bitcoin prices may continue to rise.
As prices rise, the STH group is increasingly likely to sell their held Bitcoins for profit.

Figure 9: Proportion of STH holdings among profitable Bitcoins
In contrast, the proportion of profitable Bitcoins held by long-term holders (LTH) is not as high, just over 73%. This indicates that about a quarter of the Bitcoins held by LTH were acquired during the 2021-2022 cycle at prices above $30,000.
 Figure 10: Proportion of profitable long-term holders' supply
Currently, the vast majority of Bitcoins held by LTH and STH (at least 73%) remain in a profitable state. This illustrates the strong recovery of the market so far in 2023.
Compared to the market weakness experienced after the FTX collapse, the current Bitcoin market shows significant improvement. After the FTX collapse, 90% of all Bitcoin transactions were at a loss (the most severe sell-off in history).

Figure 11: Realized losses of LTH/STH (90 days)
The overall realized value of the market (profits plus losses) remains close to the cycle low, at only $290 million/day. Although this seems like a high amount, it is still incomparable to October 2019 and 2020 (when Bitcoin prices were 50% lower than now).
This indicates that, despite Bitcoin's market cap being about twice what it was originally, holders with high levels of profit and loss are unwilling to trade their Bitcoins.

Figure 12: Total realized value of STH/LTH
Overall, the vast majority of Bitcoin holders are holding their Bitcoins and not increasing their positions. The proportion of BTC circulating in the market remains very low.
3. Short-term holders dominate
Typically, it is uncommon for LTH to have a higher buy-in price than STH. However, such events have indeed occurred in previous cycles and are related to sell-off activities during deep bear markets. During these periods, even experienced buyers may sell their Bitcoins and exit the market, especially those who bought near the cycle top and experienced the entire downward trend.
With the strong performance of Bitcoin from early 2023 to now and the strengthening dominance of STH, the SOPR ratio has begun to decline for the second time, providing us with a macro perspective on the reversal of investor behavior. A similar rebound in this indicator occurred in March 2020, rising above 1.0, but remained below 1.0 for the next two years.

Figure 13: Long-term and short-term SOPR ratios
4. Summary and Conclusion
Although Bitcoin temporarily reached an annual high of $31,700, trading remains confined within a narrow price range. The Bollinger Bands are extremely tight, with the price range differing by only 4.2%, indicating low market volatility and a low realized value.
Currently, short-term holders dominate inflows on trading platforms, with over 88% of Bitcoins in a profitable state. However, from a macro perspective, investors seem very unwilling to sell their Bitcoins. Multiple indicators are similar to those in the 2016 and 2019-2020 cycles, both of which experienced extreme market volatility.