Bear End, Bull Beginning: Is the emergence of Ordinals a blessing or a curse?

 This is a brand new and unique moment in Bitcoin's history, where Ordinals give rise to on-chain activity without the need for asset transaction volume transfer.
Original Title: The Emergence of Ordinals
Original Author: CryptoVizArt, Glassnode
Compiled by: Annie, Daling Think Tank
Recently, the crypto market has experienced its first significant pullback since 2023, alongside news of regulatory actions from the U.S. and the SEC's crackdown. The emergence of Ordinals and Inscriptions on Bitcoin is creating a new and unexpected demand for block capacity.
The crypto market has undergone its first major pullback since the rebound in January, falling from a weekly high of $23,300 to a low of $21,500. Meanwhile, significant regulatory news from the U.S. has also emerged, such as the SEC's fine on Kraken's staking services and the legal action against Paxos for issuing the BUSD stablecoin.
In recent weeks, Bitcoin NFTs have been introduced in the form of Ordinals and Inscriptions, creating over 69,000 addresses. As a result, Bitcoin network activity has significantly increased, leading to rising fee pressures.
In this article, we will explore the Bitcoin network from two key perspectives:
- The behavior of investors during the pullback from local highs, characterized by new buyers holding substantial unrealized profit points.
- The emergence of the Ordinals protocol and its unique impact on on-chain activity and fee market pressure.
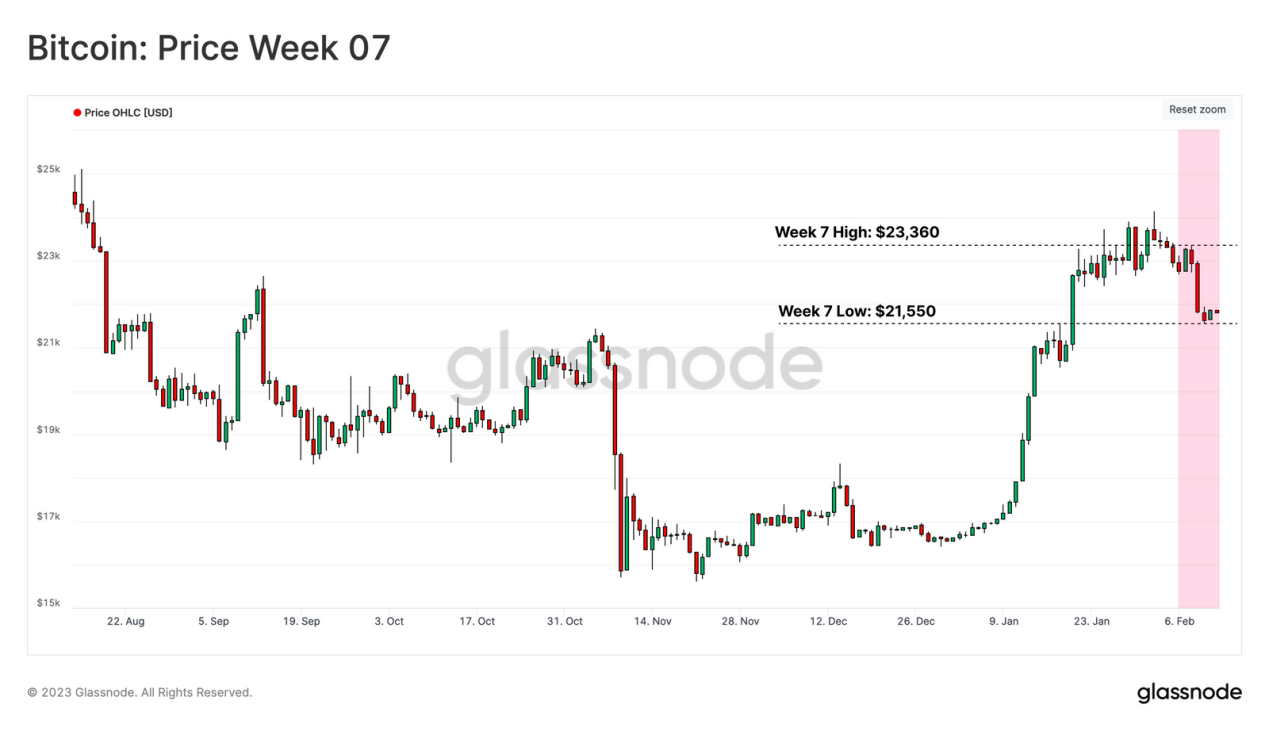
Figure 1: Bitcoin Price from February 6 to February 12
Market Enters a Macro Transition Phase
As Bitcoin's spot price breaks through the realized price, the market enters a macro transition phase, which historically has been constrained by two pricing models:
- The lower bound of this range is the realized price (blue): $19,800, corresponding to the average on-chain acquisition price of the market.
- The upper bound is the ratio of realized price to activity (orange): $32,700, which is a variant of the realized price reflecting the "implied fair value" weighted by HODLing activity levels.
By analyzing the early stages of the aforementioned range, we note similarities between the current market and the re-accumulation periods of 2015-16 and 2019.
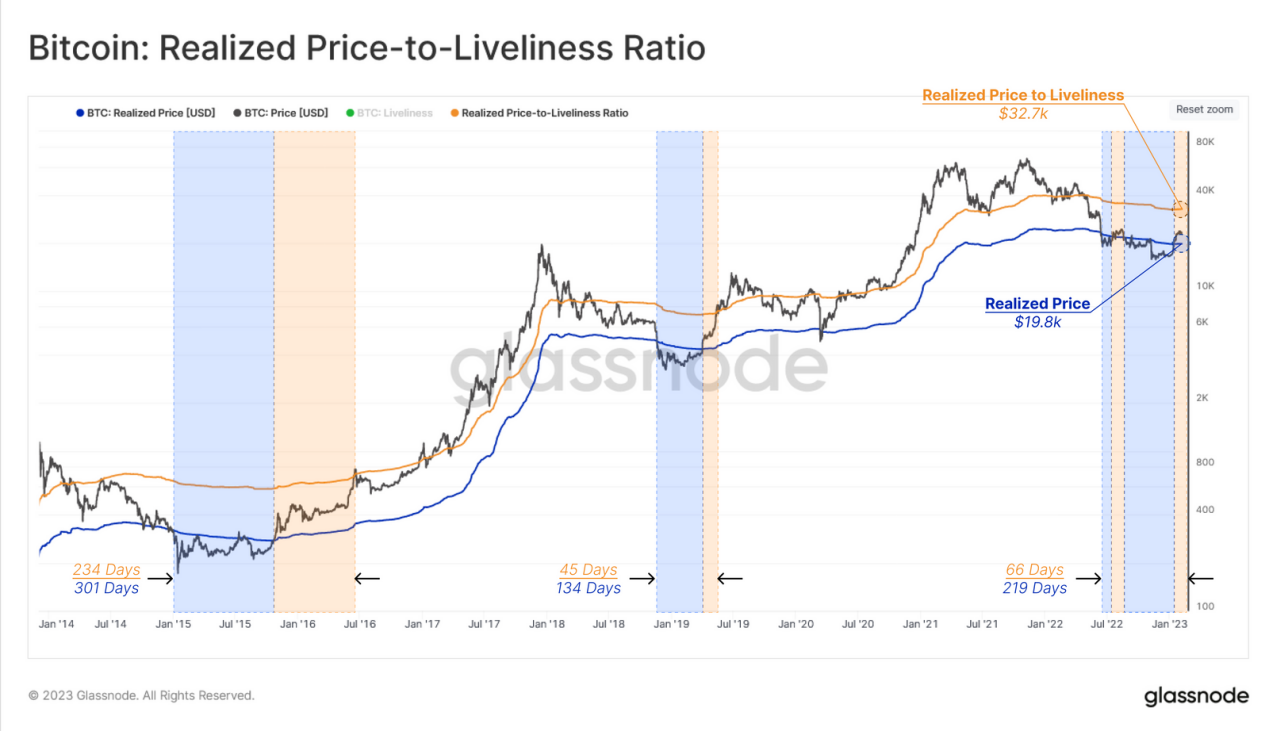
Figure 2: Realized Price to Activity Ratio - Bitcoin
Bitcoin's price paused its rise at the local high of $23,600. We can use the Accumulation Trend Index to examine investor behavior at this time, which reflects the total balance changes of active investors over the past 30 days. Larger entities (such as whales and institutions) carry a higher weight, with a value of 1 (purple) indicating that a significant number of investors are accumulating Bitcoin, increasing their on-chain balances.
Compared to previous bear markets, similar bottom discovery phase rebounds have triggered a certain degree of selling, primarily from entities that accumulated near the lows. The recent rebound is no exception (red D point), with the accumulation trend indicator dropping below 0.25.
Therefore, whether the current rebound continues will depend to some extent on whether these larger entities continue to accumulate (green A point) and whether the accumulation trend indicator returns to a value of 1.0.
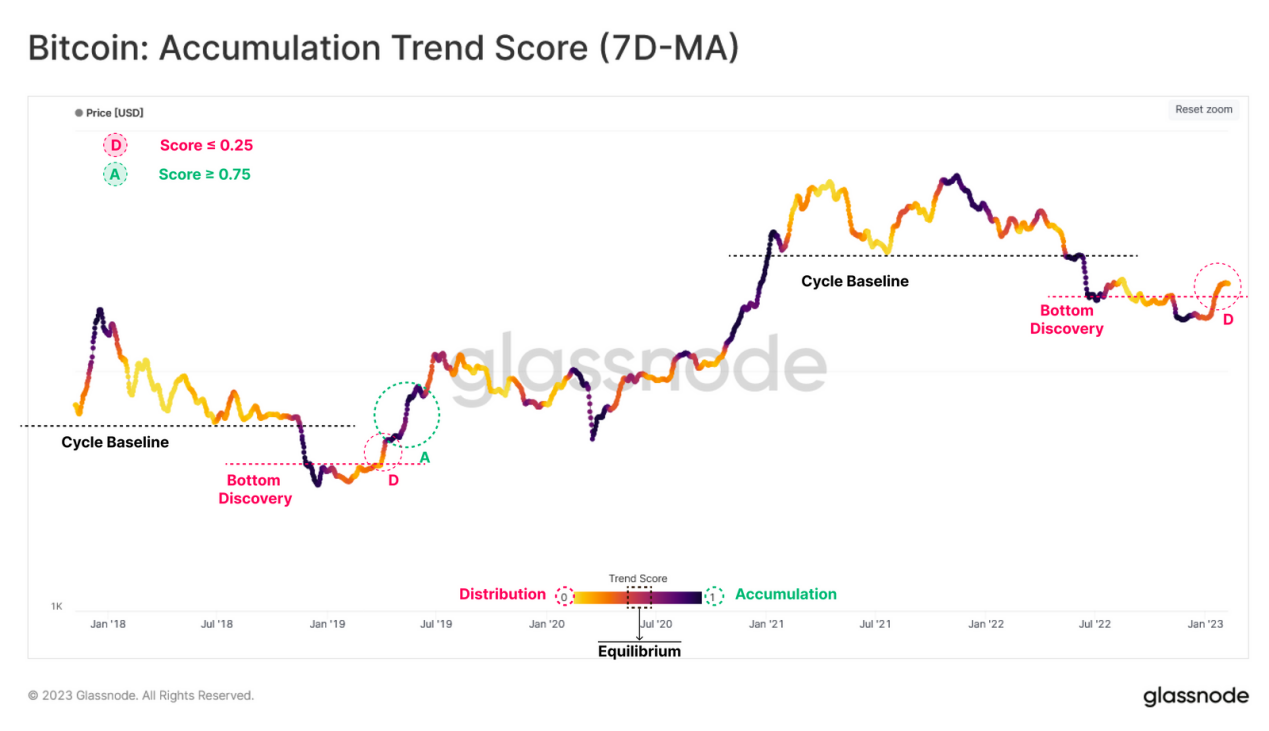
Figure 3: Accumulation Trend Indicator (7-day Moving Average) - Bitcoin
We can further explore the components of the accumulation trend indicator to provide a detailed analysis of different Bitcoin holding wallets. In recent weeks, investor behavior has undergone a widespread change, shifting from net accumulation (after the FTX capitulation) to balance (orange).
Among all holder wallets, those holding 1,000-10,000 BTC have shown the most dramatic behavioral change, transitioning from net accumulation to significant selling (red).
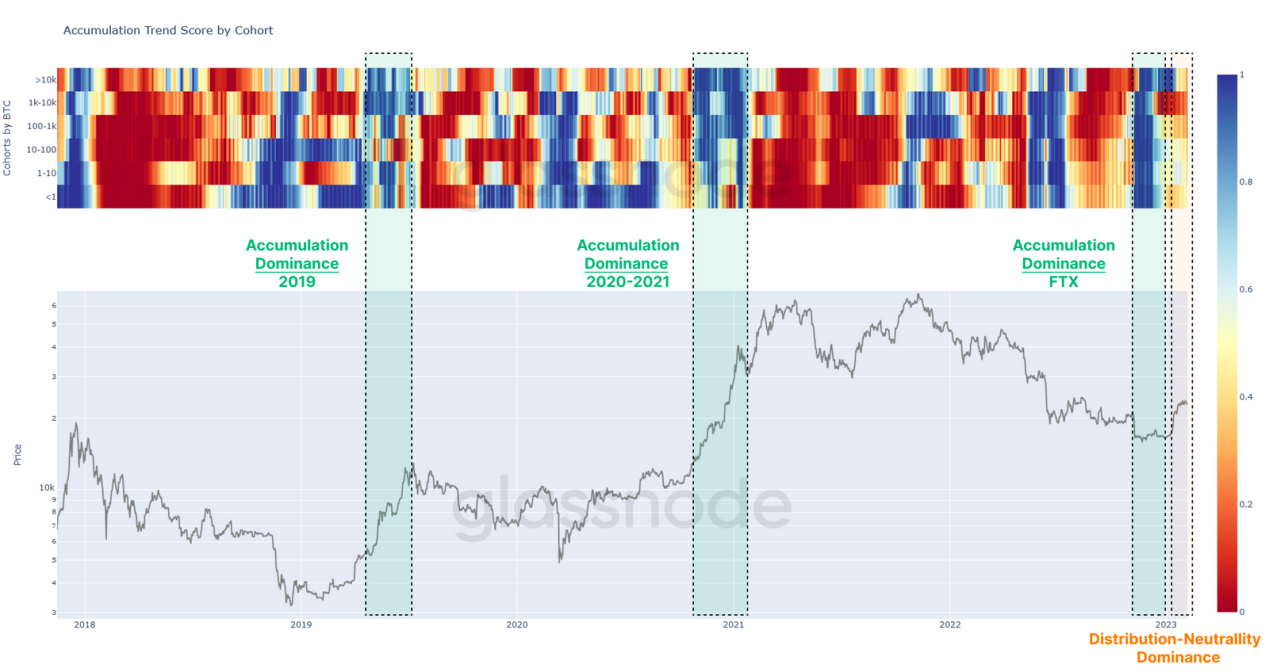
Figure 4: Accumulation Trend of Different Wallets
Short-term Holders Gain Unrealized Profits
Generally, after a pullback from extreme levels (such as macro tops or bottoms), the behavior of recently active investors becomes a significant factor influencing the market. The following chart shows the price stagnating around the mature Bitcoin (holding time > 6 months) base cost of $23,400 (blue), above the realized price of $19,800 to $20,000 (orange) and the young Bitcoin (< 6 months) base cost (red).
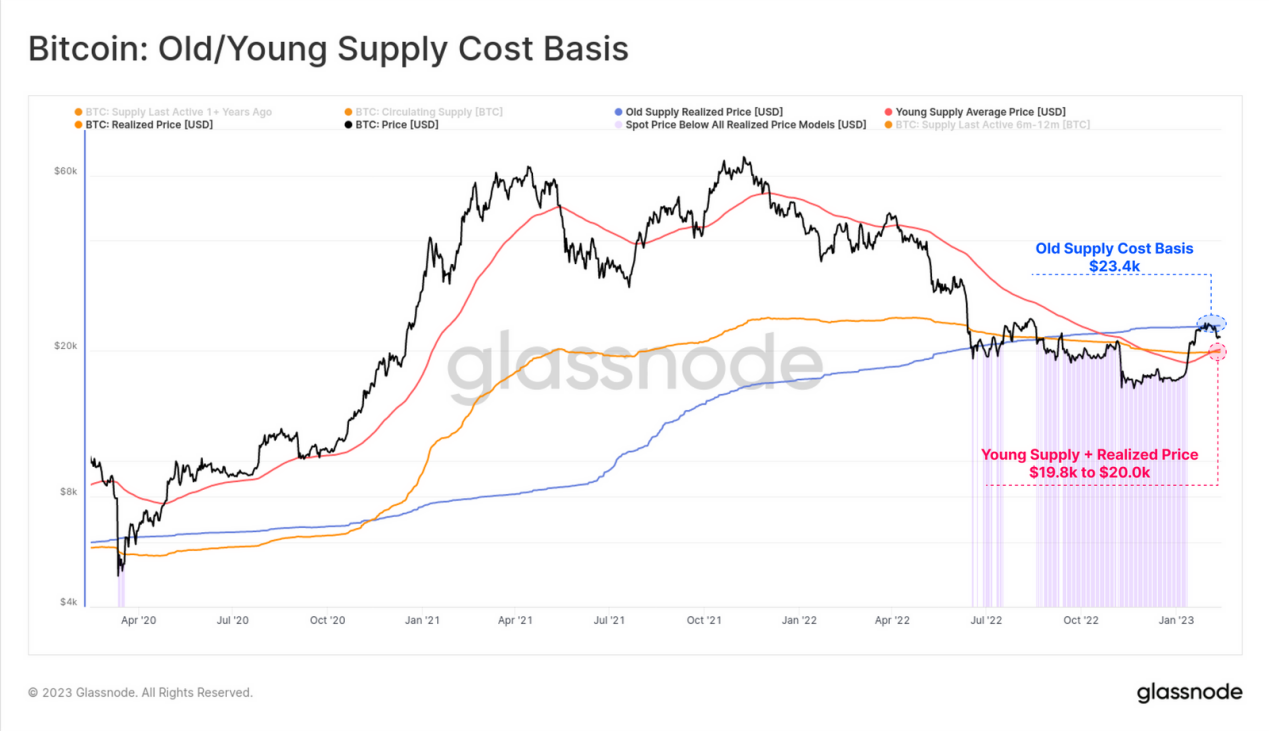
Figure 5: Mature \ Young Bitcoin Base Cost
Focusing on recent buyers, we can estimate the average unrealized profit multiple held by short-term holders using the STH-MVRV. This indicator measures the ratio of the spot price to its on-chain base cost. By analyzing the weekly average of this indicator, we can make the following observations:
- A value above 1 indicates that new investors are gaining unrealized profits, often signaling a market shift.
- Macro tops (and bottoms) remain very similar, with the average unrealized profit multiple at +40% at the top and -40% at the bottom.
- Local tops (and bottoms) typically signal when the STH-MVRV returns to the center value of 1.0, as investors react to prices returning to breakeven levels.
- When short-term holders have 20% unrealized profits (STH-MVRV = 1.2) or unrealized losses (STH-MVRV = 0.8), the likelihood of a short-term correction often increases.
Recently, the STH-MVRV reached 1.2, with $23,600 allowing short-term holders to gain 20% unrealized profits. Considering the third observation, if further correction occurs, a return of the STH-MVRV value to 1.0 would indicate a market pullback to $19,800, aligning with the breakeven return of the new buyer group and the realized price.
Ps: STH-MVRV (7D-SMA) reaching 1.0 indicates that the spot price has returned to the breakeven point of the average base cost of short-term holders.
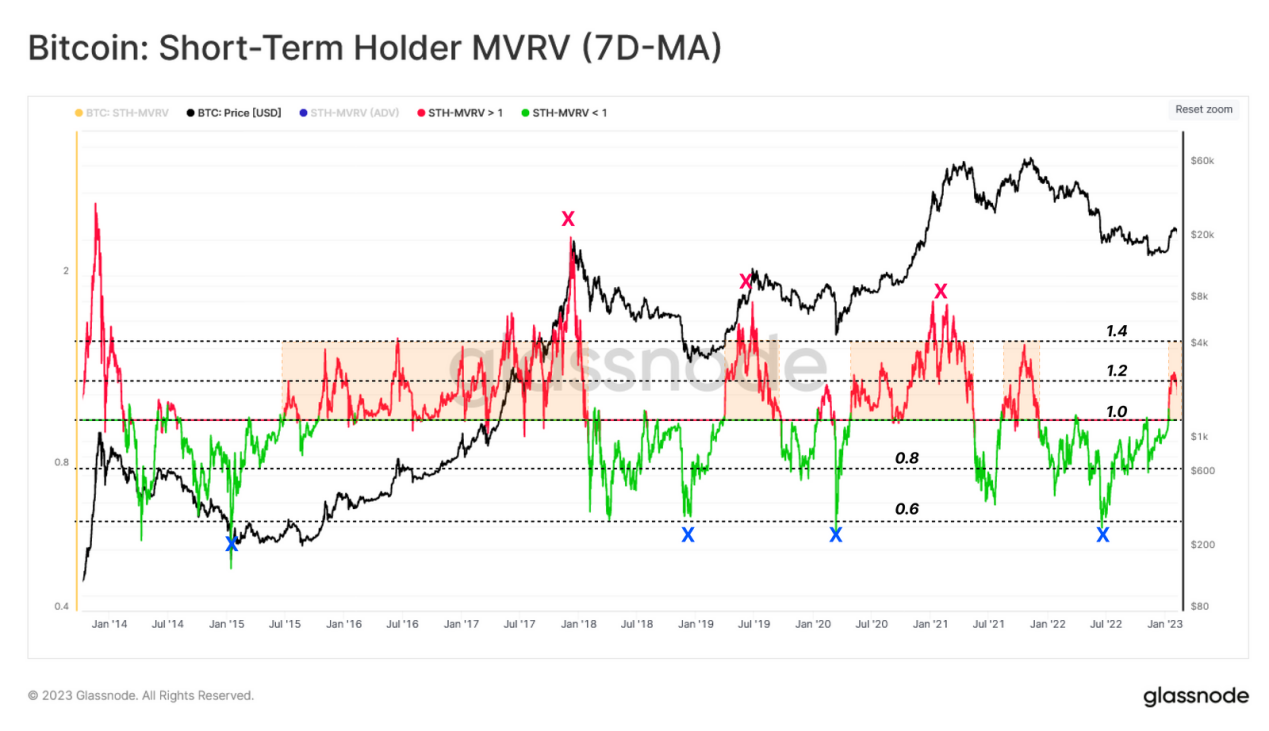
Figure 6: Short-term Holder MVRV (7-day Moving Average)
Positive On-chain Momentum
With the recent emergence of Ordinals and Inscriptions on Bitcoin, on-chain activity metrics have also seen a significant increase, although the impact on total supply changes is relatively small.
We can track the scale of daily Bitcoin flow through the 1-day bands of Realized Cap HOLD Waves. This indicator reflects the relative share of Bitcoin value that changes hands daily.
When we observe significant growth in this indicator, we can identify periods of increased demand and times when a large amount of Bitcoin changes hands. In the recent rebound, this indicator only showed a slight increase, rising from 0.75% to 1.0%.
This indicates that while network activity is climbing, it is not related to the transfer of Bitcoin acquired at higher or lower prices.
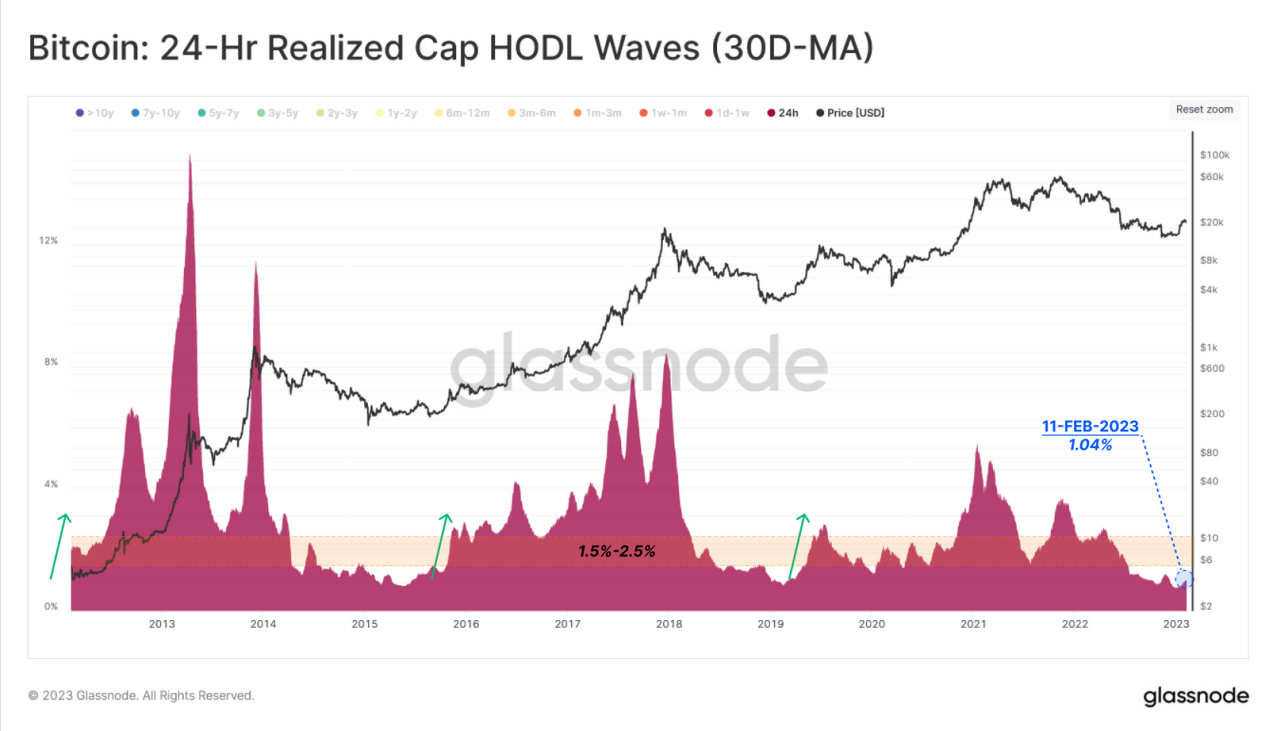
Figure 7: Realized Cap HOLD Waves - 1 Day (30-day Moving Average)
The number of new addresses and active addresses has also shown more notable changes, indicating macro changes in network activity. The following analysis compares the monthly moving averages of these metrics (red) and the annual moving averages (blue).
Since the sell-off triggered by the FTX collapse, the monthly average of new addresses joining the network has exceeded the annual average, which is a positive sign. This indicator saw a second significant increase this week, but the long-term moving average remains in a sideways trend, indicating that this rise is still in its early stages.
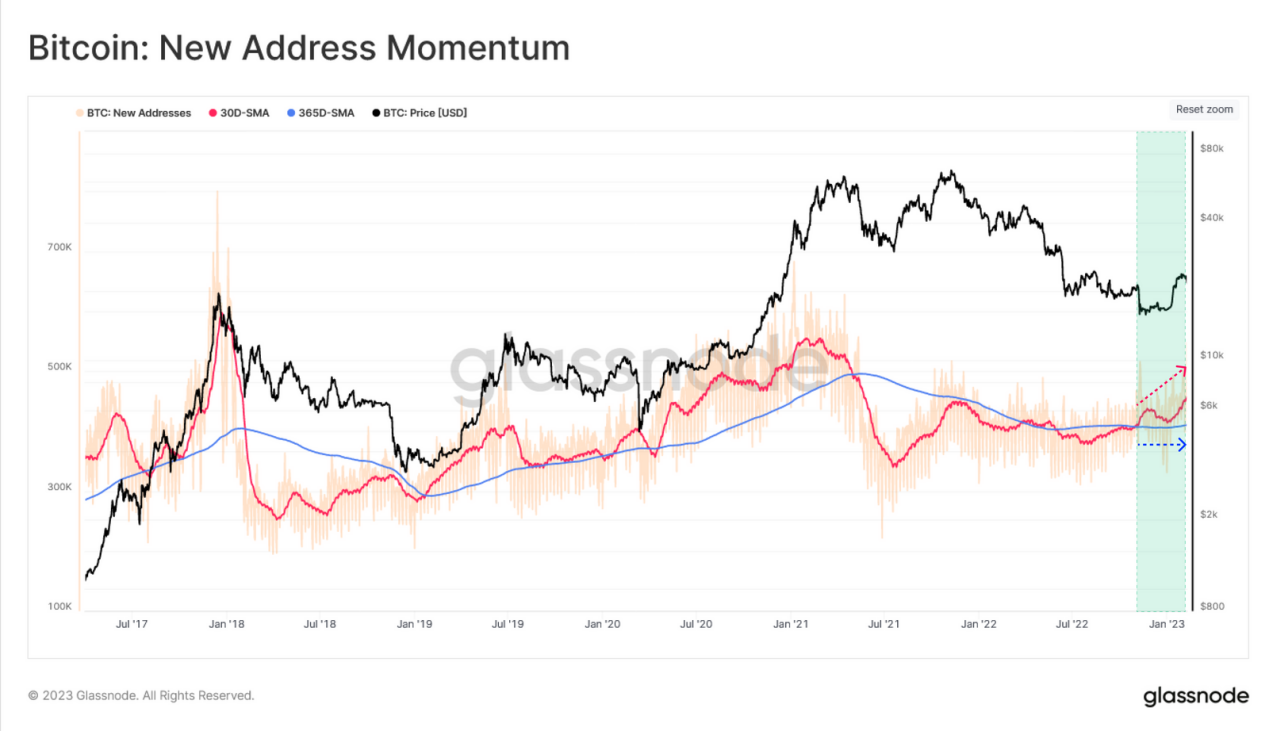
Figure 8: Number of New Addresses
We can also see a slight rise in active address momentum, but the macro sideways trend largely remains in a holding pattern.
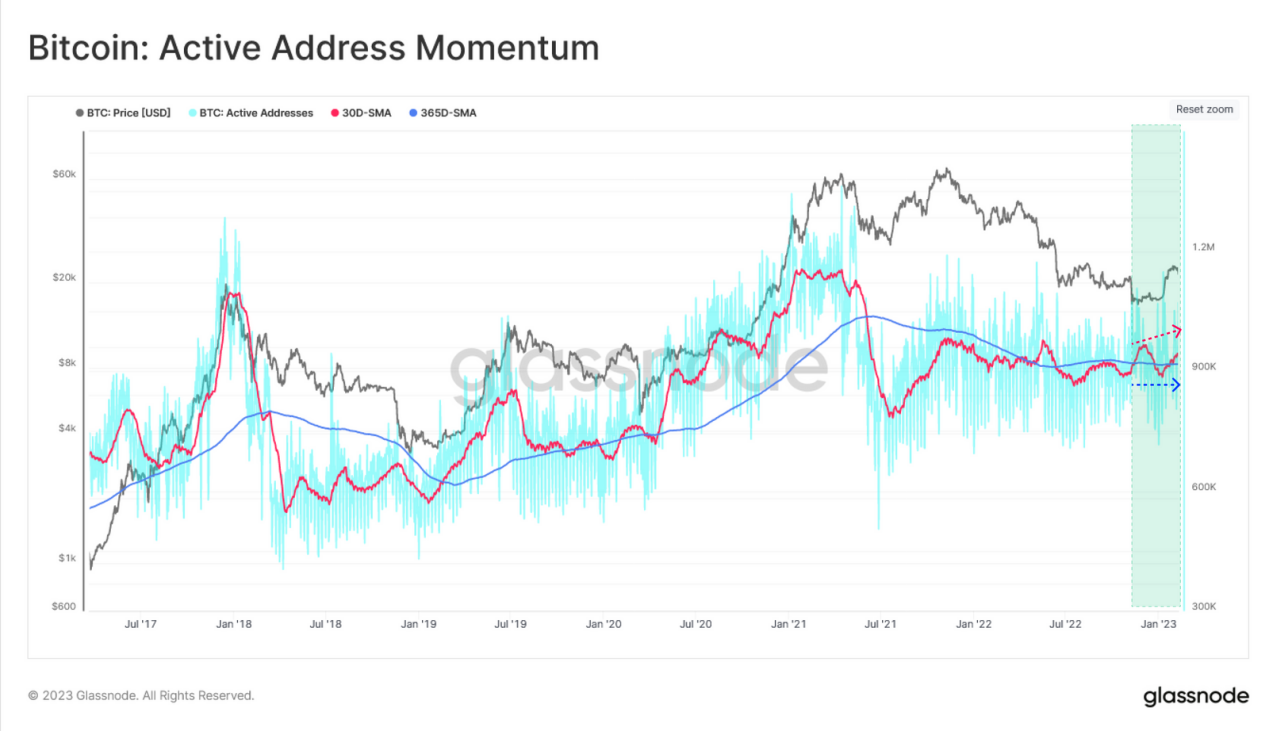
Figure 9: Number of Active Addresses - Bitcoin
Meanwhile, the total number of non-zero balance addresses has reached a historic high of 44.06 million. Overall, this indicates a short-term increase in activity on the Bitcoin network, but this does not necessarily refer to the number of Bitcoin being traded. The primary source of this activity is due to Ordinals, which do not carry a large amount of Bitcoin but rather larger data and new active users.
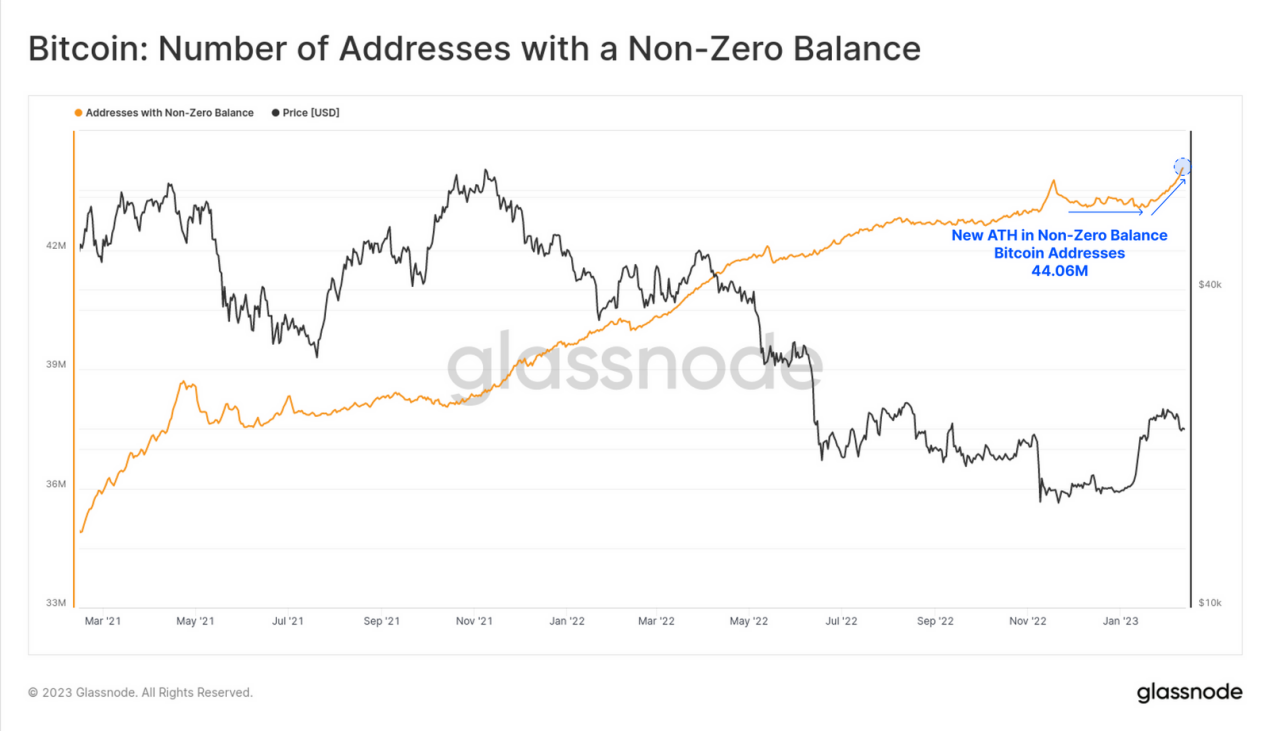
Figure 10: Number of Non-zero Balance Addresses
New Competitors in the Fee Market
Due to this new activity, the Bitcoin network is facing new demand for block capacity, bringing upward momentum to the fee market. Analyzing the fee market can effectively measure the higher demand for block capacity and often manifests during periods of overall demand growth.
Looking at the monthly average of miner fee revenue, it is clear that this indicator has not exceeded the 2.5% bear market fee rate low (blue) for quite some time.
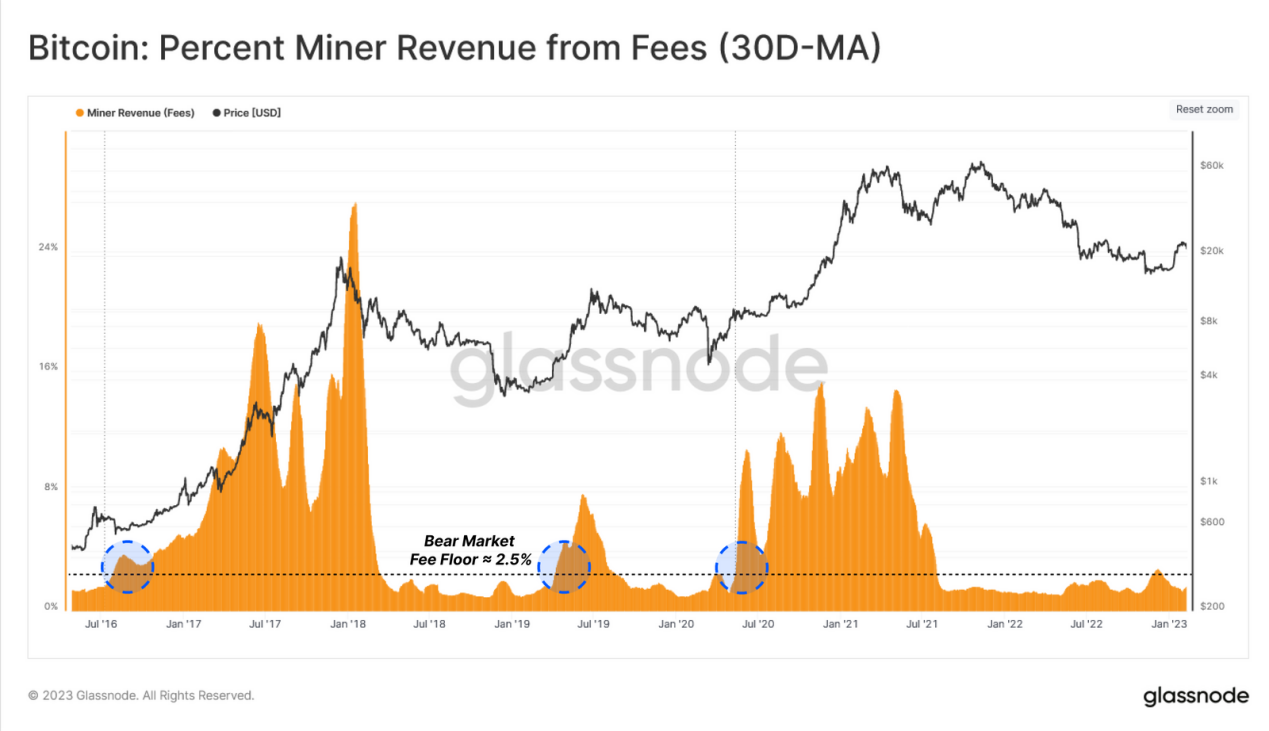
Figure 11: Miner Fee Revenue (30-day Moving Average)
Retail investors are often crucial in determining the sustainability of market transitions. Here, we can use another tool to amplify these investors' impact on the fee market by observing the weekly average of the median transaction fees paid (in USD). This is a representative indicator most likely attributed to the smaller transaction fees of retail investors.
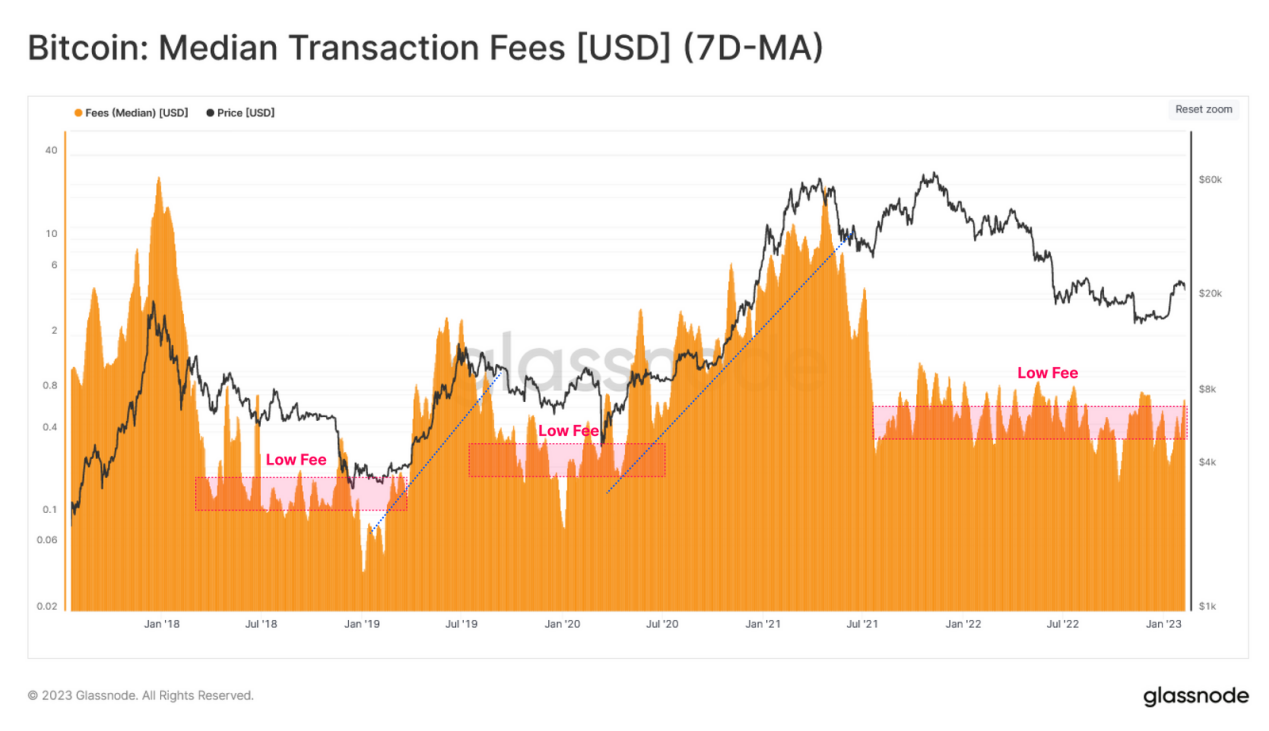
Figure 12: Median Transaction Fees
The Emergence of Ordinals
Since its launch in late January 2023, the new use case for Bitcoin involving Ordinals and Inscriptions has sparked extensive discussion throughout the community. As described by the protocol's creator, Casey Rodarmor, Ordinals utilize the Taproot soft fork and the numbering (serialization) of satoshis to write data into the witness portion of Bitcoin transactions.
Under the influence of this new innovation, the adoption and utilization rates of Taproot have surged to historical highs of 9.4% and 4.2%, respectively.
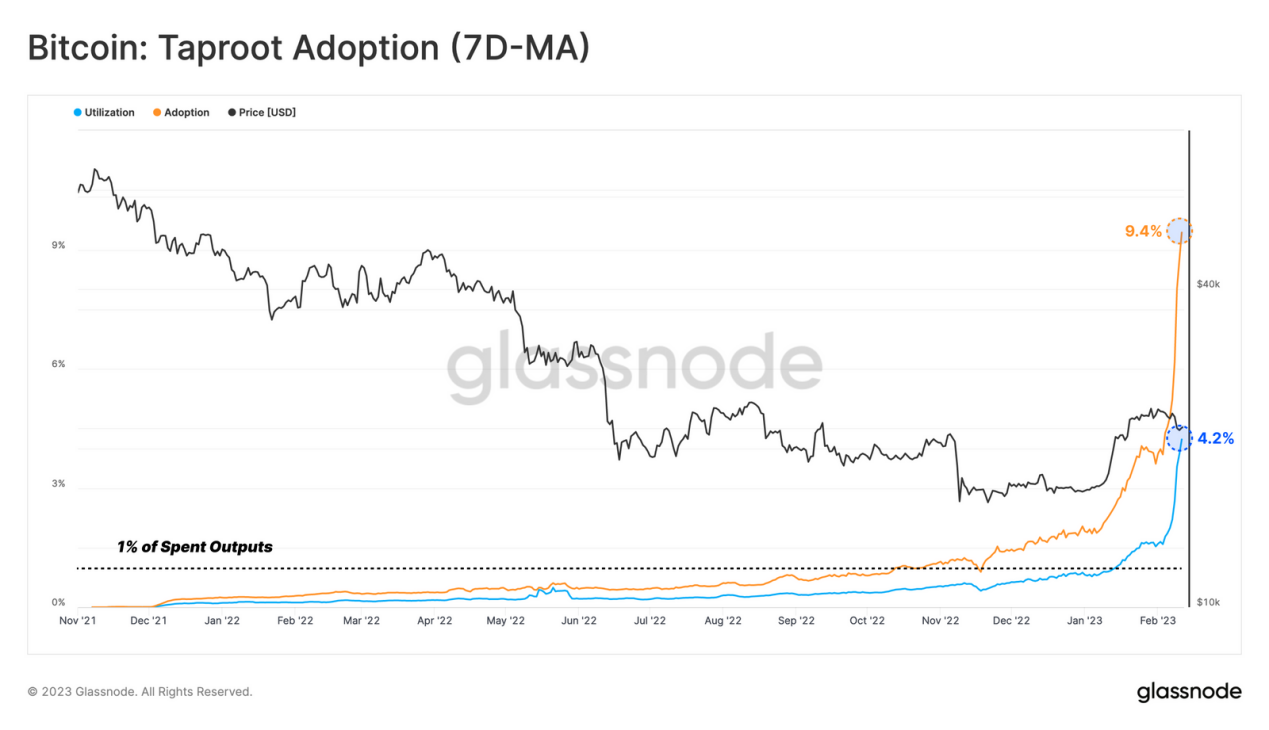
Figure 13: Taproot Adoption Rate (7-day Moving Average)
The impact of Ordinals on average block size is also significant, with the upper limit of average block size increasing from a stable 1.5 to 2.0MB to between 3.0 and 3.5MB last week.
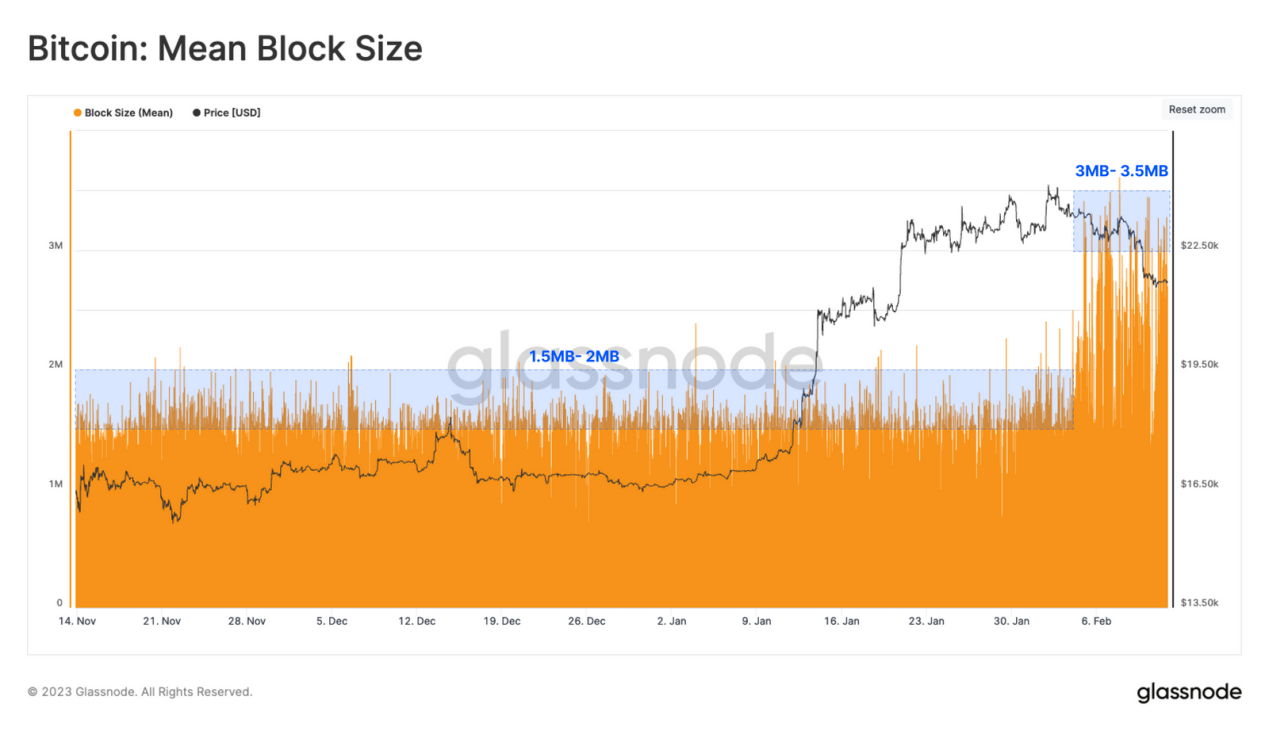
Figure 14: Average Block Size of Bitcoin
These larger blocks have sparked discussions about the potential long-term impacts of Ordinals on the size of the Bitcoin blockchain, initial node synchronization times, mempool congestion, and the long-term state of the fee market. So far, the impact of Ordinals has been to set a new lower bound on the required transaction fees for block inclusion. A significant influx of low-fee transactions (0 to 1 sat/vbyte) can be observed in our mempool (purple). This is different from the panic following the FTX collapse, where the mempool was filled with urgent, high-fee transactions (orange).
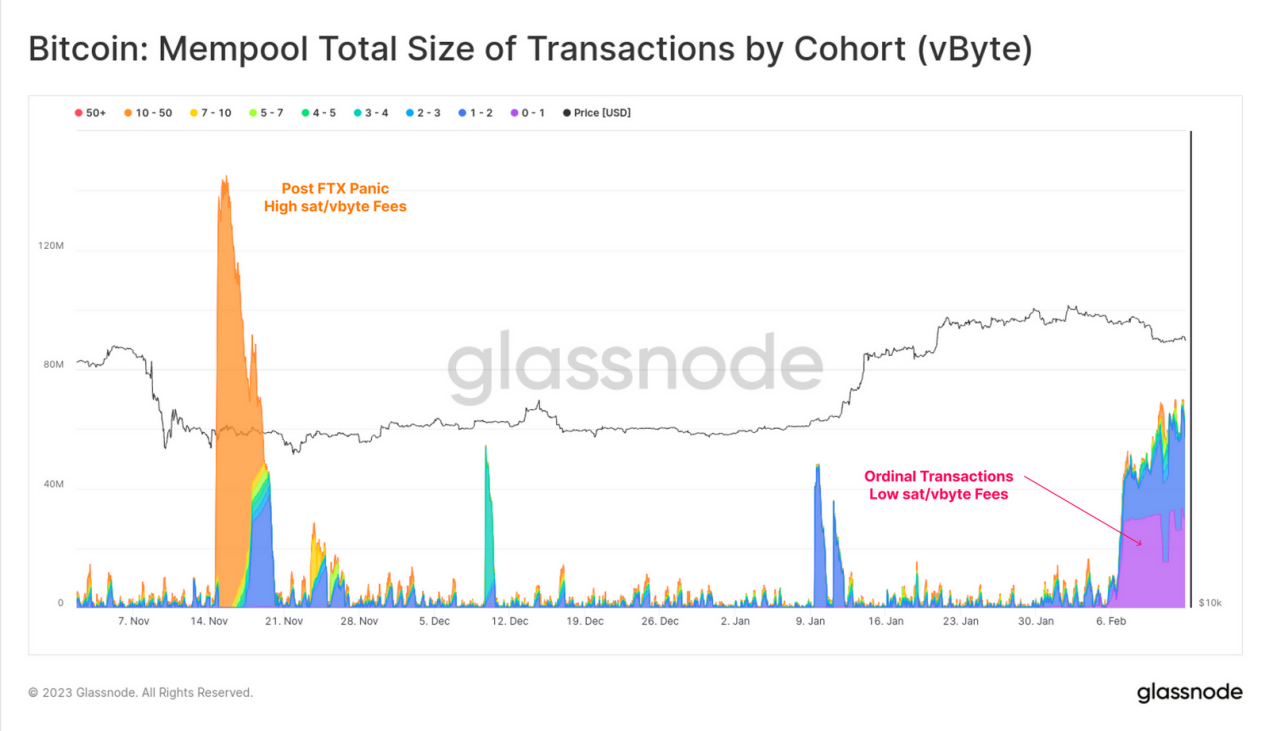
Figure 15: Total Mempool of Different Transactions
We can also estimate the number of pending blocks required to clear the mempool, assuming standard 1MB non-SegWit transactions (red) and 4MB full SegWit blocks. We can again note significant differences compared to the late FTX period, as the number of pending blocks rapidly declined as the panic subsided. With the trend of Ordinals, we can actually see a gradual increase in demand for block space over the past week.
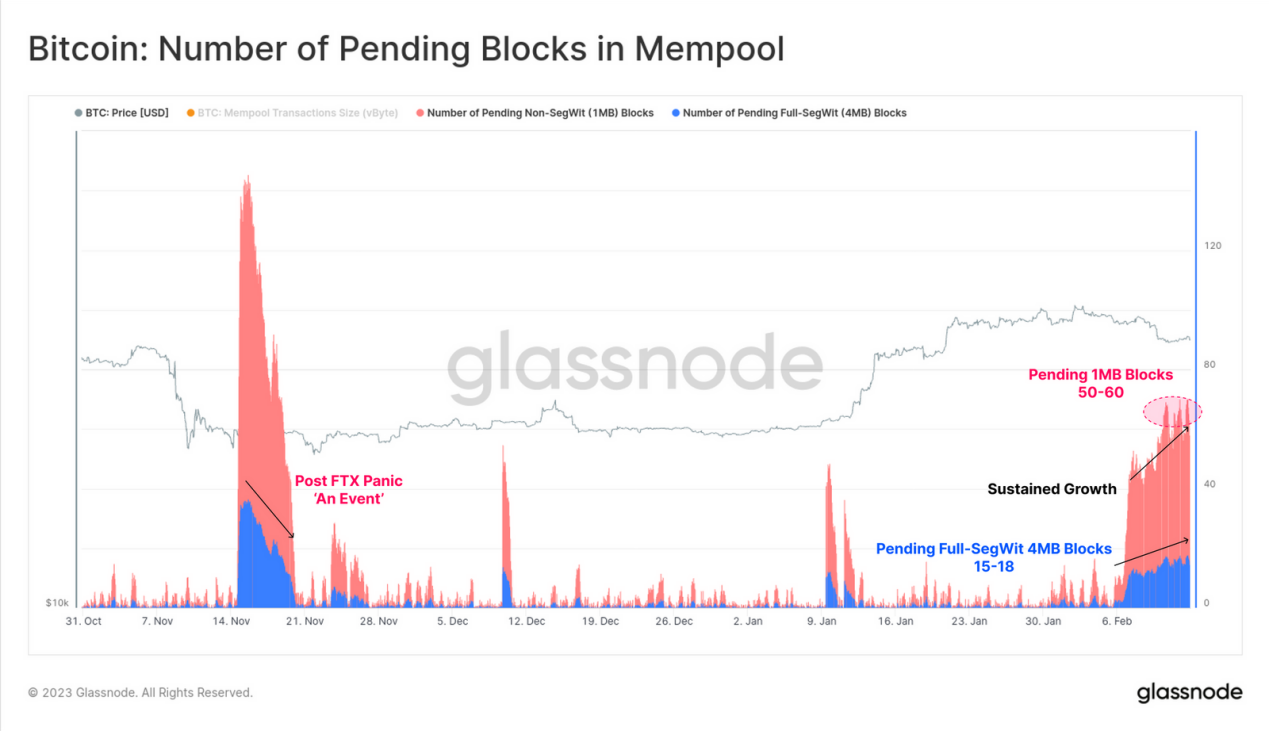
Figure 16: Number of Pending Blocks in the Mempool
Conclusion
The Bitcoin network and asset have undergone countless narratives, innovations, and major events in its tumultuous 14-year history. The emergence of Ordinals and Inscriptions is unexpected; it may not manifest as typical Bitcoin transfers among investors but rather as a potential expansion of demand for block space.
This represents a brand new and unique moment in Bitcoin's history, where Ordinals are driving on-chain activity without the need for asset trading volume transfers. This signifies the growth of the Bitcoin user base and the upward momentum in the fee market from usage that does not stem from typical investment and asset transfer use cases.