Removing Noise: Correlation Analysis between Bitcoin and Stock Market from 2018 to 2022

 What is the correlation between Bitcoin and the stock market?
Author: David, W3.Hitchhiker
Author's Note:
Generally, hedge funds will introduce correlation indicators as important references for investment and asset allocation. By reviewing the correlation trends between BTC and the Nasdaq 100 Index (NDX 100 Index) over the past four years, we can help eliminate market noise, discern the truth, and extract the key factors that truly influence market trends.
Indicator Selection Explanation:
Nasdaq 100 Index (NDX100):
In selecting stock indices, we mainly consider the Nasdaq 100 Index. This index includes the top 100 non-financial large enterprises by market capitalization listed on the Nasdaq market. Currently, 56% of the index's weight is comprised of technology companies, including Tesla, Apple, Google, Nvidia, Netflix, etc., followed by consumer services companies such as Amazon and Starbucks. Given BTC's market capitalization position in the crypto space and the industry attributes of blockchain, NDX100 and BTC share strong similarities and comparability.
Monetary Policy and Macroeconomic Indicators:
Considering that the overall crypto market and stock market have been significantly influenced by macro trends and monetary policy over the past four years, various interpretations of news have flooded the market, often leaving general investors feeling overwhelmed. This analysis will also list the main indicators of macro and monetary policy, allowing us to gain insights into the true relationship between market trends and macro factors over an extended time frame.
- Federal Funds Rate:
The Federal Funds Rate is the target interest rate set periodically by the Federal Reserve's monetary policy committee. Commercial banks borrow excess reserves overnight from the Federal Reserve or other banks based on this rate to meet reserve requirements, which can be understood as the minimum cost of funds in the U.S. financial system. This rate is one of the important tools of U.S. monetary policy.
- U.S. 10-Year Treasury Yield:
The 10-year Treasury yield can be understood as the minimum cost of funds for enterprises. Bond, stock, commodity, and real estate investors generally use the 10-year Treasury yield to calculate the opportunity cost of funds, so fluctuations in the 10-year Treasury yield typically directly affect the pricing of major asset classes.
- Federal Reserve Balance Sheet Size:
The expansion and contraction of the Federal Reserve's balance sheet equate to the easing and tightening of monetary policy. According to the Federal Reserve's own research, a $2.5 trillion reduction in assets has an impact equivalent to a 0.5 percentage point interest rate hike (Substitutability between Balance Sheet Reductions and Policy Rate Hikes: Some Illustrations and a Discussion1). This indicator needs to be examined alongside the Federal Funds Rate.
Correlation Coefficient (CC) and BTC Independent Market:
The correlation coefficient is an indicator of the strength of the relationship between two different variables x and y. A positive linear correlation coefficient greater than zero indicates a positive correlation. A value less than zero indicates a negative relationship. A zero value indicates no relationship between the two variables x and y. Note that CC can only measure the correlation between the two, not their respective rates of change.
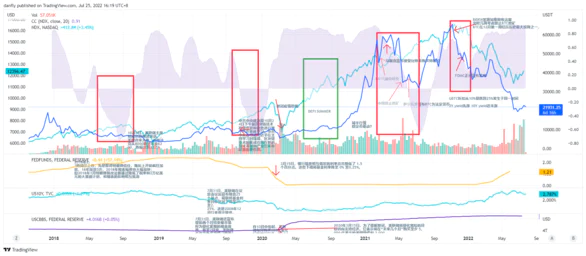
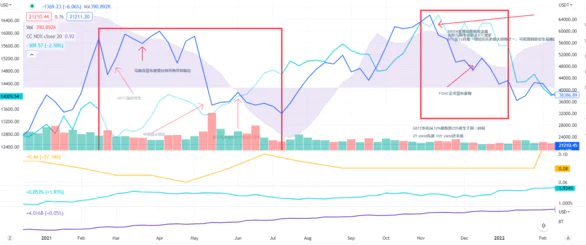
When comparing the relationship between BTC prices and the NDX100 index, we used the CC indicator (purple area). The larger the purple area above the horizontal line, the greater the positive correlation between the two; the larger the area below the horizontal line, the greater the negative correlation; the closer to the horizontal line, the smaller the correlation.
Overall, the chart below shows that the positive correlation between BTC prices and stock indices has been gradually strengthening. However, there are also several phases where the correlation weakened or even turned negative (marked by red boxes). This interval indicates that BTC has developed an independent market trend from the stock market, which is worth investigating further for the underlying reasons.
2018:
- Market Summary:
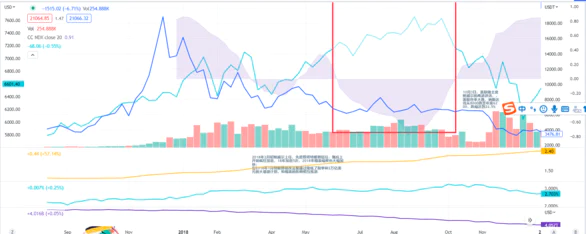
The entire year of 2018 was a major bear market for BTC, dropping from around 16,000 at the beginning of the year to about 3,500 by the end, a decline of 78%. During the same period, the NDX100 index rose from 6,500 points at the beginning of the year to 7,660 points by the end of August, with a maximum increase of 18%, but then the index fell back to 6,500 points by the end of the year.
- Macroeconomic Developments:
On February 3, 2018, Powell took office and adopted a hawkish policy, raising interest rates five times throughout the year and significantly accelerating the balance sheet reduction. However, in January 2018, the Trump tax reform bill was passed, lowering tax rates and introducing a $2 trillion infrastructure plan. The conservative monetary policy and aggressive fiscal policy offset each other, limiting the overall impact of monetary policy on the market. On October 3, Federal Reserve Chairman Powell's hawkish speech led to a rapid rise in U.S. Treasury yields, causing a collective plunge in the three major U.S. stock indices. Although there was a rebound in the middle of the month, many companies reported earnings and forward guidance that fell short of expectations during the earnings season in late October, triggering a new round of sell-offs.
On October 31, 2018, the Federal Reserve did not replace the $23 billion in maturing Treasury bonds with new debt, setting a record for the largest weekly balance sheet reduction, totaling $33.8 billion that week. By November 7, the Federal Reserve's total assets had shrunk to $4.14 trillion, the lowest level since February 2014, having decreased by more than $320 billion.
- BTC's Independent Market:
Throughout 2018, BTC's market was significantly affected by the bursting of the ICO bubble in 2017, leading to a sharp decline from its high. During the middle of the year, while the stock market stabilized and slightly rose, BTC did not follow the upward trend and continued to consolidate at the bottom. By the end of the year, the tightening of monetary policy also affected the stock market and BTC's trend.
2019:
- Market Summary:
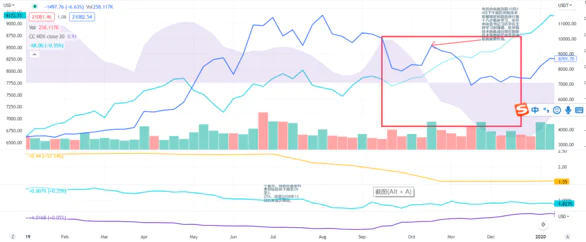
In 2019, BTC prices regained upward momentum, rising from 3,500 at the beginning of the year to around 11,500 by early July, an increase of 228%. The second half of the year saw a decline, dropping to a low of 6,900 in early November, and ending the year at around 8,700. During the same period, the NDX100 rose from 6,800 at the beginning of the year to around 9,300 by the end of the year, an increase of 37%.
- Macroeconomic Developments:
On July 31, the Federal Reserve announced a 25 basis point rate cut after its monetary policy meeting, lowering the target range for the federal funds rate to 2% to 2.25%, marking the first rate cut since December 2008. At the same time, the Federal Reserve announced the end of its balance sheet reduction policy, referred to by the market as quantitative tightening, two months ahead of schedule.
In the early hours of September 19, the Federal Reserve announced another 25 basis point rate cut, marking the second rate cut within 50 days; simultaneously, the Federal Reserve lowered the interest rate on excess reserves by 30 basis points. Powell stated that they would reconsider when to expand the balance sheet, and that the timing for expansion could be earlier than expected.
On October 31 at 2:00 AM, the Federal Reserve cut rates by 25 basis points, lowering the target range for the federal funds rate to 1.50% to 1.75%, in line with market expectations. Following this rate cut, the Federal Reserve hinted that it would pause further rate cuts in the future. The statement removed previous wording indicating that they would "take appropriate actions" to sustain economic expansion, suggesting they believed the easing policy might have ended. The balance sheet reduction continued for two years, reaching a total reduction of $690 billion from a peak of $44.6 trillion to $37.7 trillion (September 2019).
On October 24, the Political Bureau of the Central Committee of the Communist Party of China conducted its eighteenth collective study on the current status and trends of blockchain technology development. General Secretary Xi Jinping emphasized the important role of integrated applications of blockchain technology in new technological innovations and industrial transformations. Despite this significant positive news, BTC's price fell after the announcement, suggesting that large funds may have been selling the news.
- BTC's Independent Market:
The correlation between BTC and the Nasdaq maintained a certain degree of positive correlation from the beginning of the year until September, when BTC began to decline, while the stock market, due to rate cuts and balance sheet expansion, experienced a significant rise during the same period, increasing from 7,800 to 9,000 points, a rise of 15%. We believe that part of the BTC market in the first half of the year was due to funds beginning to position for the BTC halving in May 2020. By the end of the year, BTC did not follow the stock market's rise, possibly due to large funds selling the news.
Observing the independent market phases of BTC in 2018 and 2019, we find that during both periods of improved monetary policy, BTC did not follow the stock market's rise, seemingly still digesting the impact of the 2017 ICO bubble burst.
2020:
- Market Summary:
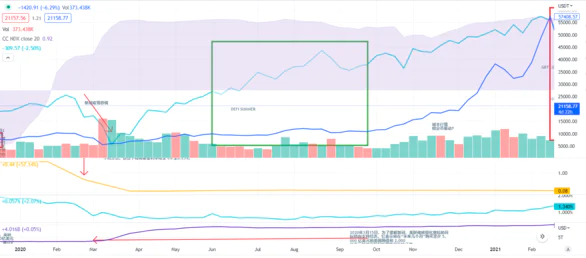
In 2020, BTC rose from 9,300 to around 38,000 by the end of the year, an increase of over four times, but most of the gains occurred in the fourth quarter, with BTC prices consolidating around 10,000 in the first three quarters. Regarding the NDX100, due to the COVID-19 pandemic at the beginning of the year, the index fell from 9,000 points to around 7,000 by mid-March, but was lifted by the Federal Reserve's easing policies, ending the year at around 13,000 points, an increase of 85% from the lowest point, nearly doubling.
- Macroeconomic Developments:
On March 15, 2020, to alleviate the impact of COVID-19, the Federal Reserve shifted its quantitative easing goals to support the economy. On that day, the Federal Reserve announced a direct cut of 1.5 percentage points to the federal funds rate, lowering it to a range of 0% to 0.25%. It stated that it would purchase at least $500 billion in U.S. Treasury bonds and $200 billion in government-backed mortgage-backed securities over the "coming months." These measures quickly boosted market sentiment, leading to a V-shaped recovery in the stock market.
These policies led to a rapid expansion of the Federal Reserve's balance sheet, growing from $4.2 trillion in March to over $6 trillion by the end of the year, an increase of over 50% in less than a year, a rare occurrence. The federal funds rate remained close to zero throughout the year.
- BTC's Independent Market:
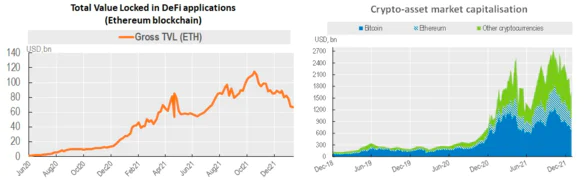
BTC maintained a high correlation with the NDX100 throughout the year, dropping to around 5,000 at the end of the first quarter along with the market, then rising in tandem with the stock market. During the second and third quarters, known as DEFI summer, BTC largely consolidated around 10,000, before experiencing a nearly fourfold surge in the fourth quarter. During DEFI summer, the total amount of funds locked on the ETH chain surged from $20 billion at the beginning of the year to $120 billion by the end of October, attracting a large number of new users to the crypto space, especially institutional users, which was one of the reasons for the explosive rise in BTC prices in the fourth quarter.
Additionally, Bitcoin's production officially halved in May 2020. Although funds had begun to anticipate the benefits of the halving in 2019, we observed that the price changes in the five months before and after the halving were not significant. The BTC market began to rally only in the fifth month after the halving occurred.
This major market rally began in October 2020 and continued until March 2021, with Bitcoin rising from 10,000 to 60,000, experiencing two macro-positive developments without following the rise (long-term digestion of the previous bubble), undergoing one of the largest monetary expansions in history, witnessing a significant influx of new investors during DEFI summer, and a large influx of traditional companies and institutional investors (see appendix), along with the benefits of the halving, all contributing to a sense of delayed arrival for this major rally.
2021:
- Market Summary:
In 2021, BTC rose from around 38,000 at the beginning of the year to nearly 60,000 in the first half, then adjusted to an annual low of 32,000 by mid-July, before surging again to a peak of around 69,000 in early November, ending the year at around 43,000, with an annual increase of 43%. The NDX100 index rose from 13,000 at the beginning of the year to 16,500 in mid-November, ending the year at 15,600, with an annual increase of 20%.
- Macroeconomic Developments:
Easing policies in response to COVID-19 continued throughout 2021.
At the FOMC meeting on November 3, 2021, the Federal Reserve began to signal a hawkish stance, announcing a gradual reduction in asset purchases, with monthly purchases of $10 billion in U.S. Treasury bonds and $5 billion in MBS.
By the end of 2021, the inflation rate in the U.S. reached 6.8%, far exceeding the Federal Reserve's target of 2%, while the overall unemployment rate dropped to 4.2%, with the labor market nearing the Federal Reserve's "maximum employment" goal. At the December 2021 meeting, the Federal Open Market Committee indicated that most members expected to raise interest rates by three-quarters of a percentage point in 2022, while doubling the pace of balance sheet reduction to $20 billion in U.S. Treasury bonds and $10 billion in MBS purchases per month. This meeting marked the formal start of tightening.
- BTC's Independent Market:
This year, BTC experienced two independent market phases, from mid-February to mid-July, where the correlation shifted from positive to negative; the second phase was from early November to the end of the year, where the correlation significantly decreased.
During the first independent market phase, BTC attempted to break through 60,000 four times, and from May 3 to May 17, it dropped from 57,000 to 35,000 in half a month, a decline of 39%. On May 19, China announced a ban on mining, leading to a shutdown of many miners and a historical low in hash rate. After May 19, BTC entered a two-month downward trend, dropping from around 35,000 to about 32,000.
After BTC's first failed attempt to break 60,000 in mid-February, significant changes began to appear in the GBTC market, with GBTC's premium turning negative, indicating that a large number of institutional investors began to stop entering the crypto market and even started to withdraw.
After the second failed attempt to break 60,000 in March, Musk began to advocate for BTC, stating that not only would Tesla accept BTC as a payment method, but Tesla also announced the purchase of BTC as a reserve asset. In hindsight, social media influencers leveraging market sentiment often indicate that prices have reached a temporary peak.

During the second independent market phase at the end of the year, BTC quickly fell from its historical high of 69,000 in early November to around 42,000 by the end of the year, a decline of 40%. Meanwhile, the NDX fell from a high of 16,500 to 15,600, a decline of only 5%. In hindsight, this drop was a reaction to the Federal Reserve's policy shift, and it is evident that BTC is more sensitive to macro changes than the stock market during this period.
Before the Federal Reserve officially announced its policy shift at the December meeting, there had already been actions to reduce bond purchases at the November 3 meeting. BTC peaked five days later, first reflected in the institutional market: in the first two weeks of November, the discount rate of GBTC suddenly dropped from around 10% to 25%. Simultaneously, from December 4 to 6, the BTC futures market also saw a significant decrease in open interest, shrinking from $23 billion to $16 billion, accelerating the decline in the spot market.
By observing the independent market phases of BTC from 2020 to 2021, we can see that after the previous major rally, BTC was constrained by periodic price pressure levels, experiencing several upward attempts followed by downward corrections. Additionally, due to the entry of traditional institutions, significant outflows from related derivative markets such as GBTC or futures often indicate temporary price peaks. Furthermore, due to the involvement of traditional institutions, BTC's price movements exhibit a stronger sensitivity to macro changes compared to the stock market.
Summary:
Through the examination and analysis of the correlation between BTC prices and the NDX100 index, we can summarize the following conclusions:
- The overall trend of BTC prices is becoming increasingly positively correlated with the NDX100. If a decrease in correlation occurs, it is generally due to specific factors in the BTC market leading to an independent market trend.
- BTC often requires a long time to digest the effects of a bubble burst. Observing the independent market phases of BTC in 2018 and 2019, we find that during both periods of improved monetary policy, BTC did not follow the stock market's rise, seemingly still digesting the impact of the 2017 ICO bubble burst. From October 2020 to March 2021, Bitcoin rose from 10,000 to 60,000, experiencing two macro-positive developments without following the rise (long-term digestion of the previous bubble), undergoing one of the largest monetary expansions in history, witnessing a significant influx of new investors during DEFI summer, and a large influx of traditional companies and institutional investors (see appendix), along with the benefits of the halving, all contributing to a sense of delayed arrival for this major rally.
- BTC is more sensitive to macro changes than the stock market. By observing the independent market phases of BTC from 2020 to 2021, we can see that after the previous major rally, BTC was constrained by periodic price pressure levels, experiencing several upward attempts followed by downward corrections. Additionally, due to the entry of traditional institutions, significant outflows from related derivative markets such as GBTC or futures often indicate temporary price peaks. Furthermore, due to the involvement of traditional institutions, BTC's price movements exhibit a stronger sensitivity to macro changes compared to the stock market.
Appendix: With the rise in popularity brought by DEFI summer, the most notable event in 2020-2021 was the rapid entry of traditional financial enterprises
Visa announced that it would settle payments on the Ethereum blockchain using the USDC stablecoin, and PayPal has begun allowing users to pay with tokens at its global online merchants. Publicly listed blue-chip companies are expanding their directly held cryptocurrency assets, such as Microstrategy and Tesla. Centralized exchanges and other fintech companies are providing user-friendly interfaces for products related to DeFi protocols and/or native crypto assets issued in DeFi (e.g., Metamask wallet).
At the same time, institutional investor interest has also intensified, with many funds launching products that allow mature investors to gain indirect exposure to crypto assets:
CME launched Bitcoin futures and options in 2021, Goldman Sachs introduced Bitcoin investment tools, and Morgan Stanley provided access to Bitcoin and cryptocurrency funds for its private wealth management clients. BlackRock added Bitcoin futures as a potential non-core investment (small allocation) for two of its funds, while some investment banks are launching digital asset departments. In October 2021, ProShares Bitcoin Strategy ETF was launched, the first ETF linked to CME BTC futures to be listed in the U.S. market.