
Nansen On-Chain Forensics: Unveiling the Truth Behind UST's Depegging

 The de-pegging of UST may be caused by the withdrawal of funds by several well-capitalized entities seeking to hedge.
Written by: Nansen
Compiled by: Foresight News
Nansen's research team delved into the UST de-pegging issue and used on-chain tracking results to debunk the rumor that the collapse of the Terra network was caused by a single malicious attacker.
Summary of Findings
Through on-chain investigations, we found that a few large whales identified vulnerabilities early in the UST de-pegging, particularly the relatively shallow liquidity of Curve pools where TerraUSD (UST) was pegged to other stablecoins, and exploited these vulnerabilities in the following ways:
Withdrawing UST funds from Terra's Anchor protocol.
Bridging these funds from Terra to Ethereum via the Wormhole cross-chain infrastructure.
Exchanging large amounts of UST for other stablecoins in Curve's liquidity pools, and during the de-pegging process, arbitraging between various pricing sources (Curve, decentralized exchanges, and centralized exchanges) through inefficiencies in the price differences between CEX and DEX markets.
Thus, we found strong evidence that the popular narrative of a "attacker" or "hacker" causing the UST de-pegging is unfounded. The de-pegging of UST may have been caused by the risk-off withdrawals of several well-funded entities.
Indirectly
Given the suddenness of the UST de-pegging, many market participants, whether directly affected or not, were eager to understand the series of events that led to UST losing its peg. To reveal these events, Nansen compiled an in-depth report that utilized on-chain data from Terra and Ethereum to reconstruct the on-chain history that led to the algorithmic stablecoin losing its peg to the dollar earlier this month.
Where possible, we aimed to provide an objective description supported by on-chain evidence. Additionally, we used Nansen's tagging methodology to add some visual distinctions to wallets and marked those entities whose on-chain activities may have impacted the de-pegging mechanism.
This study does not include potential off-chain events that may have led to UST losing its peg. The impact on investors, the breakdown of net losses between wallets, and what happened to the BTC reserves backing UST are not within the scope of this report.
On-Chain Trace Tracking
In simple terms, we define on-chain analysis as the method of using information from the blockchain ledger to identify a series of events related to the UST de-pegging. More specifically, on-chain analysis involves examining transaction data and cryptocurrency wallet activities—two data sources that are useful in piecing together the events surrounding the de-pegging.
We began our research with a foundational theoretical approach, with relevant transaction volume data informing the scope of the study. By reviewing gray literature such as social media and forum topics, we narrowed our focus to transaction data between May 7 and May 11, 2022. The thematic analysis of gray literature highlighted the significance of trading flow activity during this period for Curve liquidity pools, which in turn provided the basis for the sequence of our analysis.
Our analysis was conducted in three phases.
In the first phase, we analyzed the trading flows into and out of the Curve lending protocol. We compiled a list of wallets whose trading activities indicated they may have influenced the UST de-pegging.
The second phase of analysis included three parts: i) we observed any cross-chain transactions via the Wormhole bridge that could have led to the UST de-pegging; ii) we examined the outflows of UST from the Anchor protocol, involving the observed wallet list; iii) we investigated the sales of UST and USDC on centralized exchanges.
The third phase of analysis involved a triangulation of these comprehensive on-chain pieces of evidence, allowing us to piece together the relevant activities and formulate a narrative explaining the UST de-pegging. We also identified a list of seven wallets most likely to have played a significant role in the UST de-pegging event:
0x8d47f08ebc5554504742f547eb721a43d4947d0a (EIP 1559 User)
0x4b5e60cb1cd6c5e67af5e6cf63229d1614bb781c (Celsius)
0x1df8ea15bb725e110118f031e8e71b91abaa2a06 (hs0327.eth)
0xeb5425e650b04e49e5e8b62fbf1c3f60df01f232 (Heavy Dex Trader)
0x41339d9825963515e5705df8d3b0ea98105ebb1c (Smart LP: 0x413)
0x68963dc7c28a36fcacb0b39ac2d807b0329b9c69 (Token Millionaire / Heavy Dex Trader)
0x9f705ff1da72ed334f0e80f90aae5644f5cd7784 (Token Millionaire)
The Battle on Curve
We began our on-chain analysis with the Curve decentralized exchange protocol on Ethereum, as our gray literature review indicated it was the "starting point" of the UST de-pegging event. The hypothesis raised on Twitter was that the UST-3pool on Curve, a liquidity pool that allowed UST to be exchanged for USDC/DAI/USDT, was drained of liquidity by a major "actor," who was the primary cause of the de-pegging.
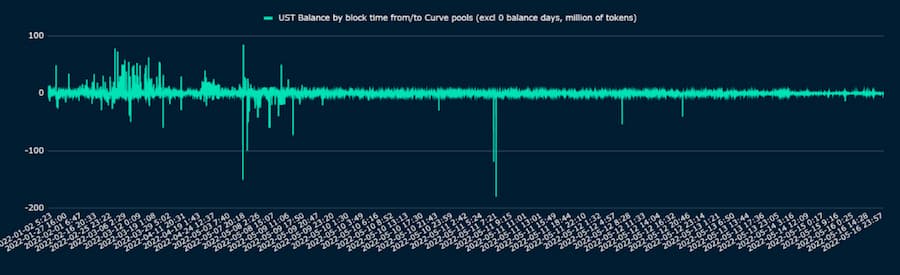
Figure 1: UST Net Balance in Curve Pool
When examining the inflows and outflows of UST into the Curve pool, two time periods stand out significantly (Figure 1): March 2022 and the recent period from May 7 to May 11. We particularly focused on the inflows of UST, as the de-pegging was said to be caused by excessive exchanges of UST for other stablecoins, at least initially.
We found that in March 2022, there were multiple inflows of UST tokens exceeding 60 million. Despite this flow volatility, the price of UST did not deviate significantly from parity in March 2022 (Figure 2).
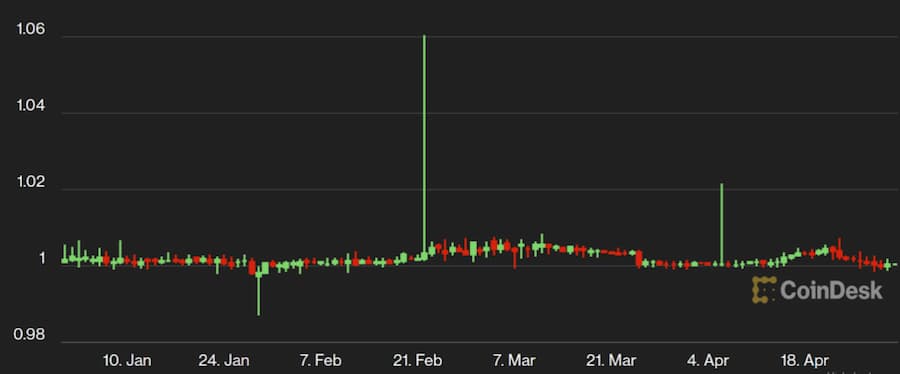
Figure 2: UST Price Chart from January to April 2022
Between May 7 and May 8, we observed that UST deviated from its peg to the dollar (see Figure 3), and we estimate that shortly thereafter, news of the de-pegging began to spread on social media (see Figure 4).
We specifically scanned for early and unusually large inflows of UST into Curve based on timestamps and wallets, as well as repeated inflows from the same wallet, or if we could identify a "network" of wallets accumulating to the same "entity."
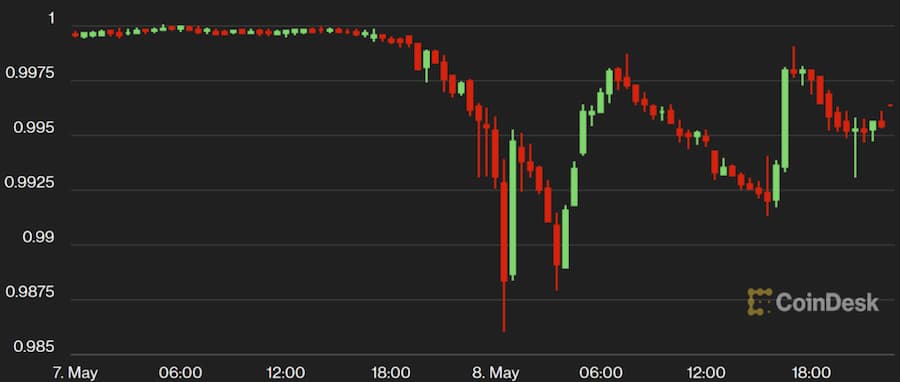
Figure 3: UST Price Chart from May 7 to May 8, 2022
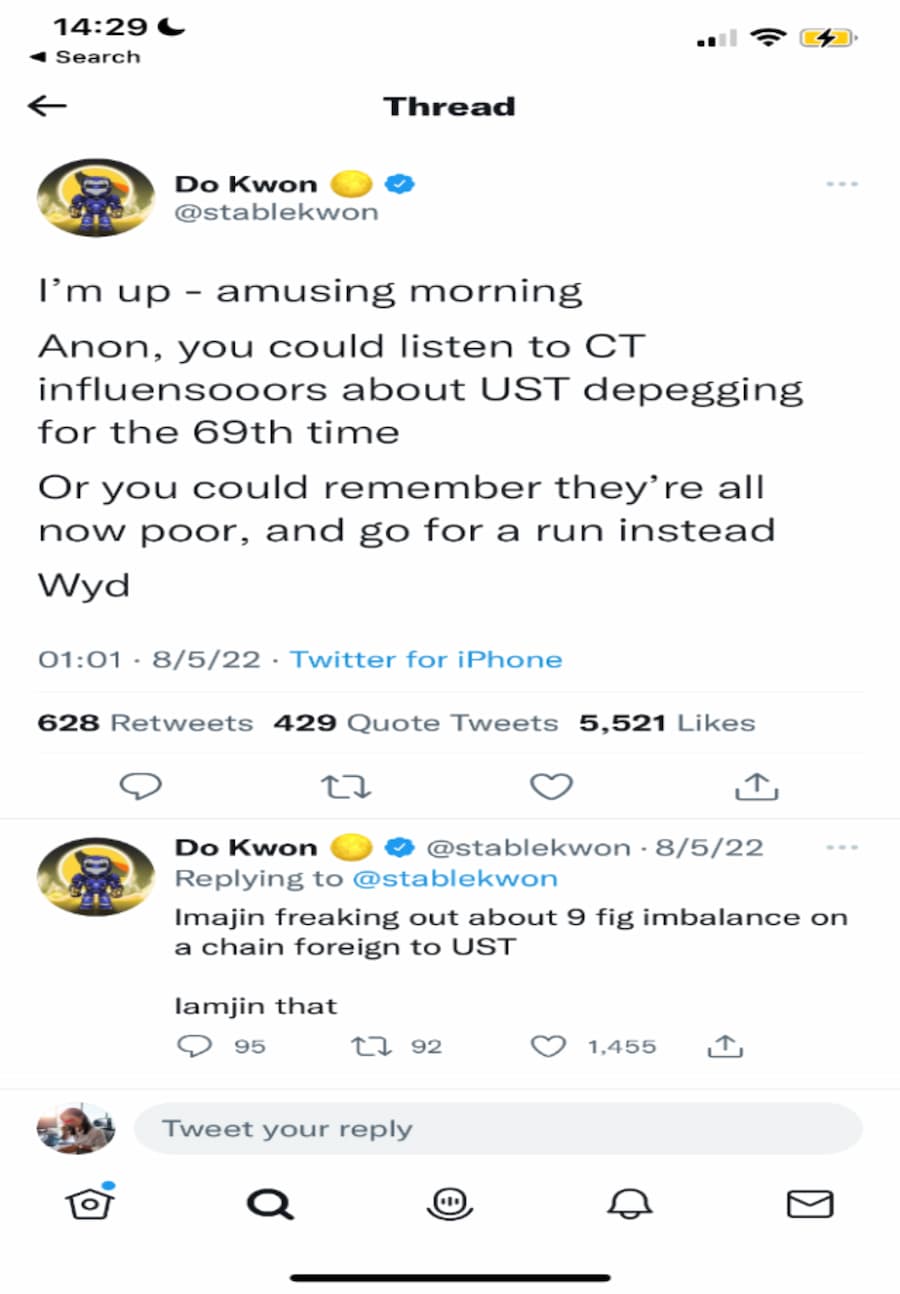
Figure 4: Screenshot of Do Kwon's personal Twitter from May 8, 2022
We plotted a time series graph summarizing the net flow of funds into the Curve pool (we voluntarily did not limit our analysis to pool 3 but included pool 4 and other entities marked by Nansen as related to Curve, see Figure 5).
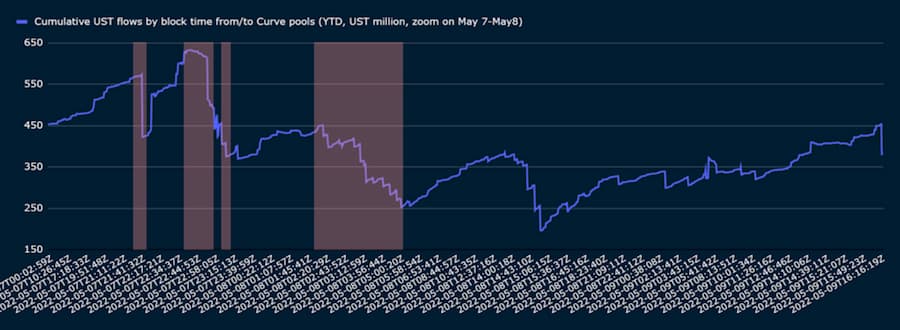
Figure 5: Cumulative Net Flow from the First Signs of De-pegging to Twitter News Flow, Summarized by Timestamp into Curve Pool
Around May 7 at 21:44 to May 8 at 5:35 (UTC) (a few hours after Do Kwon's tweet, see Figure 4), the battle between UST inflows and outflows seemed to intensify.
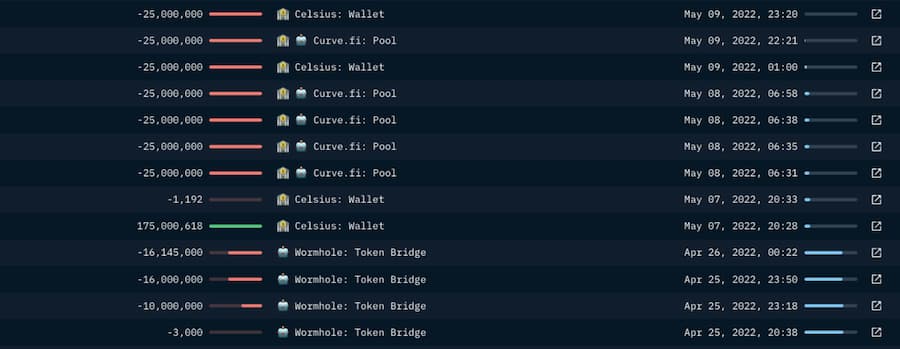
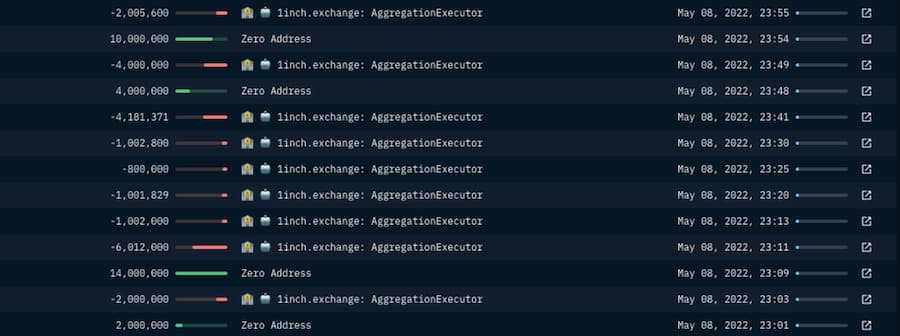
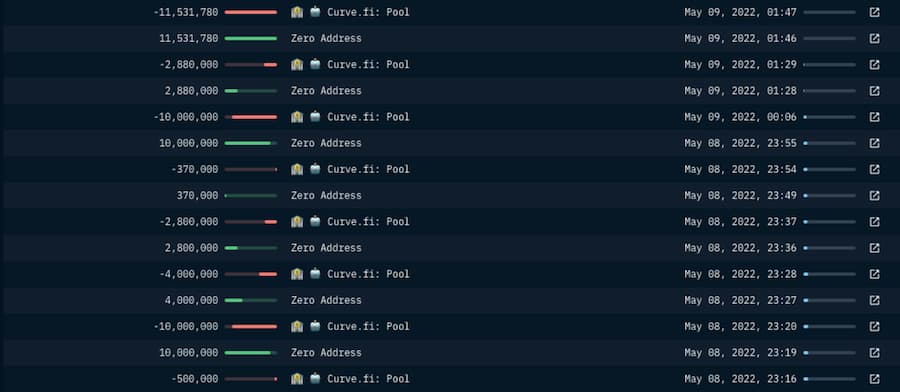
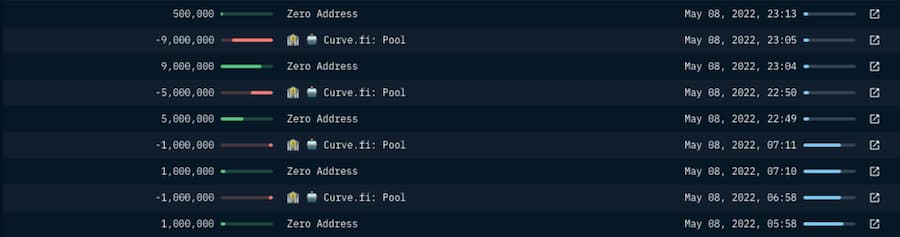
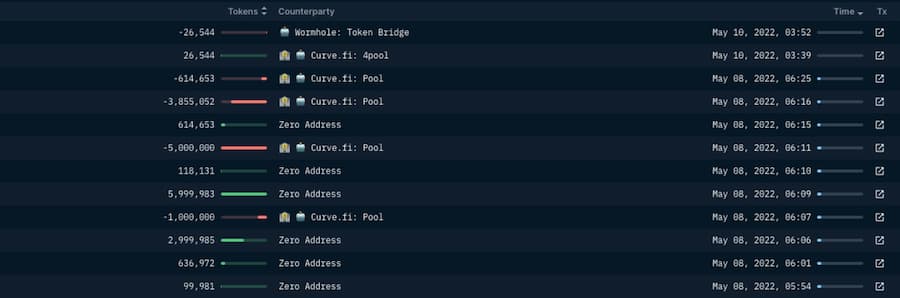
On May 7 at 21:44 UTC, a wallet associated with the Luna Foundation Guard (LFG) withdrew approximately 150 million UST from Curve (see Figure 6). Subsequently, an address (0x8d…7d0a, created before the inflow transaction and then used only for exchanging UST with USDC on Curve, as well as receiving and subsequently transferring USDC to Coinbase) received approximately 85 million UST.
Among four addresses, one associated with Celsius followed closely, with a net inflow of approximately 105 million UST into Curve. LFG and the related "peg defense" wallets made withdrawals totaling $189.6 million, with back-and-forth trading continuing until the morning of May 8.
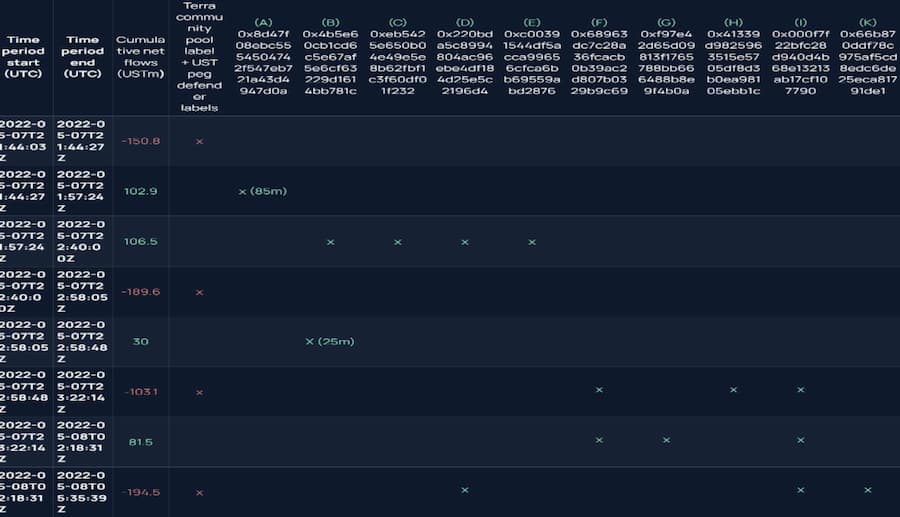
Figure 6: Timeline of UST Net Flow into Curve, along with the Wallet Addresses with the Highest UST Trading Volume at the Time
We observed that a few wallets launched an offensive on Curve (Figure 6). This was confirmed in the net flow aggregated by wallet address during May 7 and May 8. The top 18 wallets by net flow during this period accounted for 77% of the total UST inflow into Curve (Figure 7). In the last column on the right of Figure 7, we marked the wallets based on two criteria: at least some activity before the morning of May 8 + significant aggregated deposits during the period from May 7 to May 8.

Figure 7: Net Flow of UST to Curve Entities on May 7 and May 8, Ranked by Wallet with the Highest Inflows
The following four addresses were the largest sources of inflow into Curve via the 1inch DEX aggregator:
0x6b3d1a37b5c01901341f01f4975d31bc5e6c3d81 (D1), main label: masknft.eth
0x4f5f3d3f8eb2896e0e865cde934fe5103f979771 (D2), main labels: Heavy Dex Trader, NFT Collector
0x1df8ea15bb725e110118f031e8e71b91abaa2a06 (D3), main label: hs0327.eth
0x66b870ddf78c975af5cd8edc6de25eca81791de1 (K), main label: Oapital (also interacted with Curve directly)
Other wallets conducted significant trading through Curve, albeit somewhat later. Wallet 0x99fd1378ca799ed6772fe7bcdc9b30b389518962 (N), which we identified as related to Hodlnaut, is an example of one of these "early followers."
We then cross-referenced the above-marked wallets with data from Terra and the Wormhole bridge to refine the scope of wallets that may have contributed to the UST de-pegging.
Warning Signals of Large Funds Flowing Out of Anchor
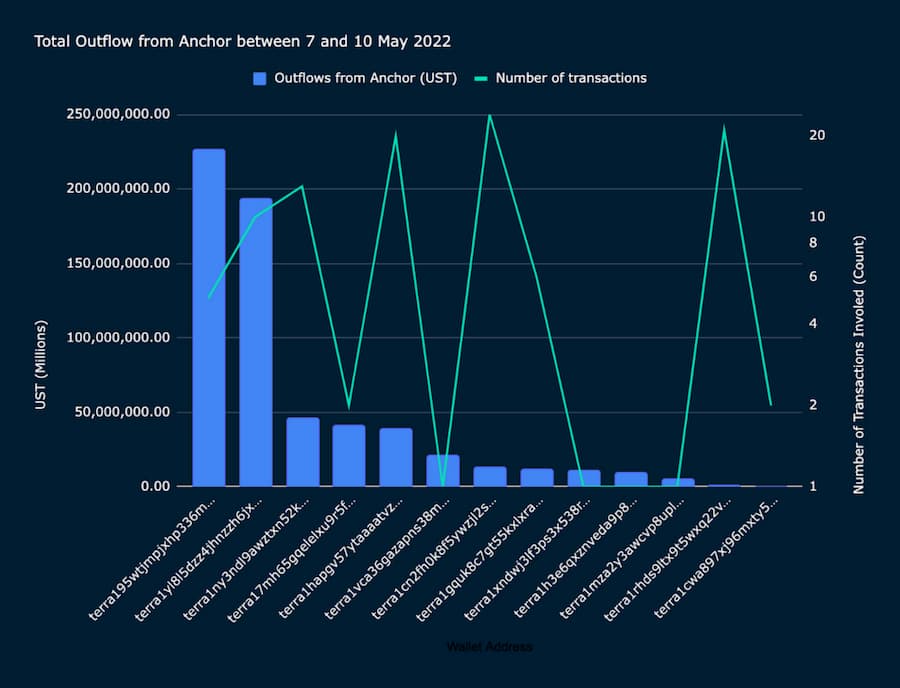
Figure 8: Large Outflows from Anchor by Marked Wallet Addresses from May 7 to May 10
During the period from May 7 to 10, we observed that the wallets with the largest outflows of UST from Anchor withdrew over 347 million UST through 8 transactions. Overall, the top 20 addresses withdrew a total of 2 billion UST from Anchor through a total of 5051 transactions.
Analysis of UST outflows from Anchor revealed that many of the Curve exchange wallets we previously marked began withdrawing UST tokens from Anchor as early as April 2022. However, the surge in withdrawal amounts from Anchor involving these wallets truly began in mid-April this year.
We notably found that the wallet terra1vca36gazapns38mvupa2pfjz0g39ekdgk0wnea (wallet address 04041339d9825963515e5705df8d3b0ea98105ebb1c marked on Ethereum or (H) in the Curve section) had the highest withdrawals from Anchor between April 1 and May 6 (i.e., before the de-pegging event).
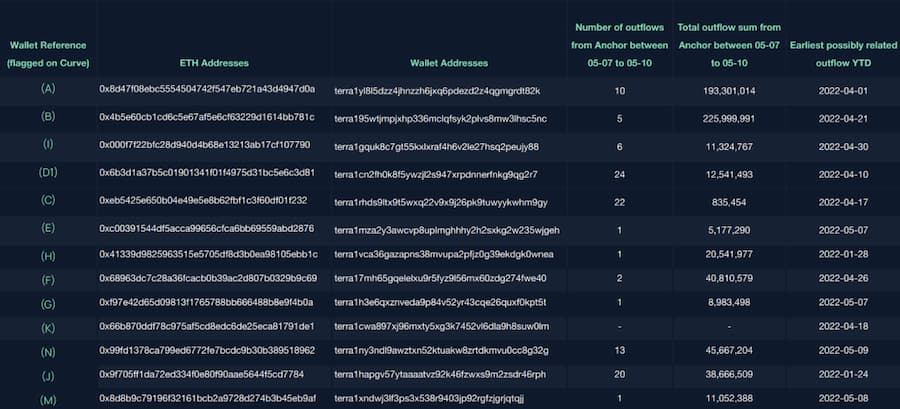
Figure 9: Outflow Statistics from Anchor by Terra Wallet and Related Ethereum Addresses
Further analysis of the outflows from Anchor emphasized the significance of two wallet addresses that had a substantial impact on the UST de-pegging.
terra1yl8l5dzz4jhnzzh6jxq6pdezd2z4qgmgrdt82k (0x8d47f08ebc5554504742f547eb721a43d4947d0a on Ethereum, or the Curve UST inflow "initiator" (A))
terra195wtjmpjxhp336mclqfsyk2plvs8mw3lhsc5nc (0x4b5e60cb1cd6c5e67af5e6cf63229d1614bb781c or Celsius (B))
These two confirmed wallets initiated significant outflows of funds from the Anchor protocol during the de-pegging event (May 7 to May 10), totaling approximately 420 million UST across 15 transactions. When cross-referenced with UST bridging from Terra to Ethereum, these two wallets were the top wallets bridged via the Wormhole.
Earlier Warning Signals: UST Bridging from Terra to Ethereum
From the perspective of Wormhole's UST token balance, there was a slight increase in April, followed by a significant rise starting May 5, just days before the de-pegging.
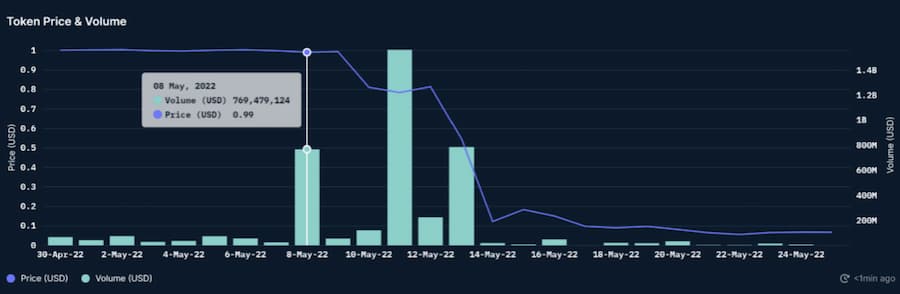
Figure 11: Price and Volume of UST Over Time
By comparing the price and trading volume of UST shown in the above chart, we found a noticeable increase in trading volume on May 8, coinciding with the initial loss of value of the token. Similarly, historical transfers from Terra to Ethereum also showed significant activity around the same dates. The peak observed below (Figure 12) indicates that a large amount of UST exited via cross-chain bridges during the de-pegging.
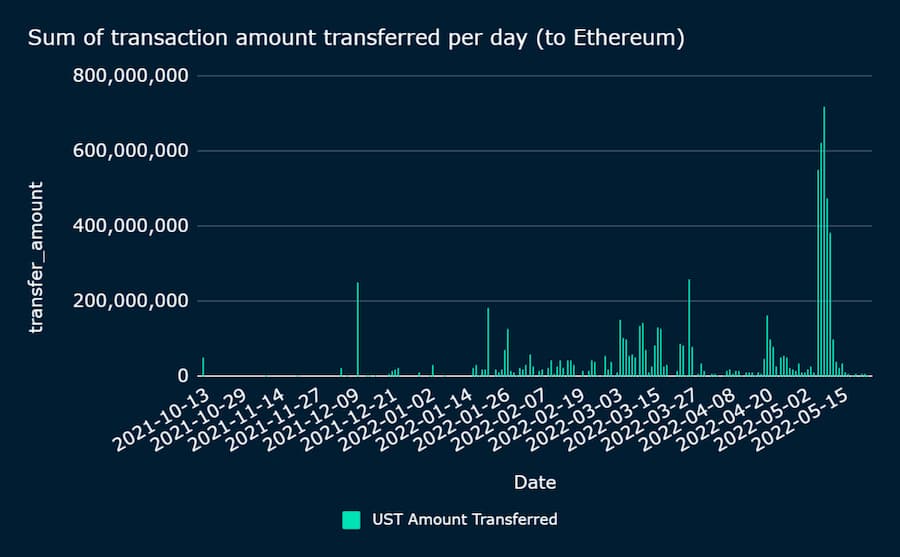
Figure 12: Daily Transfers to Ethereum (in UST token units)
In analyzing transactions from May 5 to May 8, we found that 984 unique Terra wallet addresses were active during this period. Most of the trading volume was concentrated in a few wallets. For example, the top 10 wallet addresses accounted for over 57% of the total UST transferred during this time frame.
Additionally, we observed that the distribution of net flows among the top 10 wallets was also significantly imbalanced. The total transfers between the first and tenth wallets differed by over 144 million UST. Figure 13 describes the top 10 most active wallet addresses during the observation period.
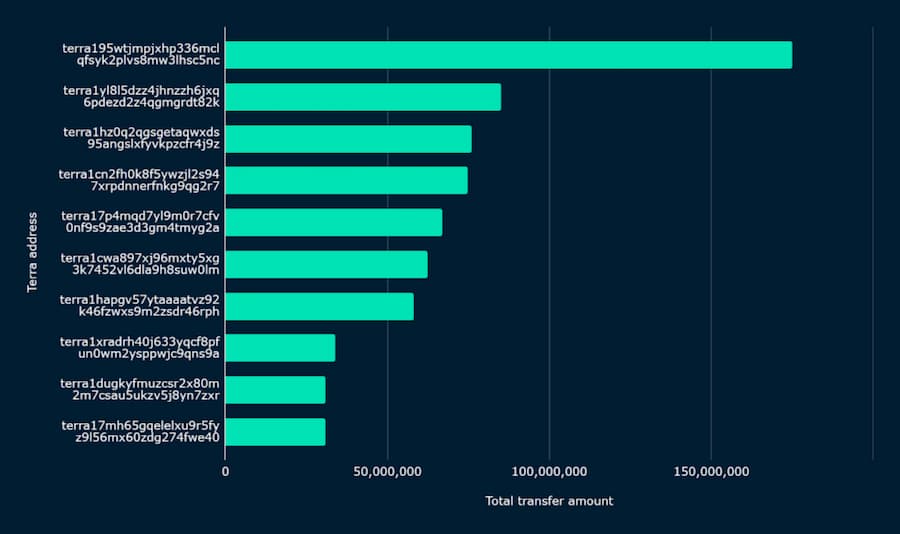
Figure 13: Top 10 Wallets from Terra to Ethereum by Transaction Volume from May 5 to May 8 (UST).
Deep Dive into Suspicious Wallets (May 5 to May 8)
Based on on-chain data, we found that these wallets primarily interacted with the Anchor protocol while on Terra. After bridging to Ethereum, they interacted with Curve and 1inch.
Below, we will introduce some suspicious wallets that recorded significant transactions on the Wormhole bridge shortly before the UST de-pegging.
- 0x8d47f08ebc5554504742f547eb721a43d4947d0a (A) (See Figure 7)

This wallet was created shortly before and deployed on May 7.
All transaction records mostly relate to UST and USDC and stopped on May 9. The most notable transaction was on May 7, connecting over 85 million UST with Ethereum. These tokens were subsequently sent to Curve and exchanged for approximately 84.5 million USDC.
We can link this wallet to Terra's "sister" address (terra1yl8l5dzz4jhnzzh6jxq6pdezd2z4qgmgrdt82k), which was one of the top wallets bridging UST to Ethereum from May 5 to May 8. As we found in the Anchor analysis, this wallet was responsible for 10 transactions withdrawing approximately $193 million from Anchor between May 7 and May 10.
- 0x4b5e60cb1cd6c5e67af5e6cf63229d1614bb781c (B) or Celsius (see Figure 7)
This wallet became active in late April 2022. During the period from April 21 to 25, it bridged approximately 138 million UST tokens to Terra. Notably, this wallet bridged 175 million UST from Terra to Ethereum on May 7. The wallet receiving funds from the corresponding Terra address is 0xf642ea51c645c48196d9831a5937e95b0e9b4f7f. It then sent the funds to another address (transaction) on the same day. Of the funds in this wallet, 125 million were exchanged in batches for USDC on Curve, totaling 25 million. According to Nansen's data, Celsius was a close trading partner that had sent and received funds to and from this wallet.
Based on on-chain data, we can also link this wallet to the following Terra address terra195wtjmpjxhp336mclqfsyk2plvs8mw3lhsc5nc, which was the top wallet bridging USDT from Terra from May 5 to May 8. This wallet also interacted with Anchor, withdrawing funds since the end of April.
- 0x6b3d1a37b5c01901341f01f4975d31bc5e6c3d81 (D1) or masknft.eth (see The Battle of the Curve)
This wallet has conducted over 62 transactions since December 2021. From early April to May 8, this wallet bridged over 79 million UST to Ethereum and then primarily exchanged it for USDC through several transactions via the 1inch aggregator.
This wallet is related to terra1cn2fh0k8f5ywzjl2s947xrpdnnerfnkg9qg2r7, which we also highlighted in our Anchor Protocol analysis.
- 0x1df8ea15bb725e110118f031e8e71b91abaa2a06 (D3) or hs0327.eth (see The Battle of the Curve)
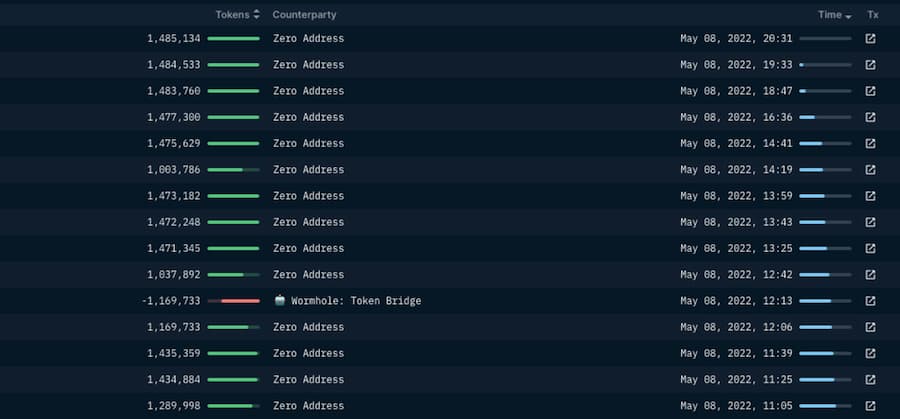
Similarly, this wallet received many transactions via Wormhole, some as early as January. On May 8, it bridged approximately 20 million UST to Ethereum in a single transaction of 1-1.5M UST. This accounted for 1.6% of the total outflow during this period.
This wallet is related to terra1vlel4dpqldcwm7ztre3k03apcldeawpq98rah0, which also bridged transactions to another Ethereum address 0x6524b211ef8e4baf346f1b780b08a3811ee9f3cd in February and March. Notably, this wallet exited Anchor earlier than others, with its latest transaction on May 1.
- 0x41339d9825963515e5705df8d3b0ea98105ebb1c (H) or Smart LP 0x413 (Figure 7)
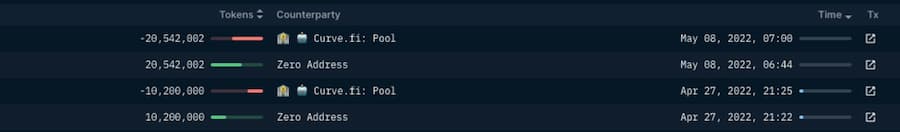
According to Nansen's tags, this wallet is Smart LP. This wallet bridged approximately 8.8 million (in late January) and then bridged 30 million UST back to Terra (in February). Additionally, it bridged approximately the same amount to Ethereum on April 27 and May 8, with transactions of 10 million and 20 million, respectively. The 20 million UST transaction can be traced back to Curve, where this wallet exchanged 20 million UST for USDC.
This wallet is related to terra1vca36gazapns38mvupa2pfjz0g39ekdgk0wnea. We also found it in our analysis of the Anchor Protocol, with transactions occurring throughout April and May. After May 7, it appears to have completely exited Anchor.
- 0x68963dc7c28a36fcacb0b39ac2d807b0329b9c69 (F) or Token Millionaire / Heavy Dex Trader (see Figure 7)
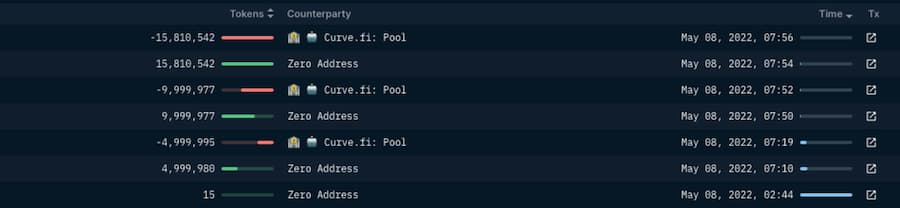
According to Nansen's tags, this wallet is a Token Millionaire. This is a relatively new wallet that only began trading at the end of March 2022 and interacted with wallets related to Alpha Finance Lab. This wallet recorded transactions from Terra to Ethereum on May 8. These transactions totaled approximately 30 million UST and were then exchanged for USDC on Curve in three separate transactions. This wallet is related to terra17mh65gqelelxu9r5fyz9l56mx60zdg274fwe40.
- 0x9f705ff1da72ed334f0e80f90aae5644f5cd7784 (J) or Token Millionaire / Heavy Dex Trader (see Figure 7)
This wallet conducted multiple transactions on May 8 and 9, bridging approximately 60 million UST to Ethereum. Subsequently, these funds were exchanged for USDT on Curve. This wallet is related to terra1hapgv57ytaaaatvz92k46fzwxs9m2zsdr46rph.
- 0xeb5425e650b04e49e5e8b62fbf1c3f60df01f232 (C) or Heavy Dex Trader (see Figure 8)
This wallet received approximately 10.5 million UST on May 8, which was exchanged for USDT on Curve. According to on-chain data, this wallet is related to terra1autyehjkpl9r4h99qa4v66h2tz8589haw9uyxm, terra1rhds9ltx9t5wxq22v9x9j26pk9tuwyykwhm9gy, and terra14geatm83tykw5v3uw6klkcwwqf00tfwk72dq62. These wallets bridged 9.1 million, 737,000, and 615,000 UST from Terra on May 7, totaling approximately 10.5 million UST, consistent with the transactions on Ethereum.
After the Storm: Trading and Arbitrage Activities on Centralized Exchanges
From May 1 to May 20, all accounts marked by Nansen on centralized exchanges received a net inflow of approximately 225 million tokens, including Wormhole-UST and wrapped-UST. In this section, we use "UST" to refer to the aggregated Wormhole and wrapped tokens.
Notably, on May 9, the net inflow of UST to centralized exchanges was strong, with the highest net inflow on May 10 (with 165 million tokens sent to centralized exchanges that day). Our conclusion is that while net selling to centralized exchanges may have dealt the final blow to the deleveraging process, it seems unlikely to have initiated this process. As we described earlier, the swapping of UST for other stablecoins in Curve liquidity pools had already begun before the sales on exchanges.
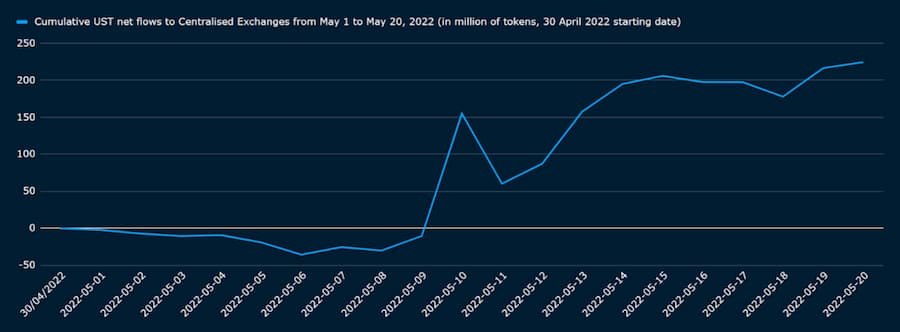
Figure 14: Total Net Value of UST Flowing to Centralized Exchanges
By scanning the top UST net holders on centralized exchanges, we cross-referenced some early wallets (from May 7 to May 8) that exchanged UST through Curve liquidity pools. These wallets may have exited some of their UST positions through Curve and subsequent exchanges.
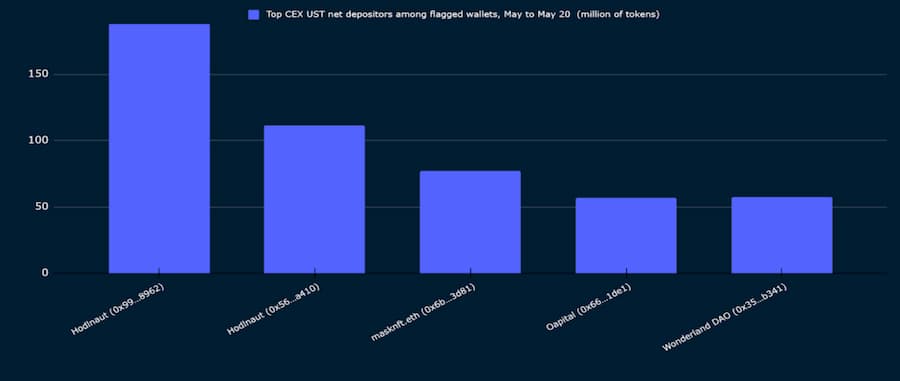
Figure 15: Top Wallets Sending UST to Centralized Exchanges + Early Curve Exchangers + Wonderland (May 1 to May 10)
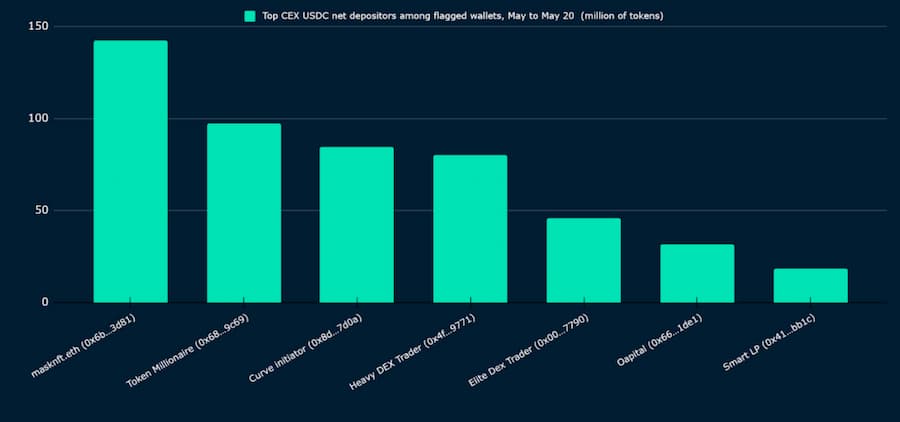
Figure 16: Top Wallets Sending USDC to Centralized Exchanges + Early Curve Exchangers (May 1 to May 10).
Given that most early Curve exchangers had already withdrawn USDC from the liquidity pools, we reviewed the largest USDC holders on centralized exchanges from May 1 to May 20. There, familiar wallets reappeared.
We noted that wallet (A) initiated the first significant UST inflow at 21:57 UTC on May 7 (85 million UST) and received 84.5 million USDC in return, sending a total amount of USDC to Coinbase between midnight and 1 AM UTC on May 8.
While the net inflows to CEX provided high-level insights, we turned to the UST liquidity activities within the previously marked wallets to gain a more nuanced understanding of the on-chain dynamics. We focused on three wallets due to their significant and multiple trading volumes with CEX (Figures 17, 18, and 19).
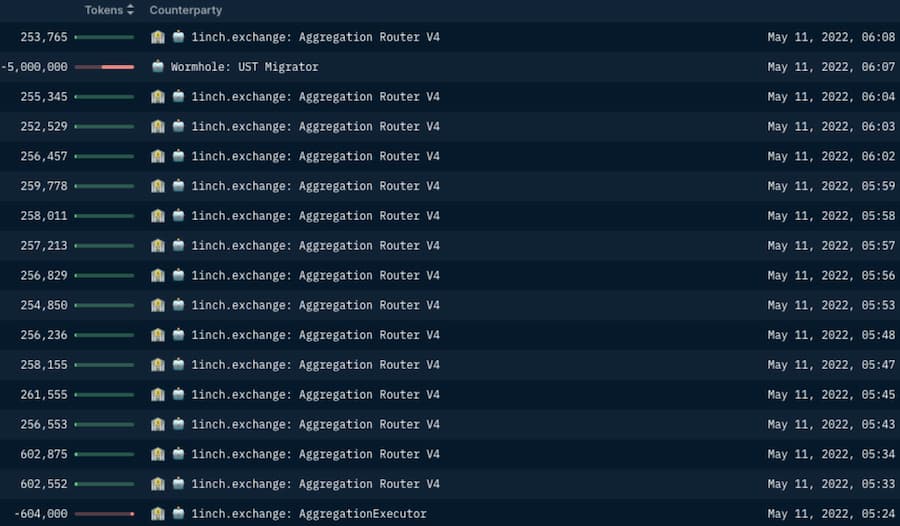
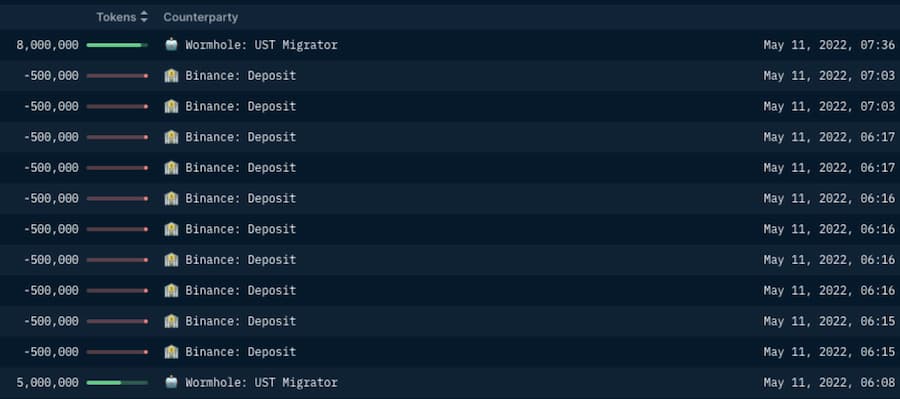
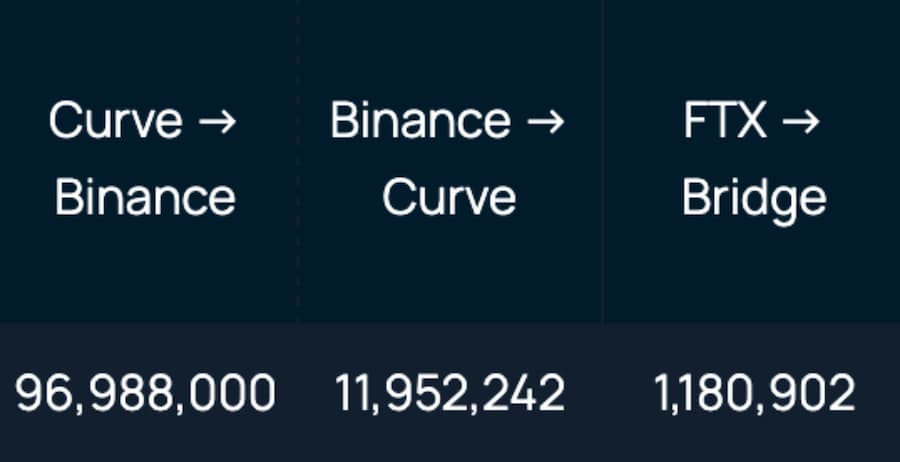
Figure 17: Significant Activity of Masknft.eth -- (Binance to Curve MIM-UST) and (Curve 3pool-Binance).
Masknft.eth had a net outflow of 76.9 million UST to CEXs. We observed that this wallet purchased approximately 96.9 million UST from Curve (via 1inch) and quickly transferred it to Binance.
We also discovered several transactions on May 8 (totaling approximately 11.9 million UST), where masknft.eth transferred UST from Binance and exchanged it for MIM on the Curve MIM-UST pool. While we cannot confirm whether these transfers to Binance were arbitrage trades, our suspicion is that masknft.eth may have purchased UST on Binance during the de-pegging (when UST hit a low of about 0.985 that day) and sold it on Curve for profit when the peg briefly recovered the next day.
While Oapital had a net outflow of 56.9 million UST to CEXs, the wallet's activities were highly diversified and not limited to directional flows like many other wallets we previously identified.
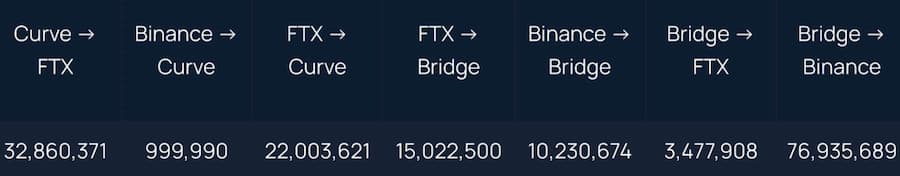
Figure 18: Significant Activity of Oapital
The above table shows that Oapital alone exerted significant selling pressure on Binance, with most unloading activities occurring there. Unfortunately, we could not match the source of UST received from the Wormhole UST migrator contract address.
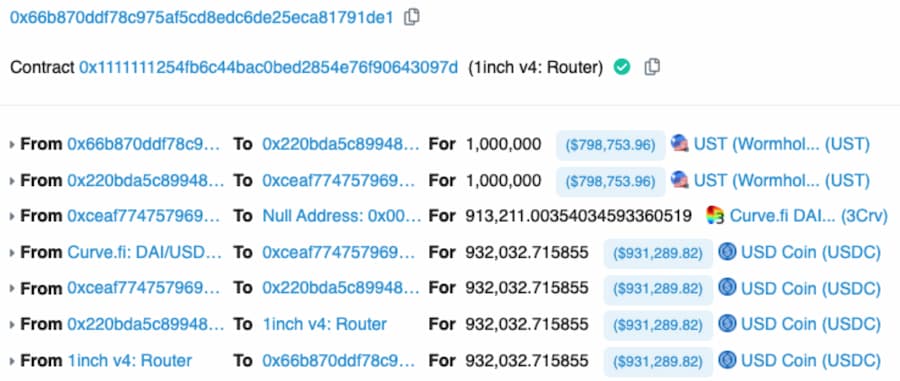
Observing some transactions of Oapital, we noted that this wallet may have achieved significant profits during arbitrage, as seen in one of the transactions above. Assuming the estimated value of the transfer on the day of the transaction on Etherscan accurately reflects Oapital's UST cost, this wallet may have made approximately $132,500 in profit from that single transaction.
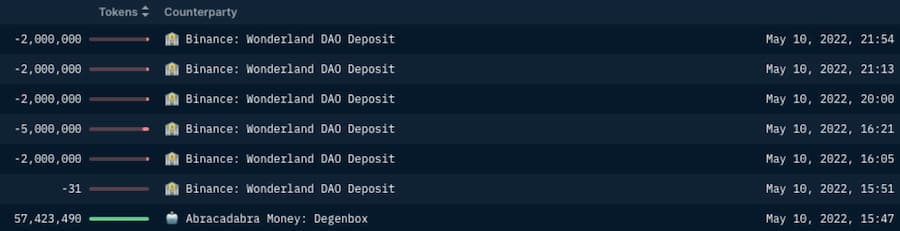
Figure 19: Wonderland DAO's UST Deposits to Binance
In addition to the suspicious addresses mentioned above, we also noted that Wonderland DAO sent 57.4 million UST to Binance between May 10 and 11, after liquidating their Abracadabra Degenbox.
Seven "Suspect Addresses" That May Have Had a Significant Impact on UST's Final De-pegging
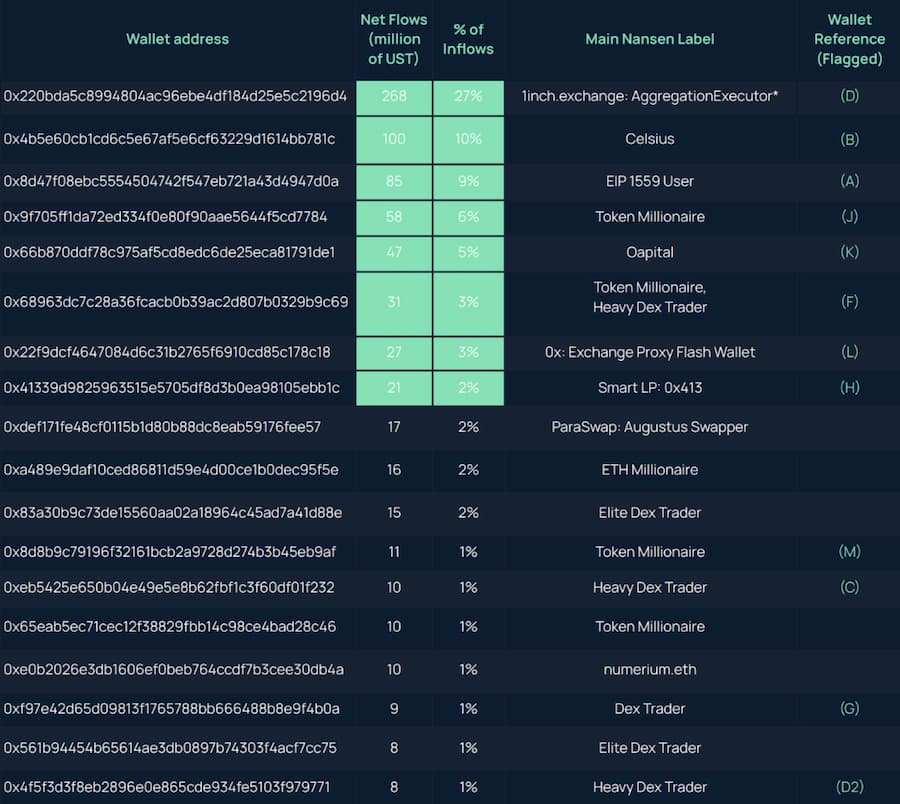
Figure 20: Wallets That May Have Had a Significant Impact on UST De-pegging
Conclusion
Given the severity of the financial and psychological consequences of the UST de-pegging, many narratives about "what happened" are flooding the internet. Our analysis utilized on-chain data to interpret what occurred before and during the UST de-pegging. By examining on-chain activities, we found that a few wallets and possibly even fewer entities behind these wallets led to the imbalance in the Curve liquidity protocol that regulates the parity between UST and other stablecoins.
As early as the evening of May 7 (UTC), seven wallets exchanged large amounts of UST and other stablecoins on Curve. These seven wallets withdrew significant amounts of UST from the Anchor protocol on May 7 and earlier (as early as April) and bridged UST to the Ethereum blockchain via Wormhole. Among these seven wallets, six interacted with centralized exchanges, sending more UST (reportedly to sell) or, for one subset, sending USDC obtained from the liquidity pool on Curve.
This on-chain study refutes the notion of a "attacker" or "hacker" sabotaging UST. Instead, we found that a few players discovered and exploited vulnerabilities—particularly those related to the shallow liquidity of Curve pools—which led to the following events:
Withdrawing UST funds from Terra's Anchor protocol.
Bridging these funds from Terra to Ethereum via Wormhole infrastructure.
Exchanging large amounts of UST for other stablecoins in Curve liquidity pools.
During the "de-pegging" process, some of these wallets may have exploited inefficiencies and price differences between various pricing sources (Curve, decentralized exchanges DEX, centralized exchanges CEX) to engage in arbitrage trading between CEX and DEX.
Epilogue: On-Chain Data, From Forensics to Risk Management
Given that this study focuses on on-chain data, we will refrain from commenting on the targets of the seven wallets that triggered this series of events. We only wish to add one point to supplement our on-chain investigation: having a robust risk management framework while operating in the cryptocurrency market, especially during periods of macro-financial market turbulence, is an indispensable part of conducting expected return analyses.


