How to invest in the NFT track through data?

 Learning the "Data Quantitative Analysis Framework" and "Research Qualitative Analysis Logic" will enable you to better discover and capture the value of NFTs and their tokens in the NFT industry, while effectively identifying various opportunities embedded in new NFT projects.
The author of this article is NFT Labs
Today, NFTs are experiencing explosive growth, but while users are paying attention to this sector, they often feel that information in the NFT world is quite fragmented, such as hundreds of domestic and international NFT exchanges on various chains. This makes it difficult for newcomers to have an immediate macro understanding of the NFT field, so understanding comprehensive data in the sector becomes crucial.
Currently, CoinMarketCap and CoinGecko have become essential entry points for finding NFT-related data, knowledge, and information. Platforms of this nature are often referred to as "Data Aggregators," and "aggregation" helps users directly capture the vast majority of content value.
Therefore, for anyone looking to gain a deeper understanding of NFTs, they can form a clear thinking framework about the NFT industry through data frameworks and qualitative analysis.
1. Quantitative Data Analysis Framework
Horizontal Data - Time Dimension
In the horizontal dimension of data, it is divided into historical data, recent data, and current data. For example, the historical market trends of NFTs within 7D/30D/90D, as well as the latest NFT market performance. Observing the timeline to understand the corresponding data fluctuations is crucial. Additionally, some cumulative data, such as total trading volume for each project and total holders, is also worth referencing.
Vertical Data - Peer Comparison
In the vertical dimension, comparing NFT types/projects is also important. Investors need to understand the market share of different NFT fields, such as trading cards, artworks, collectibles, and virtual worlds, as well as the current market share of each NFT type. The trading volume share of specific NFT projects is also worth noting, as some leading projects may account for more than half of the total trading volume. Through this data, users can easily determine whether a project is in the first tier or the second tier. Weekly trading volume is also worth paying attention to, such as whether it exceeds $100,000 or $10,000.
Granular Data - Sub-indicators
In addition to macro market data, we also need data from segmented dimensions to gain a more specific understanding of NFT projects.
For example, project detail page views are reflected in search result frequency, number of traders, trading volume, number of NFT holders, and community activity. For a specific NFT asset, users can also learn about historical transaction prices, buyers, or sellers through historical trading data.
With the support of this data, investors can more easily hold, manage, and invest in NFT assets. For instance, the recently popular Bored Ape Yacht Club had an issuance price of 0.08 ETH for each ape, along with their subsequent price fluctuations and changes.
We can also assess the potential of specific NFTs based on market trading records. In the NFT market, we can find past trading data; although historical data may not predict the future, it can serve as a reference standard for pricing during buying and selling.
Moreover, project detail page views, search result frequency, number of traders, trading volume, number of NFT holders, and community activity can also serve as influencing factors to help make better investment decisions.
Token Data - Investment Opportunities
In terms of NFT tokens, it is necessary to understand their market capitalization, trading volume, listing status, project ecosystem, community building, etc., to identify which projects have significant potential, the return rates of projects, the average price increases, and which projects have the largest increases over different time dimensions.
2. Qualitative Analysis Logic
In addition to analyzing NFT data, what aspects should we consider to assess the investment value of NFTs? There are three aspects to reference.
Practicality
First is practicality; the practical value depends on how the NFT is used. The two main categories with high practical value are game assets and tickets. Another aspect of practicality is the ability to use NFTs across different applications. Imagine if you could use the same asset in different games; such NFTs would have relatively higher value.
Ownership History
Second is ownership history; the value of an NFT depends on the identity of its issuer and previous owners. NFTs with high ownership history value are typically created or issued by renowned artists or companies with strong brands. You can find the addresses of whale holders and list their other NFTs as a reference indicator.
Liquidity
Third is liquidity. High liquidity means a higher value for NFTs. Liquidity is one of the factors that measure whether an NFT has higher value. NFTs that comply with ERC-721 or ERC-1155 standards can be easily traded on secondary markets with anyone holding ETH, which increases the number of potential buyers to some extent. Investors may prefer to invest in NFT categories with high trading volumes because liquidity reduces the risks of holding NFTs. In extreme cases where NFTs lose practical value after related platforms shut down, high liquidity NFTs still retain value as long as there are buyers and sellers. On the other hand, NFTs not based on Ethereum standards are affected by a lack of liquidity, and the value of NFTs created on these platforms is often discounted.
3. Discovering Value, Capturing Value
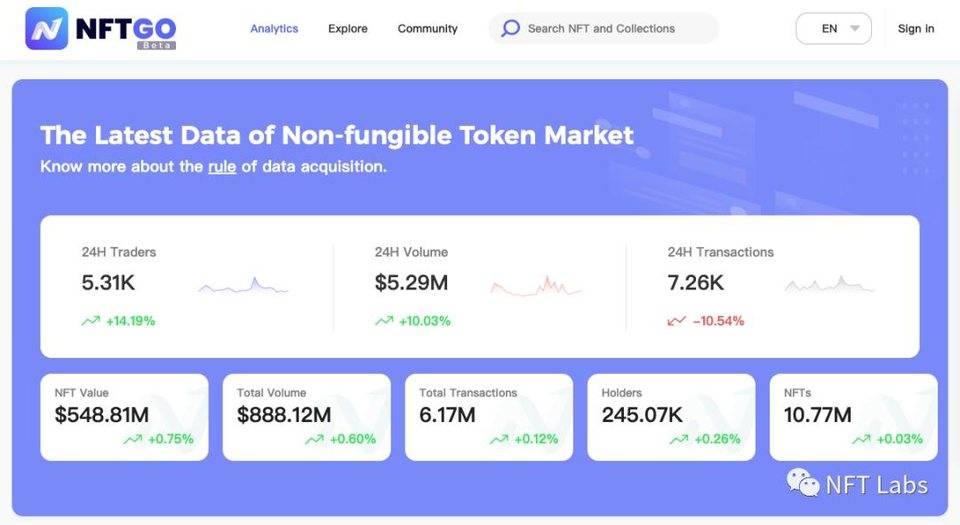
Using data from NFTGO as an example, let's further analyze several key points regarding data dimensions.
First, attention should be paid to overall NFT market data. This includes real-time NFT trading and asset data, including NFT market capitalization, total trading volume, total transaction volume, and the number of NFTs and their holders, which are used to assess the overall market trend and popularity of NFTs.
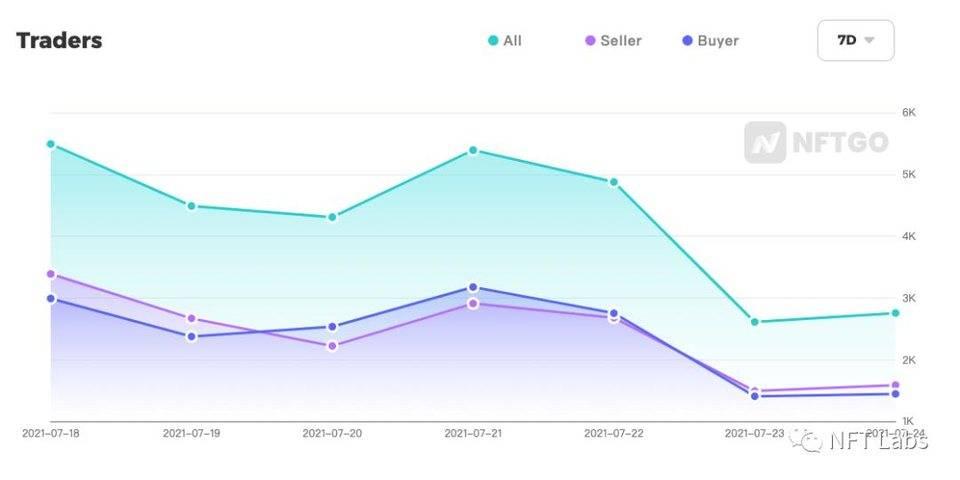
Second, one can look at market data trends over the past 7 days / 30 days / 90 days, as well as the buyer and seller market ratios, to assess market supply and demand through these macro data.
As mentioned above, NFT liquidity, to some extent, reflects the turnover rate of NFTs, which is a very important indicator. This concept is also common in the stock market, where turnover rate is often used to measure the liquidity of a stock. The higher the turnover rate, the more active the trading of that stock, indicating higher overall quality and investment value.
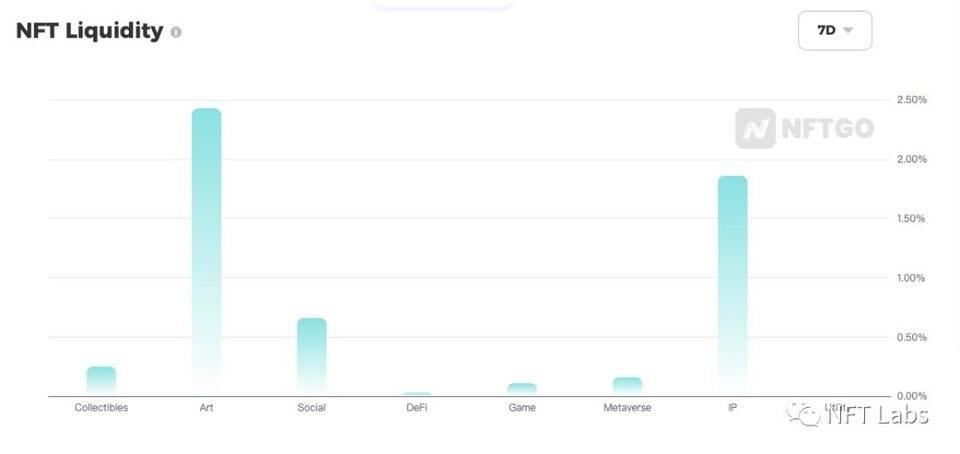
The concept of liquidity is similar; this indicator can measure the ability of NFTs to be smoothly liquidated at a reasonable price. This is particularly important for those who do not intend to hold NFTs long-term and wish to profit from buying and selling NFTs; liquidity indicators are indeed one of the must-watch data points.
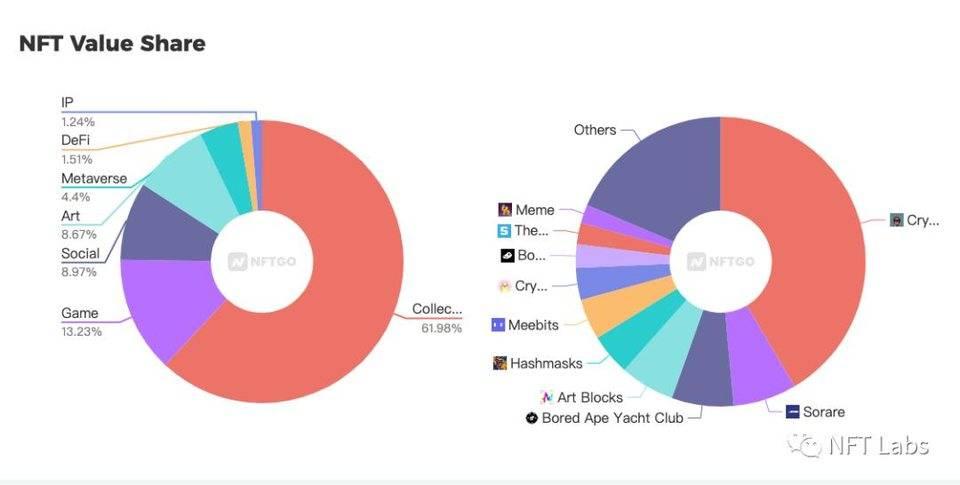
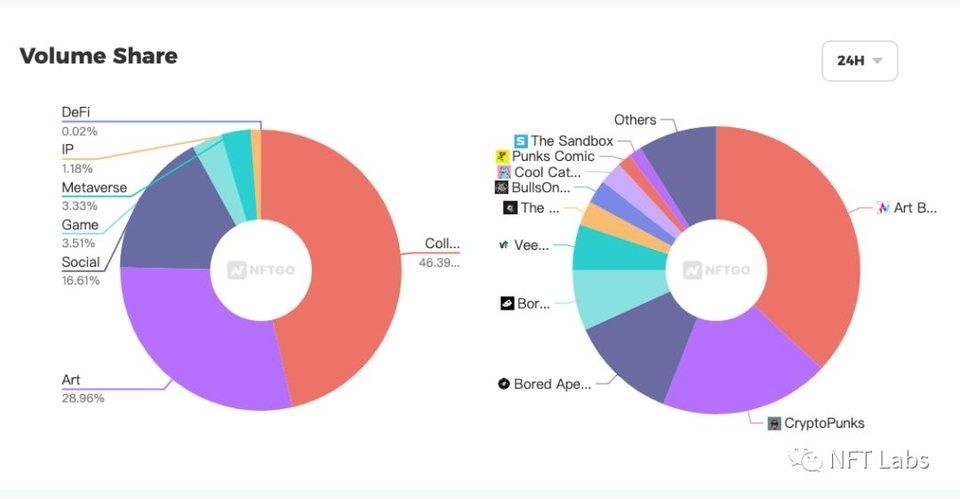
Current NFT market distribution and popular projects are one of the important data dimensions, providing a direct understanding of the hottest NFT subfields and projects in the market. For both newcomers to NFTs and investors, this data can help quickly establish a foundational understanding of the NFT world. Additionally, by observing changes in ratios, one can quickly discover popular projects and sense shifts in NFT market trends.
NFT Rankings
The aforementioned data mostly covers macro dimensions, while granular data at the micro level also requires attention. Which are the high-value projects and assets? Who are the NFT whales? What is the investment value of NFTs versus NFT tokens?
The most typical is the ranking of NFT projects, including rankings by NFT value, fastest appreciating projects, and asset value rankings.
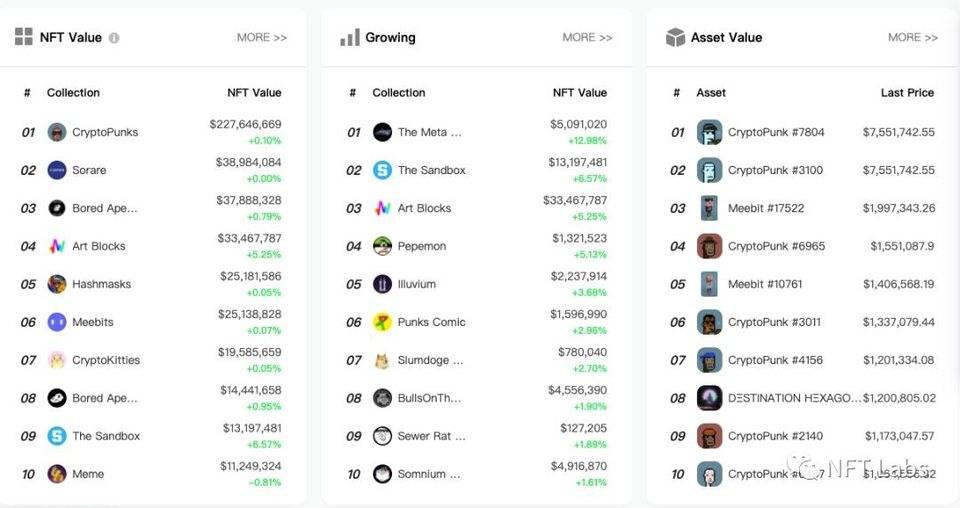
In terms of ranking dimensions and methods, besides market capitalization / growth / number of transactions / trading volume, the previously mentioned liquidity indicators are also included. By sorting, one can quickly discover the currently most liquid NFT projects in the market and capture potential investment opportunities.
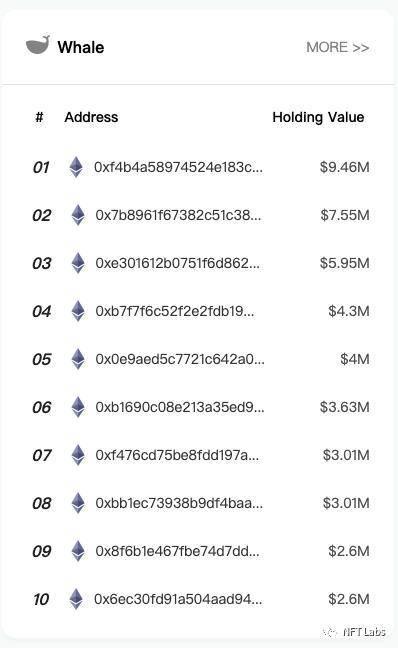
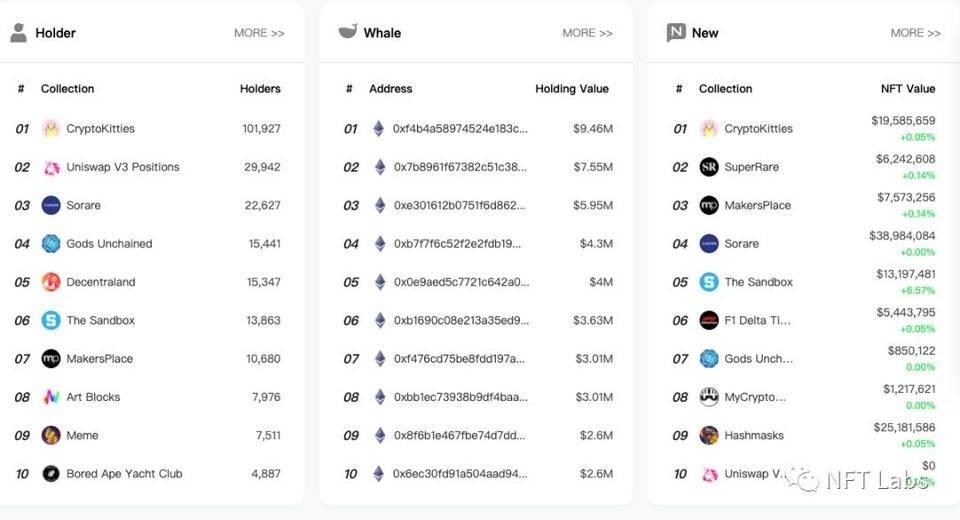
Additionally, it is worth mentioning the whale rankings. Not only can one quickly know the number and value of NFTs held by whales, but one can also glimpse the specific NFTs they hold and their purchasing trends. Some friends indeed choose to follow the footsteps of whales to understand the movements of key market players, which is also a crucial part of exploring market trends.
Although this cannot constitute a scientific basis for investment, by understanding which NFTs whales hold and which NFTs they buy or sell, one might discover some investment opportunities.
NFT Metadata / Natural Language Search
Metadata, also known as Metadata, each NFT pass will have its own Metadata URL, which defines some more detailed information about the NFT, such as the NFT's name, description, image URL, and special attributes. Taking Bored Ape Yacht Club as an example, each ape has different colors, shapes, names, etc. Searching through metadata can help users quickly narrow down the target NFT range.
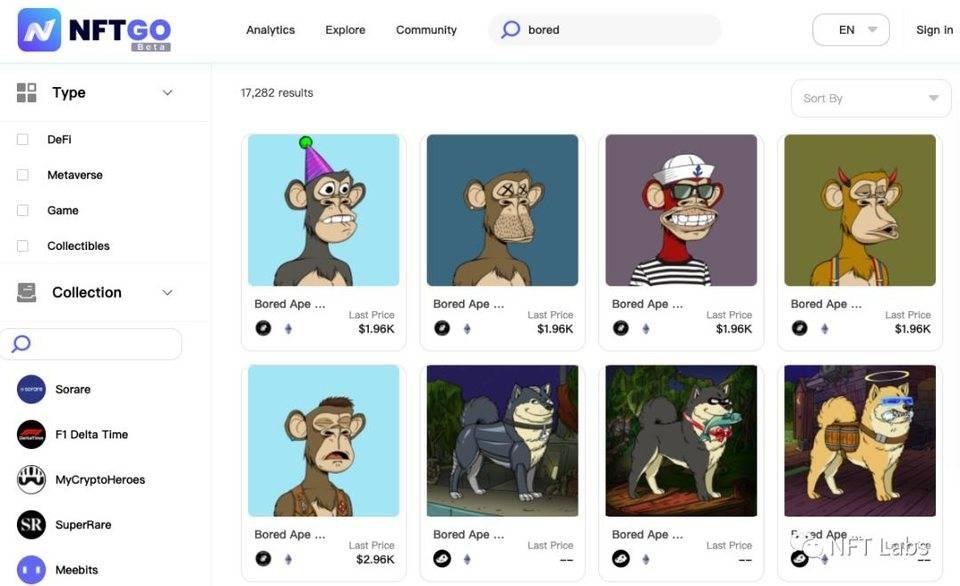
For example, by entering "Bored" in the search box, one can view all Bored Ape assets across the network. For the vast search results, one can further refine the filtering dimensions in the left column by category / project / blockchain, while also sorting by current price / creation time / transaction time.
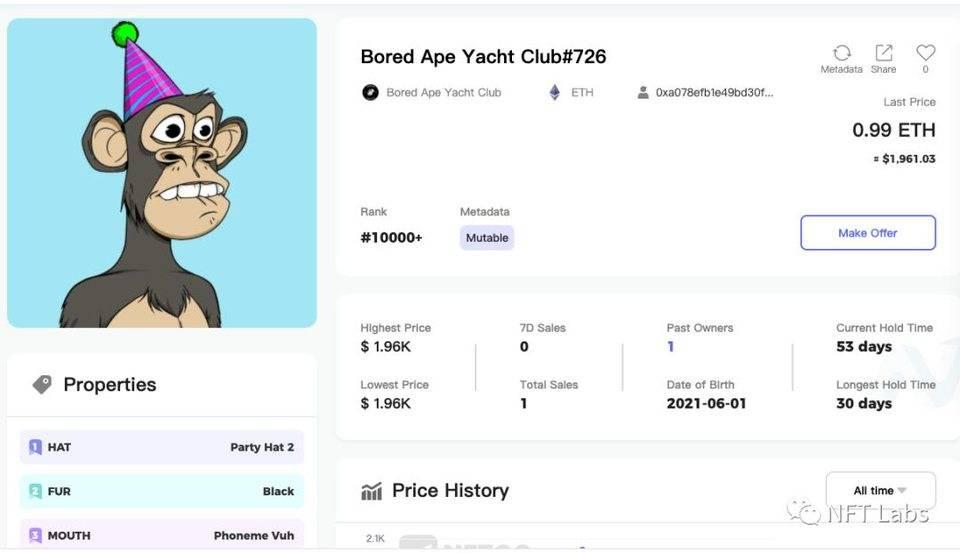
By clicking into a single NFT asset, one can know its basic attributes and all historical transaction information, including transaction counts, transaction times, historical prices, and historical holders. When making NFT purchasing decisions, one can leverage the historical information of that NFT, especially the historical holders. It is worth mentioning that whether an NFT has ever been held by a whale or a celebrity may also be a key decision basis for NFT valuation.
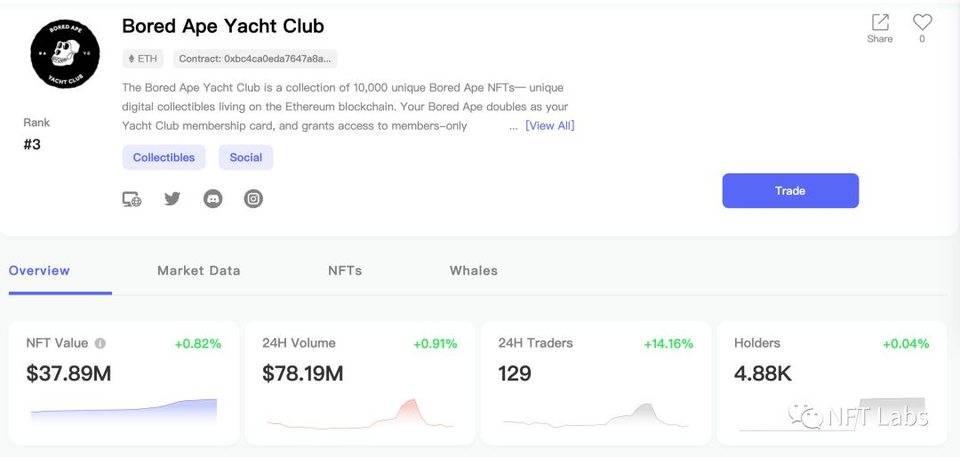
After discussing data dimensions, let's talk about data depth. We need to understand the basic information of the project and its current market performance, such as market capitalization, trading volume, number of NFTs issued, number of holders, and liquidity.
In short, market data is the core of all modeling and analysis tools, not only used to understand the market but also for conducting various correlation analyses between products, such as NFT+Layer2, NFT+DeFi, etc.
Finally, it is crucial to understand what gives NFTs and their tokens value. Regardless of the field, evaluating risks from different perspectives and identifying various opportunities embedded in new NFT projects is a skill that requires better tools.
Original link: https://www.chainnews.com/articles/564694215486.htm